
Policy deep-dive ——— Freeways & the Rose Quarter
Portland is about to runthe experiment by accident.
On September 11 the state closes southbound I-5 through the Rose Quarter for five weeks and sends the traffic to I-405 and I-205, which is very nearly what freeway-removal advocates have been proposing permanently. Both sides have said what they expect to happen. This page publishes those predictions, and the test that decides them, before the closure begins.
- $3.5B
- Cost today
- 1.8
- Miles
- $450M
- Promised in 2017
- Sept 11
- Closure begins
About $400M has been spent or committed. The rest, roughly $3 billion, is essentially unfunded. ODOT's own website still shows an older $1.96–2.08B figure.
For five weeks, Portland gets to see what happens
The argument over this project is, at bottom, an empirical one: if you take lanes away, does traffic find another route, or does some of it stop existing? On September 11 that question gets tested on the actual road, and the detour ODOT has designed sends drivers almost exactly where advocates say the freeway should go permanently.
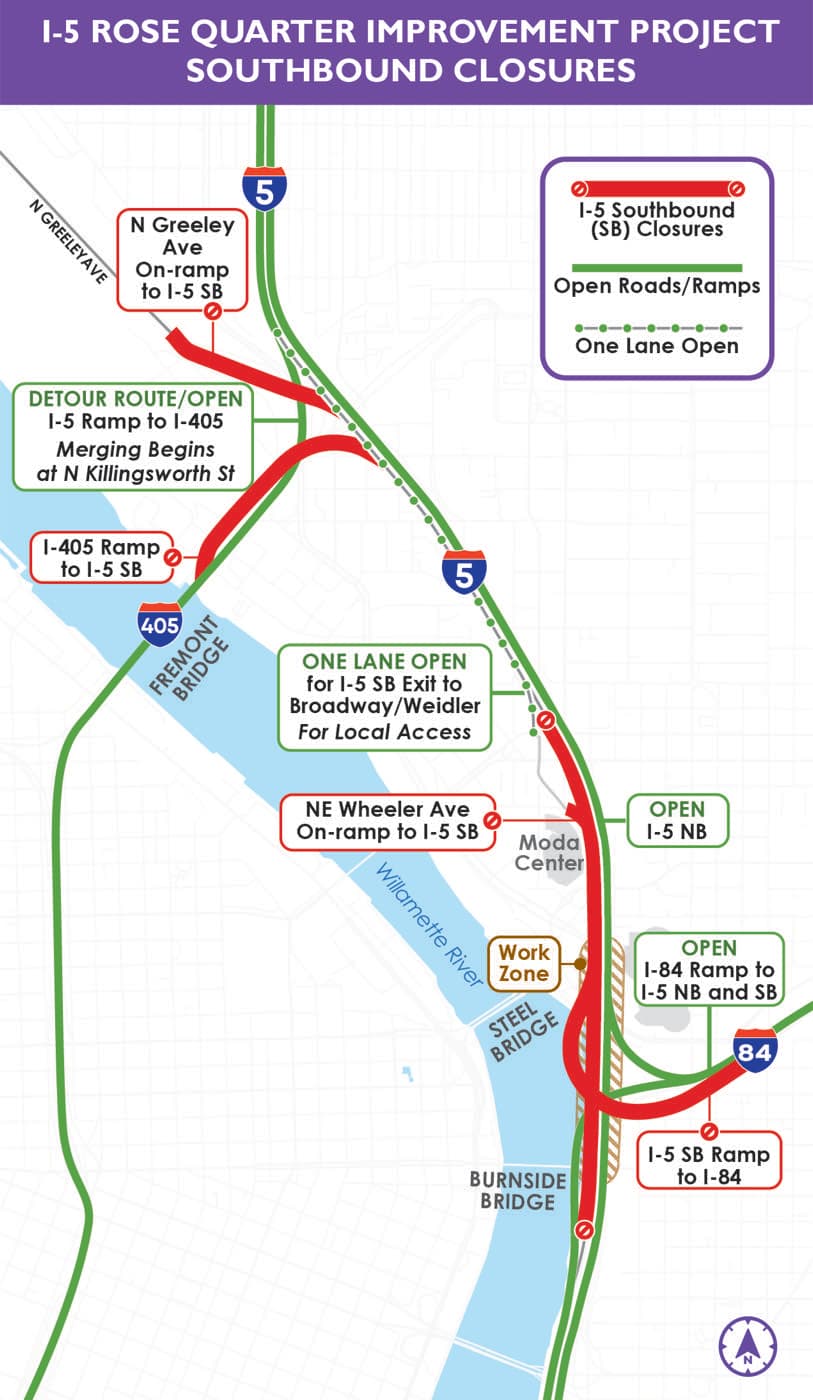
The September closure. Southbound traffic goes to I-405; regional traffic is sent to I-205, which is, near enough, what removal advocates propose permanently.
Oregon Department of Transportation · original · retrieved 2026-08-13
Everything below — the thresholds, the 25 traffic detectors, the baseline method — was published before the closure began. A test written afterwards proves nothing, because whoever writes it already knows the answer.
What ODOT expects
Quoted verbatim from the agency's own closure notice.
“Travel times on I-5 near the project site could be two to three times longer than a typical travel day if every driver sticks to their normal travel patterns.”
ODOT closure notice, 2026-05-04
“Congestion on I-5 southbound during the morning and afternoon commutes is expected to extend into Vancouver.”
ODOT closure notice, 2026-05-04
What the research literature predicts
The reduced-demand hypothesis, from the transportation literature.
After an initial shock of a few days, traffic redistributes and conditions settle close to normal, because some trips are not made at all. This is the mirror image of induced demand, formalised by Anthony Downs in 1962 and repeatedly observed after unplanned closures elsewhere.
Our formulation · Downs, The Law of Peak-Hour Expressway Congestion, Traffic Quarterly, 1962
Some trips disappear rather than move. This is the claim that actually bears on whether the corridor needs more lanes, and the hardest one to measure, which is why the method below spends most of its effort on it.
Our formulation · Melo, Graham & Canavan, Effects of Road Investments on Induced Travel Demand, 2012
ODOT's forecast is quoted verbatim, with a date. The other column is the reduced-demand hypothesis from the transportation literature — well documented after closures elsewhere, though no Portland organisation has forecast this one. If anyone with a stake here wants a specific, dated prediction scored against this method, send it before September 11 and it goes up alongside the rest.
What we will measure, and what would settle it
Borne out if peak travel time on the path I-5 approach → I-405 → I-5 south reaches 2.0× the matched baseline on at least 3 of 5 weekdays in week 3. Partly, if 1.5–2.0×.
Borne out if peak speeds at Washington I-5 stations north of the Interstate Bridge fall to 60% of baseline on 3 of 5 weekdays, and the same drop is absent northbound.
Borne out if peak travel time on the realistic path is within 1.25× the matched baseline on at least 4 of 5 weekdays in week 3. Partly, if 1.25–1.5×.
Demonstrated if southbound volume across the two Columbia River crossings in week 3 falls to 0.95 or less of the matched baseline, and the drop exceeds two standard deviations of normal day-to-day variation. At 0.98 or above, traffic merely diverted.
25
detectors, named in advance
Stations may only be dropped by a mechanical data-quality rule, never added. Dropped ones are still listed.
2025
matched weekdays as baseline
Only the three clean days of clean pre-closure weekdays exist, so the primary comparison is the same weekdays a year earlier.
Week 3
the scoring window
Chosen now, not later. Day one gridlock and day thirty free flow are both real and both meaningless on their own.
Telling diversion from evaporation, and why it is hard here
If traffic simply moves to I-405 and I-205, that tells us the road network has slack — it says nothing about whether Portland needs more lanes. The claim that bears on $2 billion is stronger: that some trips stop being made at all. Distinguishing the two is usually impossible, because traffic can leak onto streets nobody counts.
One clean instrument exists, thanks to geography. There are exactly two road crossings of the Columbia River in the metro area, and both are metered. Nothing can slip around them; the next bridge is forty miles east. For traffic coming south out of Washington, the count across those two bridges is a direct measure of trips taken.
But that instrument is narrower than it looks, and we would rather say so now than discover it in October. The cordon only sees trips that cross the river. A large share of southbound traffic at the Rose Quarter never does — it enters from North and Northeast Portland, south of both bridges, and the cordon is blind to all of it. Our own detector data shows volume changing substantially between the river and the Rose Quarter, which means local traffic is a major component, not a rounding error.
So the cordon is a strong test of one clearly-defined slice of the problem, not a verdict on the whole of it. We will also report a screenline between the river and the Rose Quarter to size the local share directly, and where the arterial counts needed to close the gap do not exist, the page will say so rather than quietly narrowing the claim.
≥ 0.98
Pure diversion
Same trips, different road. Says nothing about needing lanes.
≤ 0.95
Evaporation
Trips not made by car. Only counts if the drop also clears two standard deviations of ordinary variation.
≥ 1.02
Longer trips
Diversion that added mileage — I-205 is the longer way round. A real outcome, rarely reported.
This is a five-week closure, not a freeway removal.
People behave differently when they know a disruption ends. For five weeks you can defer a trip, take vacation, work from home, or put up with a longer drive. You do not move house, change jobs, or buy a transit pass, and those are the adjustments that would matter most if these lanes were gone for good.
That cuts both ways, and we do not know which way it cuts harder. A temporary closure can make traffic look like it evaporated when the trips were only postponed. It can equally understate the long-run effect, because the durable changes that drive most reduced demand never get a chance to happen in five weeks.
So this closure can settle whether either side's extreme case is wrong. It cannot settle the $2 billion question. Anyone who tells you it did, in either direction, is selling something.
Corridors instrumented: I-5 southbound — the closed section (1.0 mi) · I-5 southbound — below the I-84 merge (1.6 mi) · I-5 northbound — the control direction (2.2 mi) · I-405 southbound — the detour (1.8 mi) · I-405 northbound — control (2.9 mi) · I-5 southbound — the approach (0.8 mi) · I-5 southbound — downstream of the merge (2.3 mi). Data from PORTAL, the Portland State University transportation data archive.
Three times, the same neighborhood
You cannot understand why Albina Vision Trust supports a freeway project, or why its opponents are so careful about how they say no, without this. The land under and beside I-5 was a Black neighborhood, and it was taken three separate times in fifteen years.
In 2025 Portland approved a settlement for displaced Albina residents and their descendants, later increased to $8.5M (KGW). The city's own housing bureau documents this history in detail.
Veterans Memorial Coliseum
~450 homesThe arena and its parking took the heart of a neighborhood that held the largest concentration of Black residents in Oregon — a concentration produced by racial covenants and redlining, not by choice.
Fair Housing Council of OregonI-5, the Minnesota Freeway
300+ homesDemolished directly and never replaced. In 1960 Lower Albina had about 3,000 residents, roughly two-thirds of them Black. The indirect damage exceeded the direct: the freeway severed the street grid and the local economy went with it.
City ObservatoryEmanuel Hospital urban renewal
171 householdsAbout three-quarters Black, a third of them homeowners, taken by eminent domain across 55 acres. The federal money never arrived, but the demolition went ahead anyway, and the land sat vacant for decades.
Portland MercuryA figure of “3,000 families displaced by I-5” circulates widely. We do not use it: it appears to conflate the roughly 3,000 residents of Lower Albina in 1960 with families, and it is not supported by the documented count of homes taken. The real numbers are bad enough without inflating them, and inflating them is how a true story gets dismissed.
That history explains the one position in this fight that confuses outsiders. The organisation that carries Albina's interests is not for the freeway and not against it — it is deliberately agnostic on the lanes (Albina Vision Trust). Every other actor in these rooms is solving for something else: freight throughput, climate, congestion, an arena. “Is this good for the neighborhood?” is the question that has historically landed at the bottom of the list — that is how the neighborhood was destroyed the first time, and holding it first, to the exclusion of every other cause, is the entire strategy.
What is actually being built
ODOT is emphatic that no new through lanes are added — the project adds one auxiliary lane in each direction, full shoulders, and a cover carrying streets and buildings over the freeway (ODOT). Critics say total paved width is the number that matters and that the roadway ends up wide enough to stripe for ten lanes. Both can be true at once, which is why this argument never resolves.
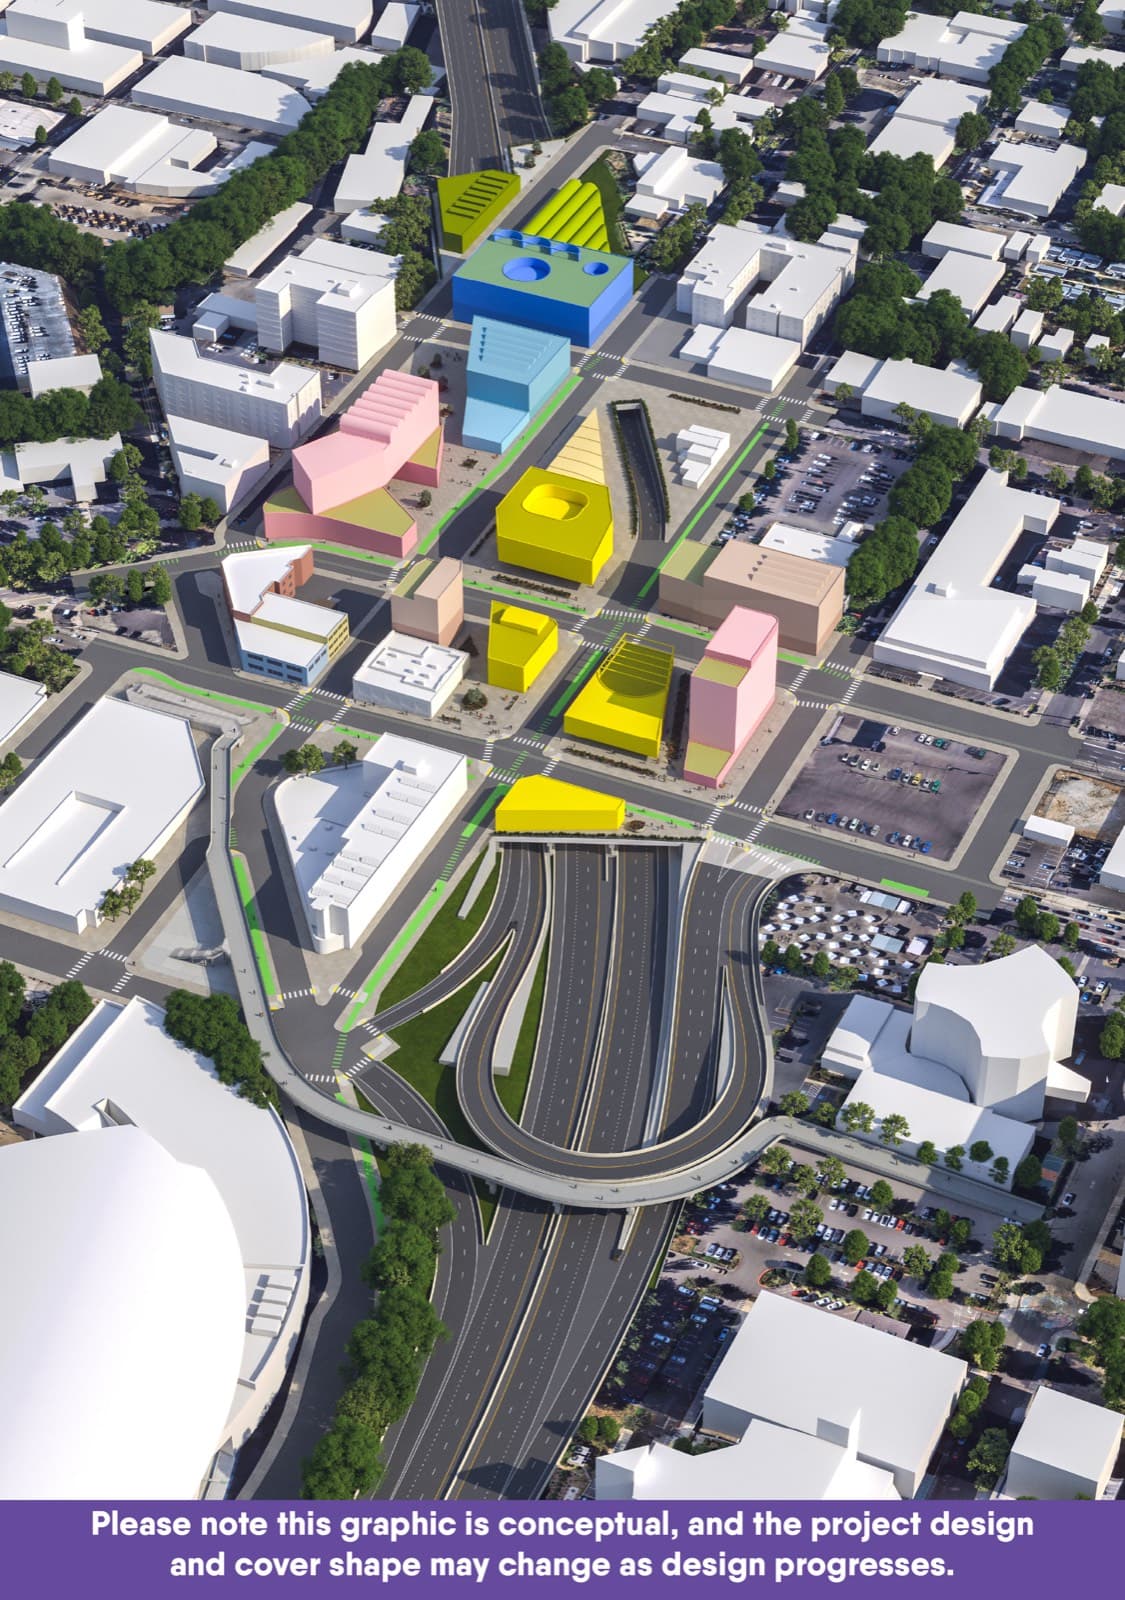
ODOT's rendering of the highway cover. The freeway runs underneath; the streets and buildings on top are the point of the project.
What it leaves out: It does not show the flyover ramp, and it shows buildings across the whole deck — in the current design only about four of the roughly seven acres can carry them.
Oregon Department of Transportation · original · retrieved 2026-08-13
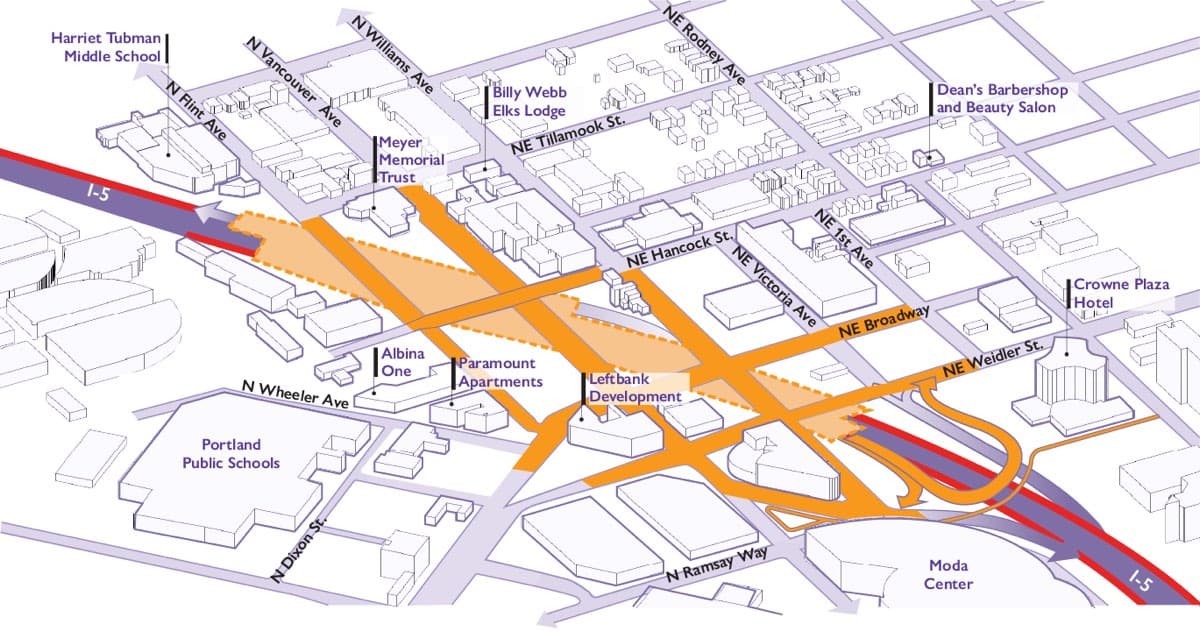
The lanes. ODOT is careful to call these auxiliary lanes, ramp-to-ramp connections, rather than through lanes, and the distinction is the centre of the dispute.
What it leaves out: It does not show total paved width, which is what critics say makes the roadway stripeable to ten lanes.
Oregon Department of Transportation · original · retrieved 2026-08-13
The distinction that decides everything: can you build on it?
A landscaped lid over a freeway is a park. A lid engineered to carry buildings is a neighborhood. Under the current design the cover creates about 7.1 acres of new surface, of which roughly 4 are buildable — three storeys at the north end, up to six at the south. That gap between total and buildable is the thing Albina Vision Trust spent years fighting over, and it is why they walked away from the project in 2020 and came back in 2021.
Published acreage figures conflict — 4, 7 and 8 acres all circulate, sometimes because the buildable number is quoted as if it were the total. We use 7.1 total and 4 buildable, from the 2024 environmental review (ODOT / FHWA).
“Highest crash rate” is doing a lot of work in that sentence
ODOT's crash statistic is a rate, and the crashes behind it are overwhelmingly low-speed property damage — the rear-enders congestion produces, not the collisions that kill people. That distinction matters because ODOT's own safety policy prioritises fatal and serious-injury crashes, the standard most agencies now work to.
By that measure the state's deadliest facilities are not interstates at all. They are the old “orphan highways” that predate the interstate era and now run as arterials through neighborhoods while still being managed like highways — TV Highway, 82nd Avenue, Powell, Barbur. Those roads have the fatalities. The Rose Quarter has the fender-benders and the headline.
The rest of what comes with it
The project is not only lanes and a lid. It restores street connections severed in 1962, adds a crossing that has never existed, and rebuilds the surface network around the arena. These are ODOT's own maps of each piece.
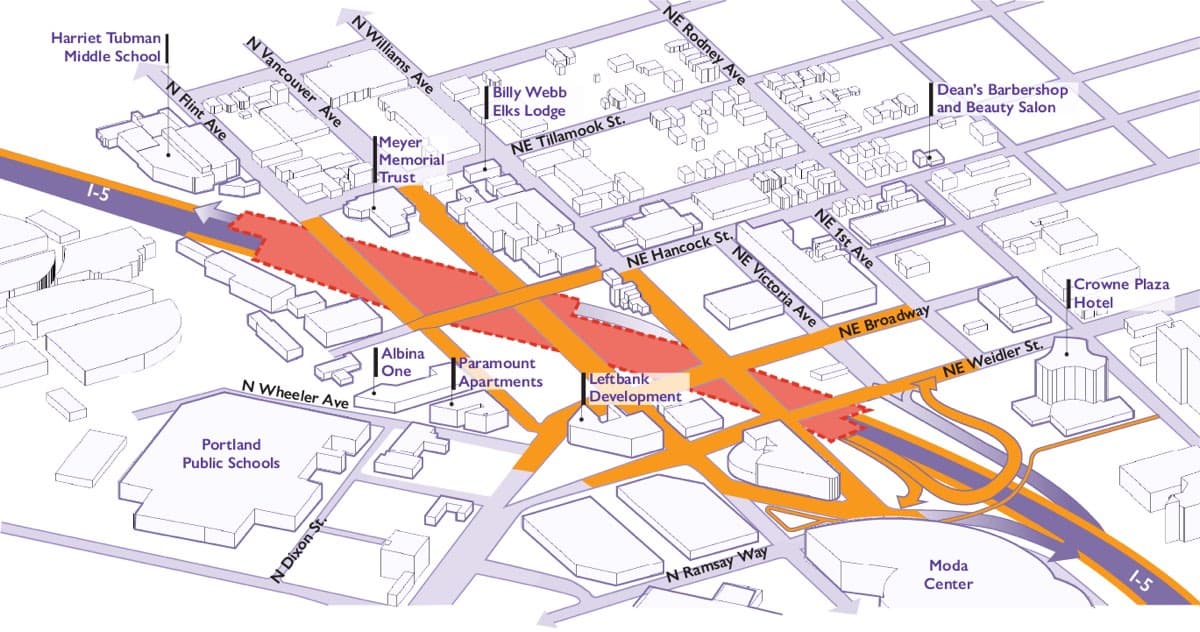
Where the cover goes: one continuous lid, not several separate lids.
Oregon Department of Transportation · original · retrieved 2026-08-13
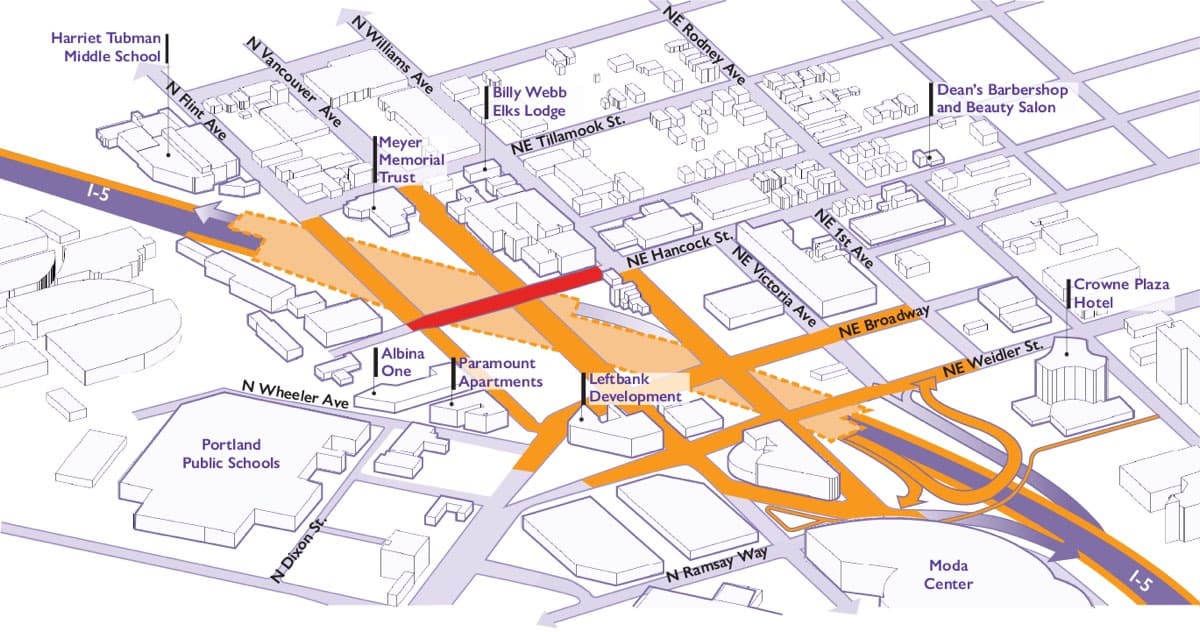
The Hancock crossing — a street connection that does not exist today.
Oregon Department of Transportation · original · retrieved 2026-08-13
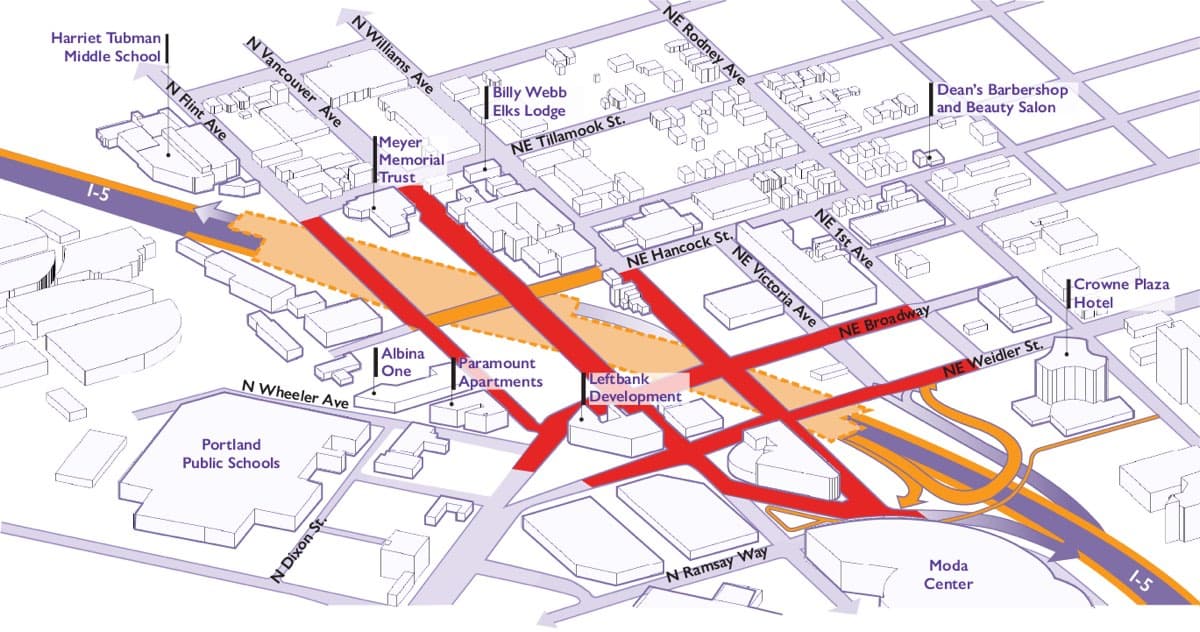
The surface street network that comes with the project.
Oregon Department of Transportation · original · retrieved 2026-08-13
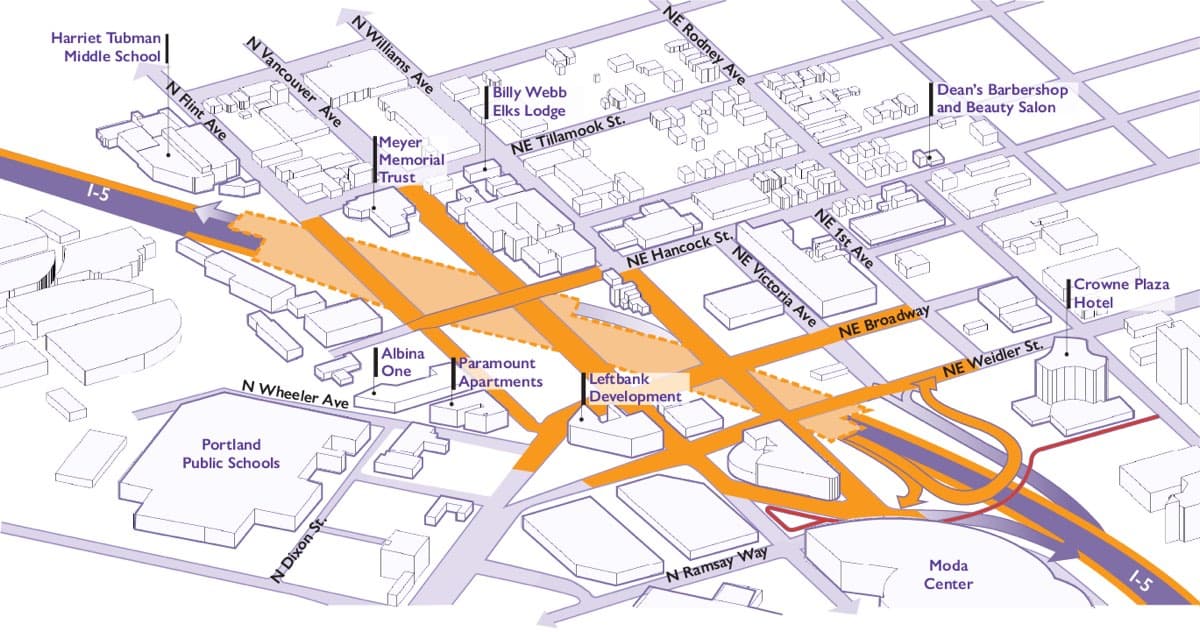
A car-free crossing of the freeway, added back into the design in the 2024 revision.
Oregon Department of Transportation · original · retrieved 2026-08-13
How the design changed, and who changed it
| 2012 | 2017 | 2022–24 | |
|---|---|---|---|
| Cost | $300–400M | $450M | $1.9B → $2.1B |
| Flint Avenue | Flint Avenue bridge demolished | Still demolished; replaced by a steep Hancock–Dixon bike bridge | Flint restored as a neighborhood street on the cover |
| The cover | Two or three separate lids | Two lids | One continuous buildable cover, ~7 acres |
| Ramps | Entrance ramp moved to Weidler | As 2012 | Southbound off-ramp moved south to Wheeler, plus a new flyover to Weidler |
| What moved it | Adopted into the N/NE Quadrant Plan. One planning commissioner voted no. | A motion to strike the project failed 6–4. No More Freeways formed that August. | Redesign followed the community trust's 2020 walkout and its two public demands: make amends, and make the covers buildable. The flyover came later, after the Blazers objected. |
Read the bottom row across and you can see who actually has leverage here. Flint Avenue came back when Albina Vision Trust withdrew from the project. The flyover appeared after the Trail Blazers filed a twenty-page objection. Neither change came from the environmental review.
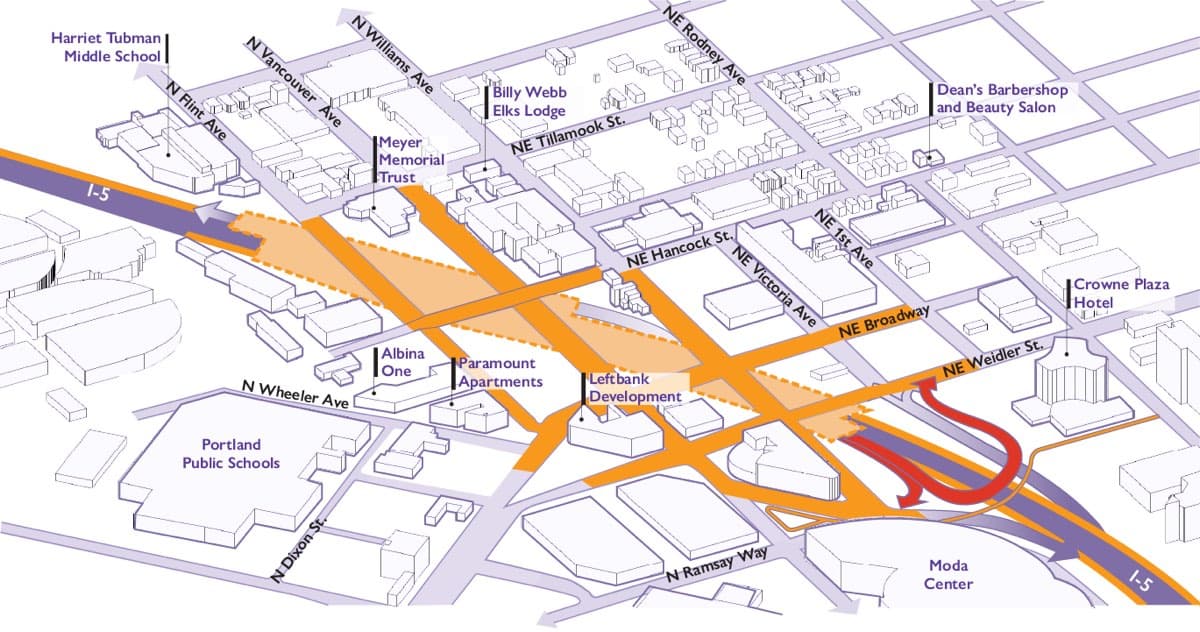
The relocated southbound off-ramp and its flyover — the design change that followed the Trail Blazers' objection, and one of the changes at the centre of the comprehensive-plan lawsuit.
Oregon Department of Transportation · original · retrieved 2026-08-13
The ramp the Blazers got
In January 2023 Rip City Management, which runs the Moda Center and hosts roughly 250 events a year, about half of whose visitors arrive on foot or by bike — filed a twenty-page objection to the relocated off-ramp, warning of a 210-degree turn and four extra crossings through crowds. They hired an architecture firm and a law firm to make the case (Willamette Week).
A flyover ramp appeared in the next design cycle and was folded into the 2024 environmental review. ODOT has never itemised its cost; the nearest public figure bundles it into a ~$170M package. And ODOT's own safety analysis concedes the new ramp configuration fails Highway Safety Manual standards and would increase crashes by about 13%.
One correction to the obvious story: testimony in the comprehensive-plan case indicates the flyover was proposed by the City — the Portland Bureau of Transportation — rather than invented by ODOT to appease the arena. Who benefits and who suggested it are different questions, and the documented sequence supports the first more than the second. We have not been able to read the transcript ourselves, so this is flagged as unverified.
The strongest case for building it
Built from ODOT's stated purpose, Albina Vision Trust's published position, and the labour and freight coalition that carried this project through the Oregon Transportation Commission in December 2025 — not from the version that is easiest to argue against.
The cap is the mitigation the freeway never paid
The community position on this project has never been a vote for the lanes, and, less noticed, never a vote against them either. It is deliberately agnostic on the widening, with one narrower demand: if the state runs a project through this neighborhood, it must tunnel the freeway. Environmental review already forces mitigation of air and noise; the deeper injury is structural. A freeway trench organises an entire district around moving cars through it, and a walkable neighborhood is close to impossible beside one. On this view the cap is not an amenity. It is remediation of the original harm, owed the same way air-quality mitigation is owed.
When those terms weren't met, the trust walked out — its 2020 withdrawal demanded amends and covers engineered to carry buildings, and the project stalled for two years until it got them. The rebuilding of Albina is proceeding on acquired land regardless; the cap decides whether it happens beside an open trench or on top of a healed street grid.
Willamette Week, 2020This is the state's most crash-prone urban interstate
ODOT's case rests on geometry, not volume: a two-lane section with no full shoulders where three interstates converge, so a stalled car or a merge conflict has nowhere to go. The auxiliary lanes exist to separate merging traffic from through traffic, which is the specific movement that produces rear-end crashes here.
ODOT reports a crash rate about 3.5 times the statewide I-5 average, the highest on any urban interstate in Oregon, and projects up to a 50% reduction.
ODOTIt is the only two-lane pinch point on I-5 between Canada and Mexico
I-5 is the west coast's freight spine. This section is the narrowest urban link on the entire route, and freight cannot reroute the way commuters can — a truck bound for the Port of Portland is not going to take transit. Oregon's economy runs through a bottleneck that was designed for 1960s volumes.
About 11,700 trucks a day, roughly 10% of traffic, carrying more than $100 million in goods daily. ODOT ranks it Oregon's worst bottleneck and among the worst freight bottlenecks nationally.
ODOTThe structures need rebuilding anyway
The overcrossings are old, seismically deficient, and sit on a viaduct whose deck was last replaced in 1985, which is exactly why it is being torn out this September. If the bridges must come down and go back up regardless, the marginal cost of doing it in a configuration that also carries a neighborhood is smaller than the headline number suggests.
Phase 1A, already under construction, is largely seismic retrofit and bridge preservation, and adds no through capacity.
ODOT, I-5 Rose Quarter Improvement ProjectIt is a jobs programme for the community that was harmed
The project carries workforce and contracting commitments aimed specifically at Black-owned firms and apprentices — the most concrete redistribution on the table, and the reason organised labour and a number of Black contractors have backed it while some advocacy groups have not.
ODOT projects roughly 2 million labour hours and up to $150 million in payroll and benefits directed to minority- and women-owned firms.
ODOTThe strongest case against building it
Built, as far as possible, from ODOT's own file and the historical record rather than from advocacy, because that is where this case is strongest. Its best evidence is the agency's own consultant, the agency's own safety report, and the Eisenhower administration's own public works planner.
ODOT's own consultant found the cheaper alternative works better
A July 2022 memorandum attached to the project's own Supplemental Environmental Assessment found that pricing the road would cut traffic and raise speeds more than the widening would — for more than a billion dollars less. ODOT's environmental review then stated that congestion pricing was not considered. That is not an advocacy claim about the project; it is the project's own file.
The same review that omitted pricing is the one now being challenged in federal court for failing to consider alternatives.
City Observatory, on ODOT's July 2022 memo, 2022Adding lanes to an urban freeway does not durably reduce congestion
This is not a new or contested finding. Anthony Downs formalised it in 1962: on urban commuter expressways, peak-hour congestion rises to meet capacity. Sixty years of evidence since has been consistent. A wider road at the Rose Quarter buys some years of relief and then returns to congestion, with more vehicles in the same space.
Downs's Law of Peak-Hour Expressway Congestion, Traffic Quarterly, 1962 — published four years before this section of I-5 opened.
Anthony Downs, Traffic Quarterly, 1962The safety case does not survive ODOT's own safety analysis
ODOT quotes a crash RATE, and the crashes behind it are overwhelmingly low-speed property damage — the rear-enders congestion produces, not the collisions that kill people. ODOT's own safety policy prioritises fatal and serious-injury crashes, and by that measure the state's deadliest roads are the old orphan highways that predate the interstate era and now run through neighborhoods while still being managed like highways: TV Highway, 82nd, Powell, Barbur. Metro has said the state never showed this section is unusually dangerous for serious crashes. More pointedly, ODOT's own modelling concedes the relocated ramp fails Highway Safety Manual standards and raises crashes.
ODOT's August 2022 safety technical report projects roughly a 13% crash increase from the new ramp configuration versus no-build. Spending $3.5 billion at the state's fender-bender capital while its fatality corridors wait is a choice, not a safety programme.
City Observatory, on ODOT's Aug 2022 safety report, 2022Putting the freeway here was never the plan, and the government said so at the time
The standard defence of urban interstates is that they were a national decision made long ago. The record says otherwise. In March 1960, Eisenhower's own Special Assistant for Public Works Planning wrote that interstates should not be aimed at the centres of congestion, that inner loops should not be part of the system, and that practically all experts agreed transit was the answer for cities. Eisenhower himself said that routing interstates through congested cities was against his original concept and that he never anticipated it.
Bragdon's interim report reached the President in 1960. The highway departments kept building, because the federal match paid 90 cents on the dollar for roads and nothing for transit.
Gen. John S. Bragdon, Special Assistant for Public Works Planning, 1960The economics stopped working decades ago
Highway investment returns were extraordinary when the network was new and have fallen steadily ever since, to the point where urban expansions are generally poor investments. Meanwhile the user-pays story has quietly collapsed: road user fees now cover only about half of roadway spending nationally, with the rest drawn from general taxes paid by everyone, including people who do not drive.
Estimated returns fell from about 55% in 1949–50 to roughly 13% by 1990–2000. Subsidies now exceed $500 per vehicle per year.
Todd Litman, Victoria Transport Policy Institute, 2026You can cover a freeway without widening it
This is the crux, and the bundle has two origin stories that are both true. The state's interest was always the freight bottleneck — the lane is the point, the neighborhood incidental. The caps entered the project as the local price of permission, when the city, the county and Metro made clear the widening would never be permitted without them. Since then the marriage has been forced in both directions: either both things happen or neither does, which means opposing the lanes is made to look like opposing the neighborhood, and defending the neighborhood means carrying the lanes.
Opponents note there is no binding obligation compelling ODOT to build the covers once the lanes are widened. AVT's counter is that the covers cannot be built without the highway work. Notably, no published document has ever priced the covers-without-widening option — it has never been analysed at all.
BikePortland, 2025The alternative that was never analysed
Both sides can be sincere and still talk past each other, because they are arguing about different things. But one fact sits underneath the whole dispute and neither side really contests it.
A July 2022 memorandum attached to this project's own environmental assessment found that pricing the road would cut traffic and raise speeds more than the widening would, and cost more than a billion dollars less. The environmental review then stated that congestion pricing was not considered.
That is not an advocacy claim about the project. It is the project's own file (City Observatory, reporting the memo). It is also the core of the federal lawsuit, and the reason the state case cites Portland's Central City Plan, which requires pricing analysis before I-5 is widened.
Then Oregon killed the alternative anyway
In March 2024 — six weeks after the federal approval was signed, two months before the first lawsuit — Governor Kotek halted regional tolling (BikePortland). The politics were straightforward: tolling would have landed first on Clackamas County commuters with no transit alternative, in swing legislative districts, and a poll found 91% opposed.
So the cheaper option that ODOT's own consultant preferred was removed from the table by the Governor, while ODOT's environmental review said it had not been considered. Whatever you think should be built here, that is not how a $2 billion decision is supposed to get made.
And a second alternative that was never analysed either
Pricing is the alternative everyone argues about. But there is another one that has never been costed in any published document: build the covers without widening the freeway. If the goal is reconnecting Albina, that is the option that delivers it most directly, and no environmental review, no design report and no funding request has ever priced it.
Its mirror image finally got asked out loud at the August 2026 Transportation Commission meeting, where a commissioner asked what the project would cost without the covers. That the question is only being raised now, nine years and $400 million in, is its own answer about how this project was scoped.
The question nobody will put to a vote
Nothing in the engineering requires the covers and the extra lanes to be one project. The bundle is political, and it was tied from both ends. In Salem the project has always been about freight — the lane is the point, the neighborhood incidental. Locally, the caps became the price of permission: the community trust walked out in 2020 demanding amends and buildable covers (Willamette Week), the city withdrew the same day, and Portland only rejoined two years later with the covers as a condition (BikePortland).
So the forced marriage cuts both ways: either both things happen or neither does. Opposing the lanes is made to look like opposing the neighborhood; defending the neighborhood means carrying the lanes. One camp answers that nothing legally obliges ODOT to build the covers once the lanes are in; the other, that the covers cannot be built without the highway work and that six years of community process should count for something. Both are right about the thing they are pointing at, and the camps are closer than the public sparring suggests: in 2019 they were jointly demanding a full environmental review (BikePortland).
From $450 million to somewhere north of $3 billion
Every cost figure below is dated and attributed, because the number has moved so often that quoting it without a date is meaningless, and because ODOT's published estimate and its internal draft estimates are currently more than a billion dollars apart.
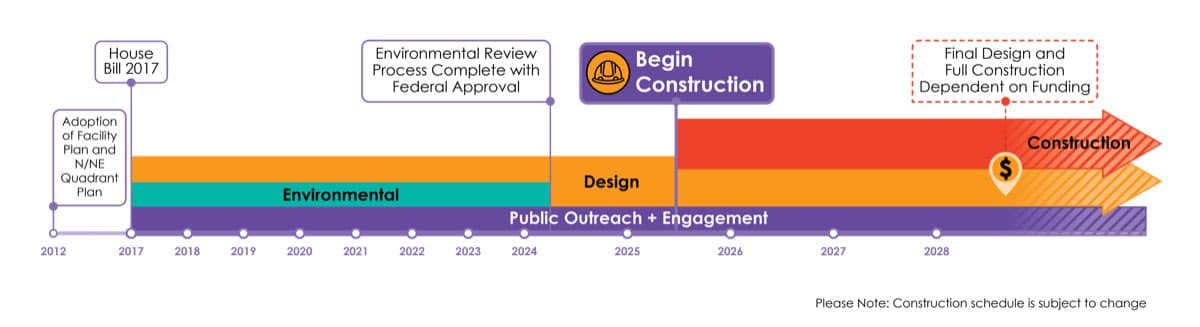
ODOT's own schedule, as revised in March 2026.
Oregon Department of Transportation · original · retrieved 2026-08-13
$450M
promised in 2017
The figure legislators voted for when they raised transportation taxes.
$3.50B
the estimate as of August 2026
About 7.8× the 2017 number, for 1.8 miles.
$400M
actually spent or committed
Phases 1A and 1B. Everything after that, the widening and the covers, is roughly $3B, and essentially unfunded.
Not all of that growth is waste. The 2017 figure bought a lane project; the current one includes a buildable cover that did not exist in the original scope, and Oregon has since lost roughly $388 million of federal money that was meant to pay for exactly that piece. But the gap is now larger than the entire original project: about $400M has been spent or committed, and the remainder is unfunded. The chair of the Oregon Transportation Commission put the underlying problem plainly in 2025: “We have a credibility problem right now.”
Roads stopped paying for themselves a long time ago
Most support for highway expansion rests on an intuition that drivers fund the roads they use. Nationally, that has not been true for decades, and the returns on new urban highway capacity have been falling since the 1950s.
51%
of US road spending is covered by drivers
Down from 71% at its peak. The rest comes from general taxes everyone pays.
$500+
subsidy per vehicle, per year
A lower-bound estimate — it excludes parking, crash and pollution costs.
55% → 13%
returns on highway investment
From the Interstate's first decade to its last measured one. Urban expansions now sit at the bottom of that range.
| The argument | The counterargument | What would be better |
|---|---|---|
| Everybody uses roads, so everybody should pay — including non-drivers. | Roads do provide basic access that benefits everyone, but that only requires minimal capacity. The additional cost of roads designed to move large volumes of cars at speed is a cost of serving drivers. | User fees should recover roadway costs, priced higher for larger vehicles and peak-period driving. |
| Roadway expansions reduce congestion, which benefits everybody. | Urban roadway expansions provide little long-term congestion relief, and degrade access by every other mode in the process. | Implement cost-effective congestion pricing before expanding roads. |
| Roadway investment increases economic productivity. | In urban regions with mature transport systems, productivity declines with increased road supply and rises with improvements to non-auto modes and density. | Invest in the most cost-effective accessibility improvements, which are seldom roadway subsidies. |
| Road user fees and tolls are regressive and harm lower-income drivers. | Underpricing roads harms lower-income travellers overall, by increasing traffic and entrenching car dependency. User fees are less regressive than most alternatives, including sales taxes. | Favour affordable modes. Where subsidy is justified on equity grounds, target it rather than granting it to higher-income drivers. |
Framework adapted from Todd Litman, Roadway Costs, User Revenues and Cost Recovery Trends, April 2026.
Two lawsuits, three withdrawals, no ruling
Neither case has ever reached a decision on the merits. Both have nonetheless changed the project, because ODOT keeps pulling documents rather than defending them.
Multnomah County Circuit Court
Filed May 2024No More Freeways, Neighbors for Clean Air, Oregon & SW Washington Families for Safe Streets, BikeLoud PDX, Eliot Neighborhood Association
The project is incompatible with Portland's Comprehensive Plan and Metro's Regional Transportation Plan. The Central City Plan requires congestion-pricing analysis before I-5 is expanded; the regional plan requires showing that demand management cannot solve the problem first. Petitioners say ODOT produced neither. They also argue the ramps have moved so far from what Council adopted in 2012 that the plan must be amended before this can be built.
If they win: ODOT must either conform the project to the plan or get the City to amend the plan to describe what is actually being built, which would force a City Council vote the project has so far avoided.
Status: ODOT withdrew its finding of compatibility 11 days before the July 2025 trial, then let the 30-day window to refile lapse, and re-executed findings that August. The trial was reset to January 2026. We could not verify what has happened since.we could not verify this further — see method
U.S. District Court, District of Oregon
Filed August 2024The same coalition, plus the Association of Oregon Rail Transit Advocates
The March 2024 Finding of No Significant Impact is unlawful. A project of this size significantly affects the human environment, so NEPA requires a full Environmental Impact Statement. The specific defects alleged are outdated traffic modelling, inadequate climate and air analysis, and a failure to study alternatives — including the congestion pricing ODOT's own consultant found would work better.
If they win: The federal approval is vacated and the project returns to environmental review. That happened once already: the FHWA rescinded an earlier finding in January 2022 rather than litigate, costing about two years.
Status: Was heading to merits briefing in late 2025. No ruling found as of August 2026.we could not verify this further — see method
Three withdrawals, no merits ruling. Every apparent legal victory here has come from ODOT pulling a document rather than a judge striking one down. Which tells you what the strategy is. On a project whose cost compounds every year, delay is not a consolation prize — it is the most effective weapon available, and both sides know it.
What the land would be worth instead
The serious alternative is not “do nothing.” It is price the road first, and then ask whether the Eastbank Freeway needs rebuilding at all when I-405 already connects at both ends. Portland studied exactly this in 2005 and then stopped talking about it (ODOT).
I-345, Dallas — removal analysis
The land freed by removing an elevated urban freeway, valued by the city's own analysis.
- 377
- acres freed
- $9B
- development potential
- $255M
- annual property tax
- 26K
- housing units
Inner Loop East, Rochester — completed 2017
The clearest completed precedent: about a third of a downtown loop removed and replaced with a street grid.
- $22M
- cost to remove
- $229M
- development that followed
- +50%
- walking
- +60%
- cycling
A ten-to-one return, and the traffic did not gridlock. That is the precedent removal advocates point to, though Rochester removed a lightly-used downtown loop, not a stretch of the west coast's primary freight route, and the difference is real.
The argument that reframes the cost
The Eastbank Freeway and the Marquam Bridge will both need major reconstruction within a generation. If that bill is coming regardless, the honest comparison is not “spend billions to remove a freeway” but “spend billions to rebuild one, or spend less and not have it.” That reframing is what turns removal from a utopian proposal into a budgeting question, and it is the strongest version of the case advocates make.
What happens next
Four dates that determine whether this gets built, and in what form.
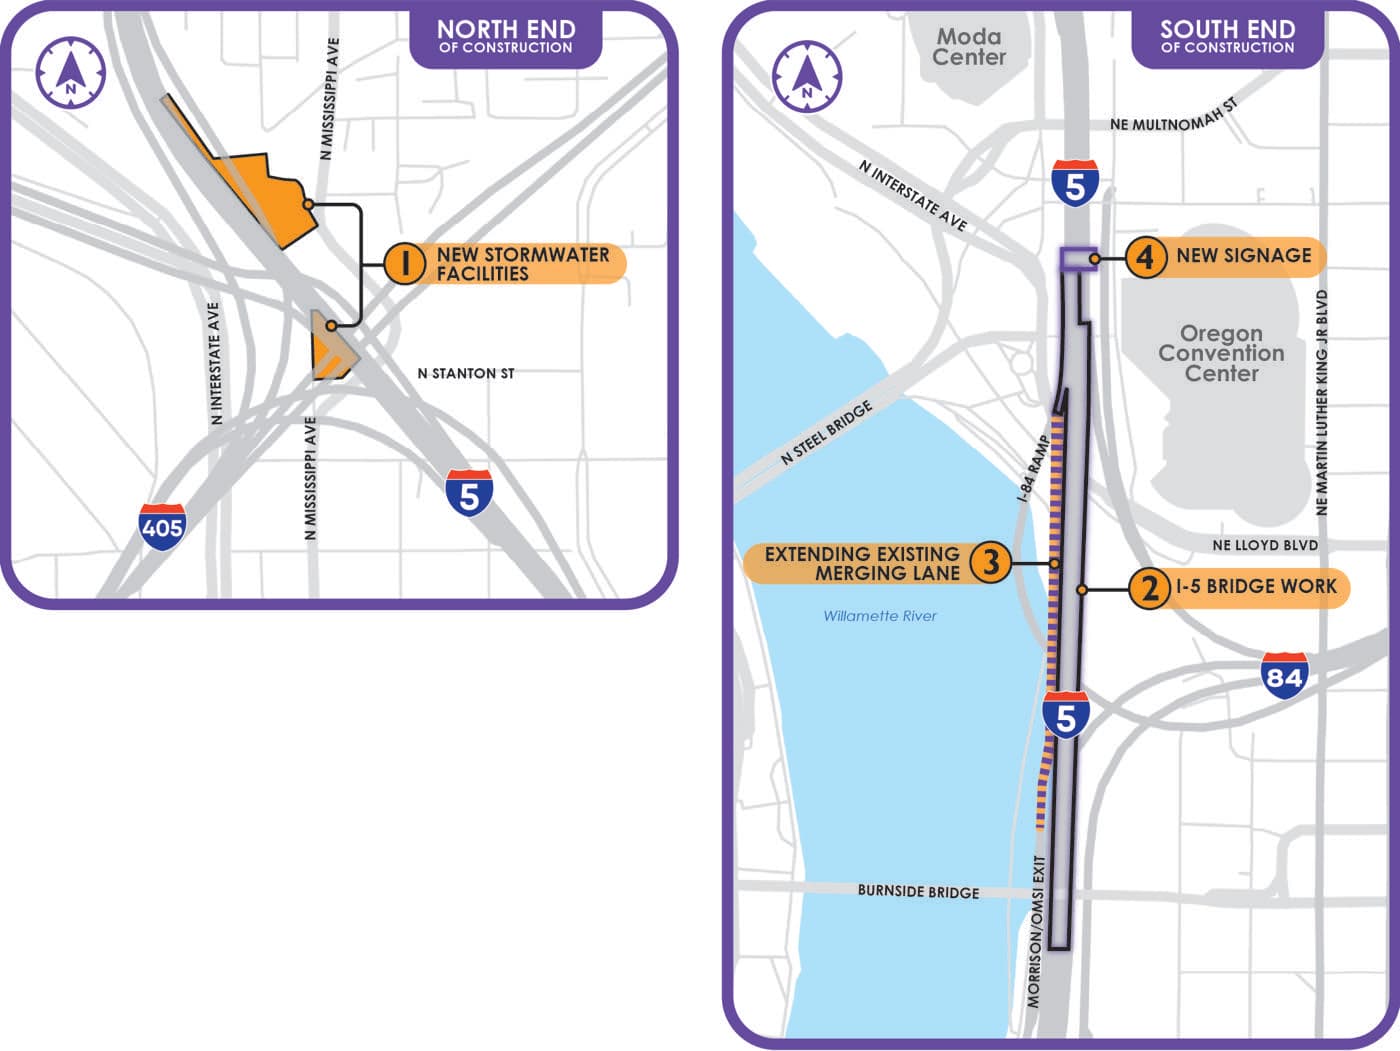
Phase 1A, the only part under construction: stormwater facilities and seismic retrofit. It adds no through capacity.
Oregon Department of Transportation · original · retrieved 2026-08-13
Sept 11 – mid-Oct 2026
Southbound I-5 closes for up to five weeks
The natural experiment. Traffic goes to I-405 and I-205 — close to what removal advocates propose permanently.
Late 2026
Phase 1A finishes
Stormwater and seismic work. No new through capacity, and nothing that commits the state to the widening.
2027
$167.5M of Phase 1B construction
The first money that starts building the contested configuration. Stakeholders reached alignment on the scope in March 2026.
2027 session
The Legislature decides the project's fate
About $400M is spent or committed; the remaining ~$3B is unfunded. The covers' federal grant, the largest its program ever made, was rescinded, and restoring it would take a different federal administration. The state decides whether to carry the project until that question is answered.
Ripe for decision
A ruling in the comprehensive-plan case (Multnomah County Circuit Court, No. 24CV23141)
The parties have filed their written closing arguments, so the case awaits the judge. A ruling for the plaintiffs could force a City Council vote on whether the project conforms to the city's plans. Flagged to the Lab by a reader on August 18, 2026; the docket is the source of record.
Unscheduled
A ruling in the NEPA case
The federal case could send the project back to environmental review.
How this was built, and what we could not verify
Every figure here traces to a linked document. Where the record runs out, we say so rather than filling the gap.
What we could not verify
- The status of both lawsuits. Press coverage stops after the state trial was reset to January 2026, and we have not yet been able to pull the docket. A trial appears to have been held; until we can read the record we are not going to describe its outcome. Treat every status on this page as current to the last verifiable filing, not to today. This is the biggest gap on the page and the one we are working on first.
- Who originated the flyover. Testimony in the state case reportedly attributes the proposal to the City rather than to ODOT. We have not read the transcript.
- An itemised cost for the flyover ramp. Only a bundled ~$170M package figure exists publicly.
- That the Blazers' objection caused the flyover. The sequence is documented; the causation is not sourced, so we describe the sequence only.
- Absolute crash counts for the corridor. ODOT publishes a rate multiple, not the underlying injury and fatality breakdown.
- “Most expensive highway project per mile in the US.” The arithmetic supports something close to it, but no ranking body certifies this. We do not assert it.
- The August 2026 Transportation Commission figures. The ~$3.5B estimate and the ~$400M committed-to-date figure were presented at a meeting held the same day this page was written. We link the Commission's materials page; the individual documents were not yet indexed when we published.
On the traffic measurement
Detector data comes from PORTAL (Portland State University), the Portland State University archive of regional freeway sensors. We archive every day we pull, with a checksum, so that if PORTAL later revises a figure the change shows up as a reviewable difference rather than silently altering a published result. Station lists, time windows and thresholds were fixed on 2026-08-13 and cannot be changed without an amendment that appears on this page.