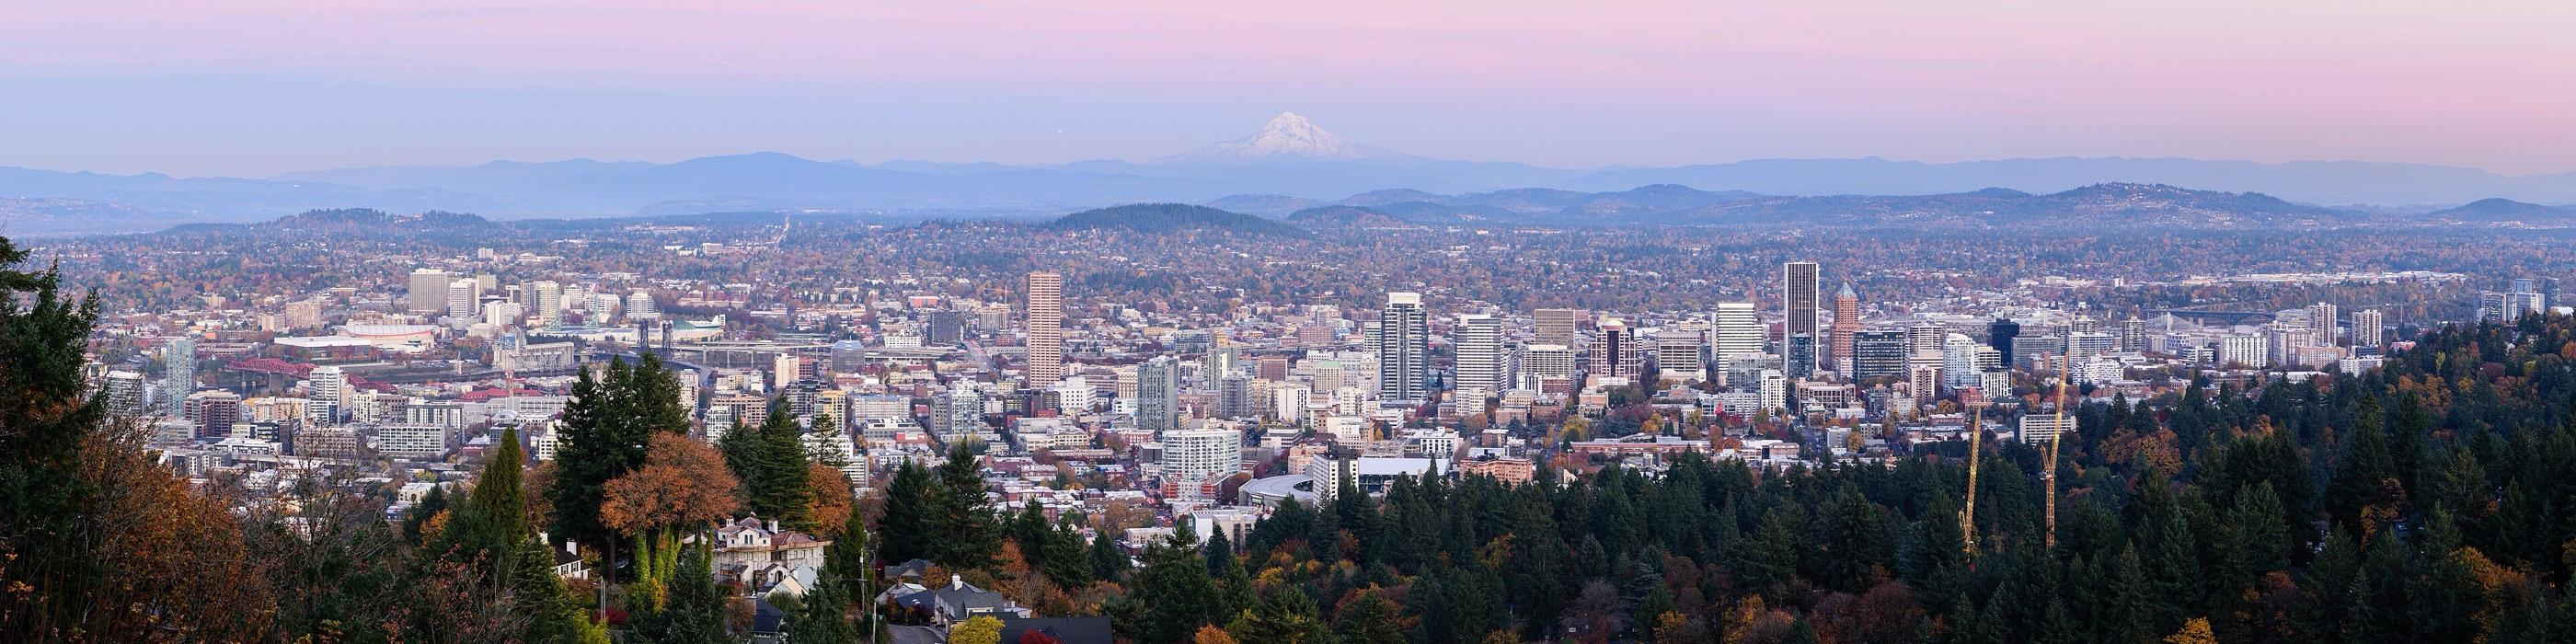
Portland’s economy, 1840 to 2026
Did the wealth made in Portland stay in Portland?
The incomes stayed, and so did most of the family fortunes we could trace. Control left: the banks, the headquarters and the decisions that went with them now sit elsewhere. The one number that would settle the question is reported by no one.
Income per resident in the Portland metro area, as a share of the national figure, 1969 to 2024
Portland starts at 106.3% and ends at 106.4%. The shaded years are the three stretches in which it lost ground to comparable cities. Hover or tap the line for a year.
The short answer
A region that kept its place and lost its say
The accounts do not show a long decline. They show a region that held its position against the nation, did not gain on comparable cities, and lost ground to them in 1980–87, from the late 1990s to 2003, and again since 2022.
Against the nation, Portland ends where it started. Against comparable cities, it has been below the middle in 47 of 56 years.
Each line is Portland’s income per resident as a percentage of a benchmark. A point above 100 means Portland was ahead of that benchmark in that year.
The income stayed
Residents received 87.7% of what the metro area produced in 2024 as personal income, the highest share among ten comparable metros. Net pay crossing the metro line is 0.6% of earnings.
Most family fortunes stayed too
Of 41 fortunes traced from 1850 to 2026, 28 stayed in the region (seven of those with low confidence), one left, five were mixed and seven could not be traced.
Control left
Banks seated in the metro held 38.9% of its deposits in 1994 and 3.5% in 2025. Fortune 500 headquarters went from seven to one between 1996 and 2002. Firms controlled from here had 21% of the jobs at the largest private employers in 2025.
Portland held its place and did not gain on its peers
Income per resident was 106.3% of the national figure in 1969 and 106.4% in 2024. Against the middle of comparable cities it was 93.8% in 1969 and 94.0% in 2024, and it ranked seventh of ten in 2024.
The number that would settle it is missing
Profit earned on work done here and paid to owners elsewhere is reported by no public account. Plants and stores owned from other places are the largest hole in this ledger.
The history, 1840 to 2026
Seven periods, and the number that carries each one
For most of its history the people who owned Portland’s largest firms lived here. The record below follows what they built, what the public asked of them, and when the ownership moved.
1840–1900
1887The year a railroad crossed the Cascades and ended Portland’s hold as the head of ocean navigation.
Merchants collected from the interior and kept the money here
Portland’s merchants sat where ocean ships met the river trade of the interior, and most of what they earned stayed in the city. The public lost its levee along the way and asked nothing of the companies it gave franchises to. The panic of 1893 hit Portland about as hard as it hit comparable cities.
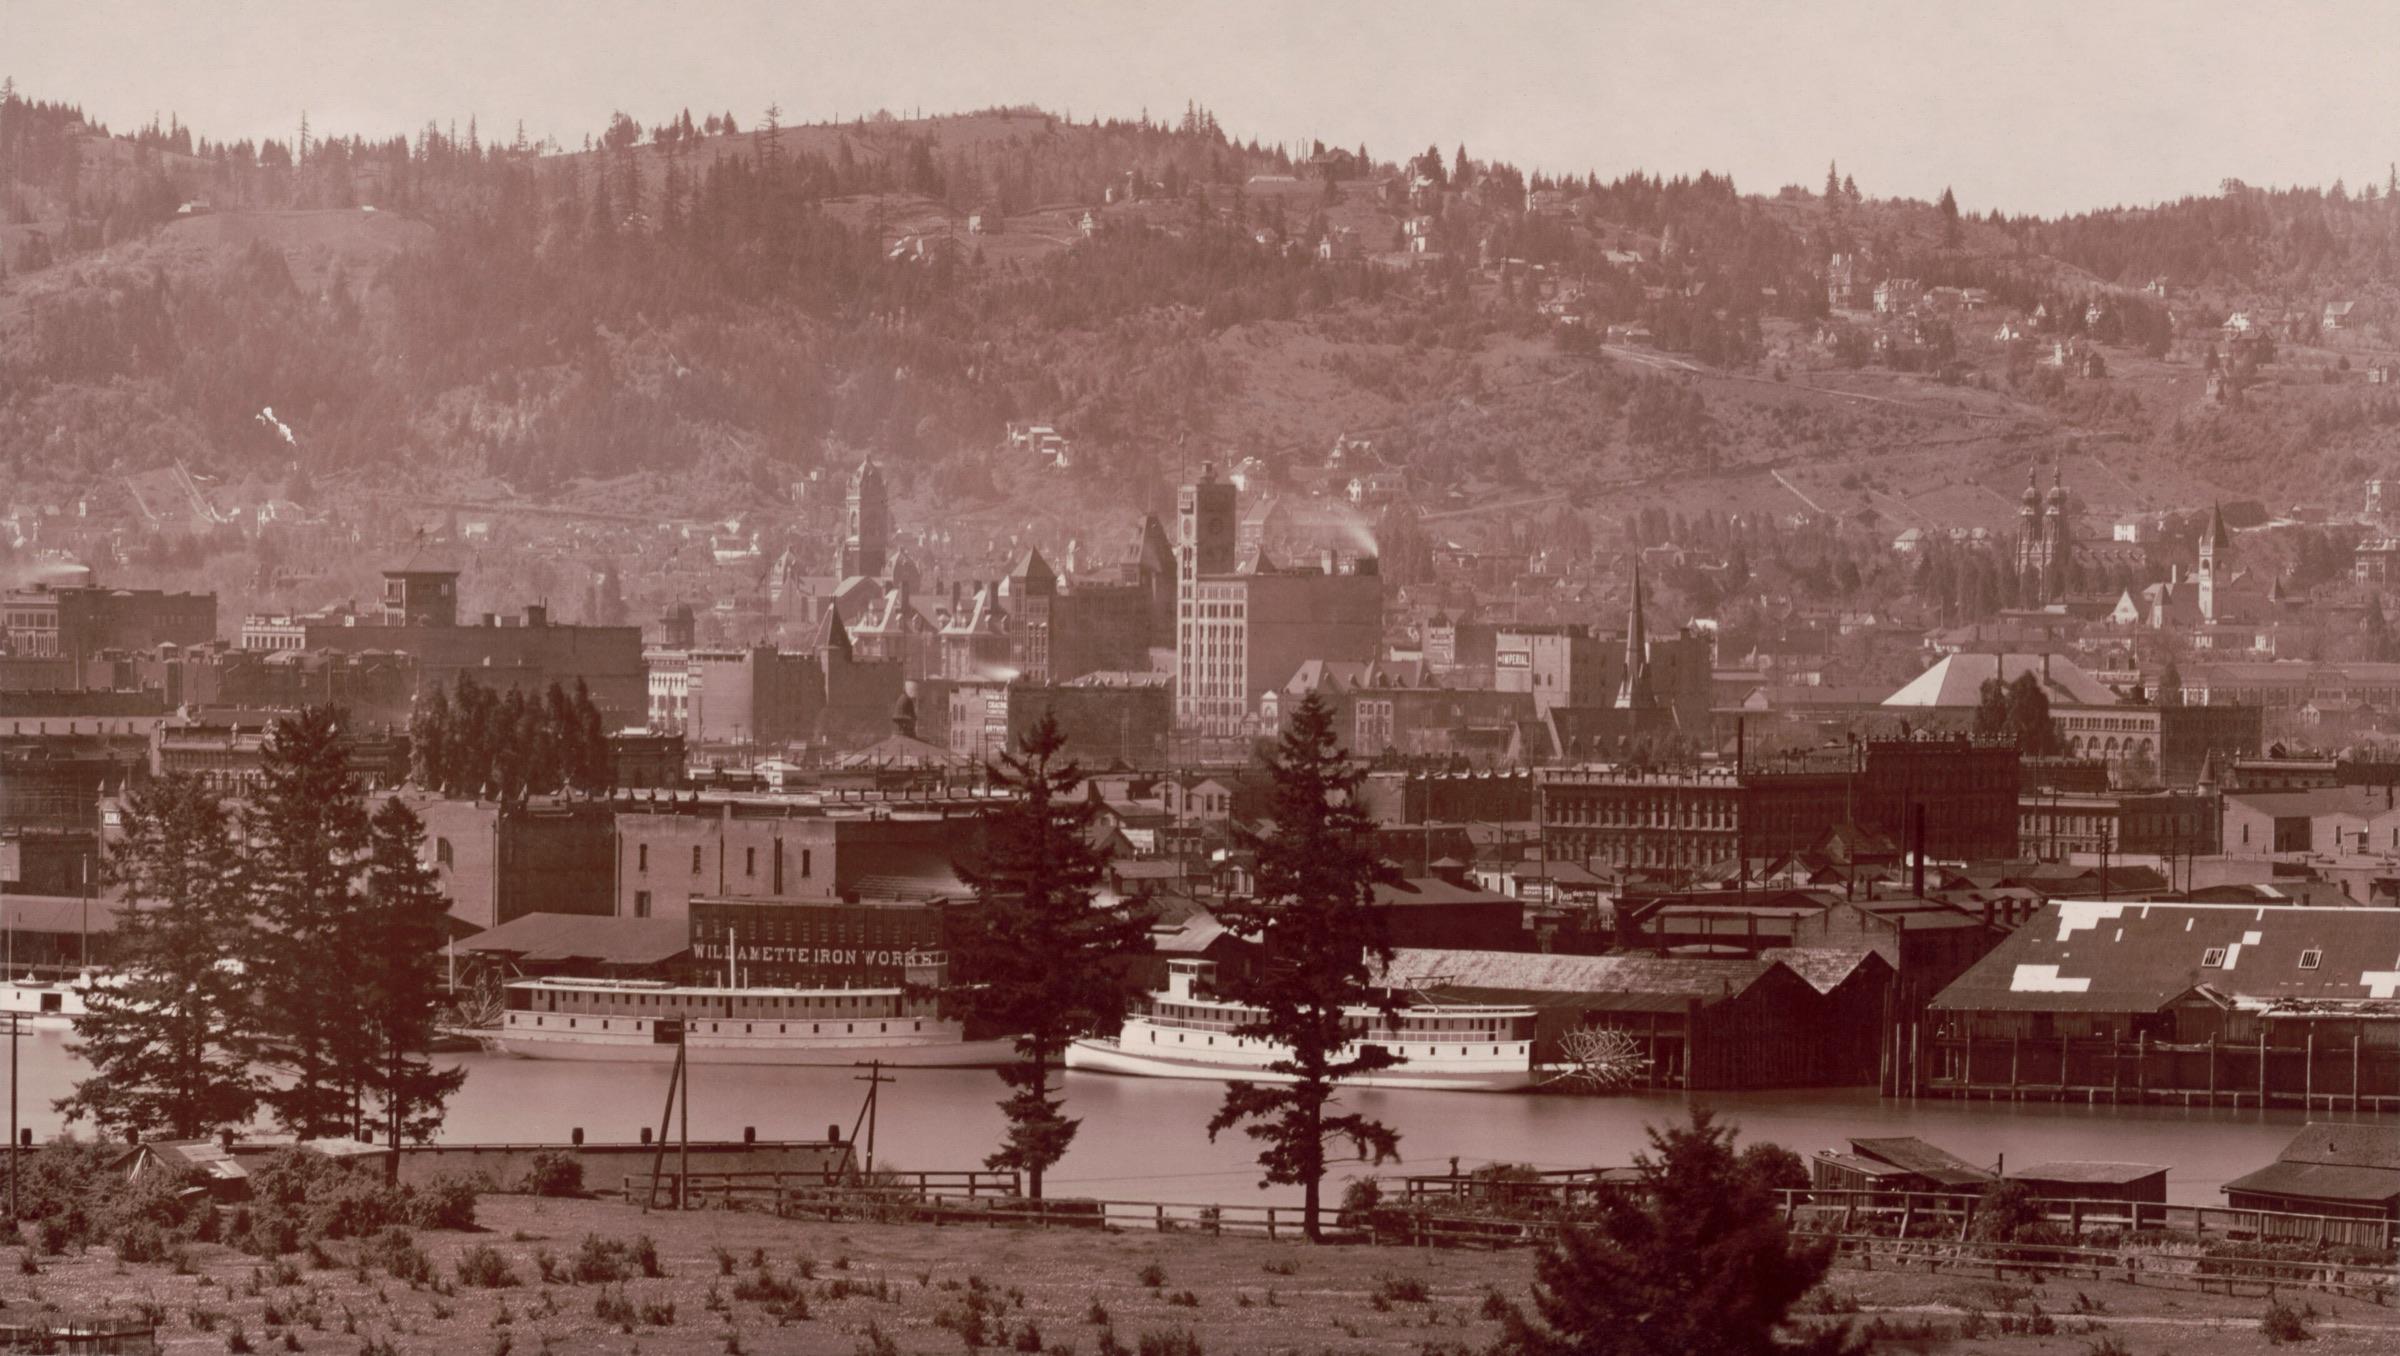
Portland from the east bank in 1898, with sternwheelers at the Willamette Iron Works dock. Photo: Herbert A. Hale, Library of Congress (restoration by Adam Cuerden), 1898. Public domain. 1900–1945
$963.6 millionWartime ship contracts awarded to a single Portland yard.
Control of utilities and banks left, and two windfalls came and went
Control of the utilities and the banks passed to New York and San Francisco. In June 1905, eleven franchise companies together paid the city less than $7,000 a year. The 1905 Lewis and Clark Exposition and the wartime shipyards were windfalls that left no lasting industry. Voters turned down a housing authority, and in 1940 they chose private power. The panics of 1907, 1920 and 1929 were ordinary here. The slow 1920s did more damage.
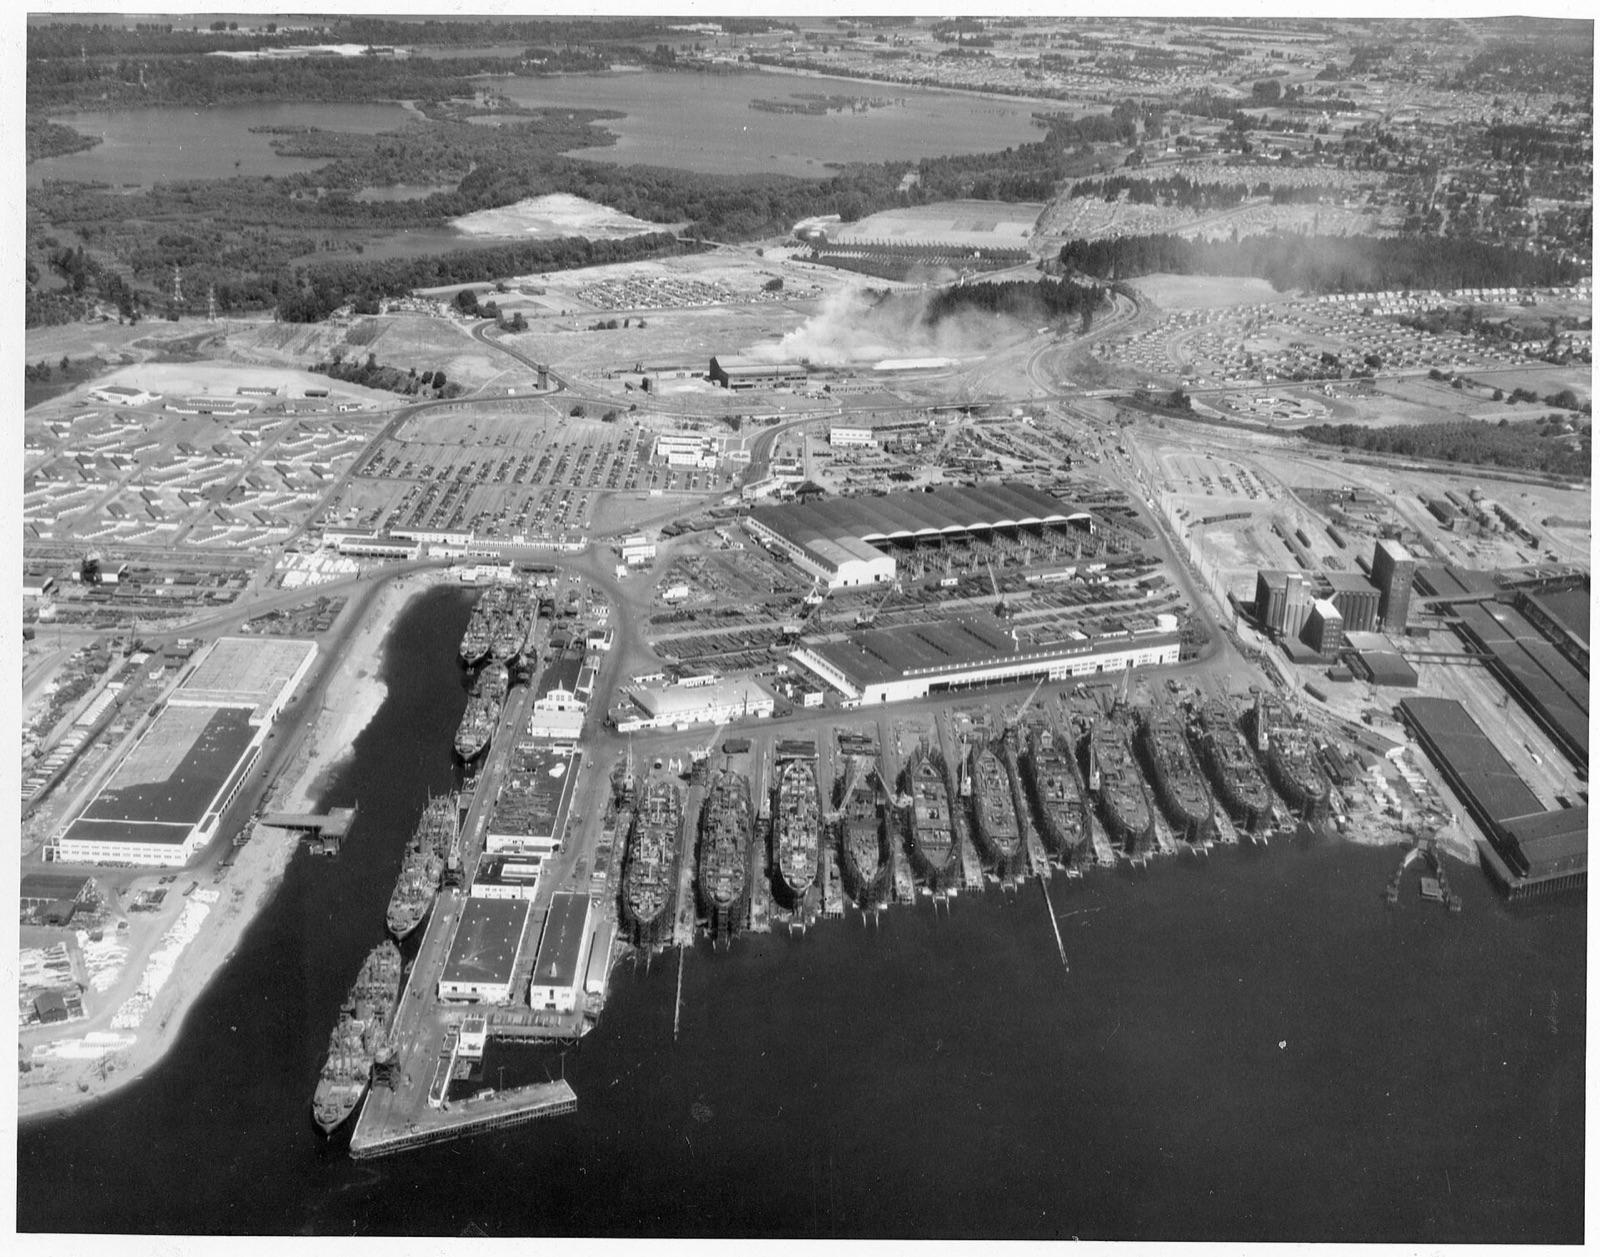
The Oregon Shipbuilding yard on July 4, 1945. The Commission of Public Docks leased its Terminal 4 land to the company on January 17, 1941, eleven days after Henry Kaiser’s group and partners formed it. Photo: U.S. Navy Department, Bureau of Ships, 1945. Public domain. 1945–1970
14 pointsThe fall in Portland’s income relative to the nation, nearly all of it in years without a national shock.
The quiet slide
Voters rejected four levies between 1945 and 1948, and a flood destroyed Vanport on May 30, 1948. The company that grew in these years was Tektronix, founded here by residents with their own money. Most of the large employers were still owned locally while the region slipped.
1970–1989
111.6% → 100%Income per resident against the national figure, 1978 and 1987.
Portland chose its shape, then met a recession it did not answer
The downtown plan, the removal of Harbor Drive, the withdrawal from the Mount Hood Freeway in February 1974 and the state land-use law were each contested, and each held. Intel arrived in 1976 without a public incentive on record. Georgia-Pacific moved its headquarters away in 1982, and Oregon opened its banks to outside buyers in 1986.

Downtown from the West Hills at 8 p.m. in November 1973, during the energy crisis. The 43-story First National Bank tower has lights on a few floors. Photo: David Falconer, EPA Project DOCUMERICA, U.S. National Archives (412-DA-12973), 1973. No known copyright restrictions. 1990–2005
54% → 22%Share of jobs at eight large employers controlled from Portland, at the start of 1997 and in 2000.
The best ten years, and the seven in which the headquarters were sold
Two sales, of U.S. Bancorp and Fred Meyer, moved that share in three years. Deposits in banks seated here fell from 38.9% to 12.2% in six. Fortune 500 headquarters went from seven to one between 1996 and 2002. Intel’s tax program began after 17 years of building here without one. In 1994 Jeff Bezos, by a biographer’s account, narrowed his list to Portland, Boulder, Lake Tahoe and Seattle, and chose Seattle.
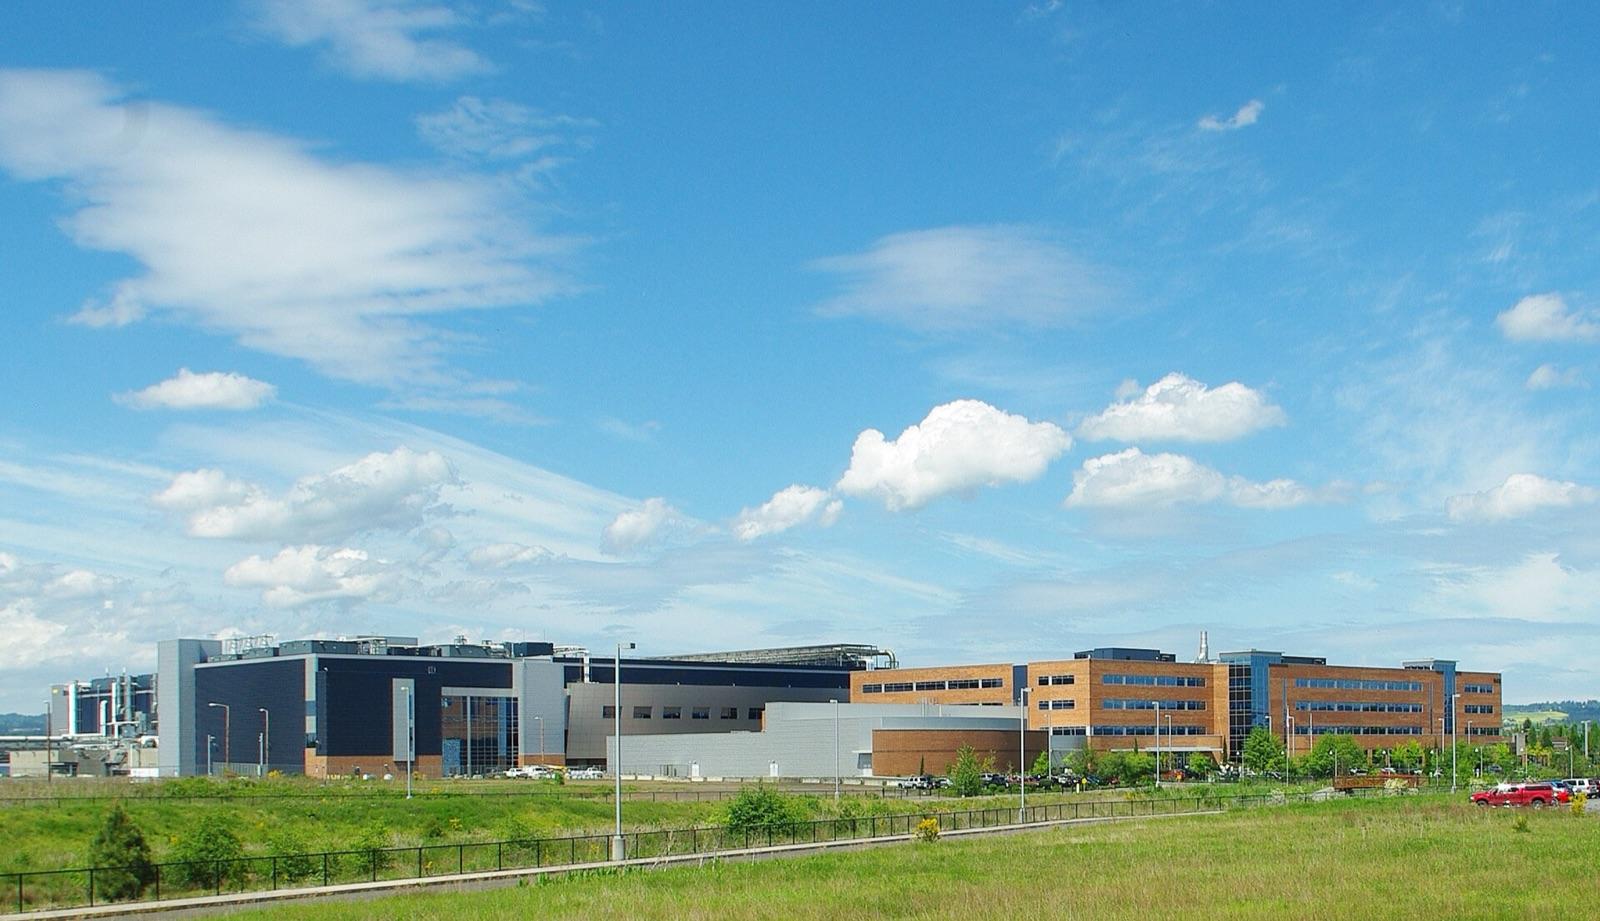
Intel’s Ronler Acres campus in Hillsboro in 2009. Photo: M.O. Stevens, 2009. CC BY 3.0. 2005–2019
25.6%Job growth from 2010 to 2019, inside the range of comparable metros.
A shared bust, and an expansion in the middle of the group
Jobs, pay and income moved with the middle of the comparison group, and pay per job ranked sixth of ten. The last company besides Nike with more than $5 billion in revenue was sold. Berkshire Hathaway bought Precision Castparts in 2016 for about $32 billion.
2019–2026
1,207,926 → 1,208,981Metro jobs in 2019 and 2025, the weakest result of seven comparable metros.
The downturn that is Portland’s own
From September 2023 to September 2026 the metro area lost jobs for three straight years without a national recession. Households moving out of Multnomah County took $3.5 billion more income with them over four years than households moving in brought, and 92% of the last three years’ loss went to other Oregon counties and to Clark County. Computer and electronics jobs fell 14.4% from 2022 to 2025.
Who decides
A census of control at nine dates
We counted how much of the region’s banking and how many of its largest employers were controlled from the Portland area in nine years between 1890 and 2025.
Local firms were more than half of the large employers as late as 1970. Banks seated here held more than half of deposits as late as 1985.
Each point is one census year. A higher point means more of that part of the economy was controlled from the Portland area.
How the census was counted, and the full table
Employer shares before 2000 are simple counts of firms. From 2000 they are weighted by jobs, and the 2010 figure uses a 2014 list. The 1890 employer figure has low confidence.
The bank series changes geography over time. The 1910 deposit figure is 67%, or 89% if Ladd & Tilton is counted as local. The 1970 figure is statewide bank assets in December 1976.
| Year | Largest private employers | Five largest public and nonprofit employers | Bank deposits | Utilities, private | Utilities, with public ones |
|---|---|---|---|---|---|
| 1890 | 77% | 100% | 88% | 43% | 57% |
| 1910 | 53% | 80% | 67% | 0% | 18% |
| 1929 | 37% | 60% | 98% | 0% | 33% |
| 1950 | 70% | no figure | 52% | 11% | 33% |
| 1970 | 55% | no figure | 45% | 33% | 67% |
| 1985 | 48% | no figure | 57% | 33% | 67% |
| 2000 | 22% | 53% | 12% | 11% | 44% |
| 2010 | 29% | 17% | 15% | 22% | 56% |
| 2025 | 21% | 24% | 3.5% | 22% | 56% |
Seattle and Denver also lost home-seated deposits. Portland fell to 3.5%.
Each column is the share of a metro area’s bank deposits held by banks with headquarters in that metro.
Portland
Seattle
Denver
Minneapolis–St. Paul
What a mailing address can and cannot show
The property figure leaves out houses and is measured by the mailing address on the tax roll. A mailing address is where the tax bill goes, so an out-of-state fund that uses a Portland property manager counts as local. Of the value, 14.3% mails to Oregon addresses shared by five or more different owner names.
Among apartment buildings with five or more units, 49.2% of value mails outside Oregon. Counting Umpqua at Lake Oswego as local raises the 2023 small-business loan share to 11.7%. We built these figures for Portland only, so they do not show whether 43.5% is high.
The sales, 1997 to 2025
Twenty-three companies, $110.2 billion, and where the buyers were
From 1997 to 2025 there were 23 sales of metro companies worth about $500 million or more. Berkshire Hathaway’s purchase of Precision Castparts in 2016, at about $32 billion, is 29.3% of the total.
Each line runs from Portland to the home of a buyer. A larger circle means more was paid from that place.
Switch between the United States and the world, and tap a circle for the companies bought from there.
The sales, in order
Each row gives the year, the company, the buyer, the buyer’s home and the equity value of the sale.
What is made, and who receives it
Portland produces less per resident than its peers and pays more of it to residents
Output per resident was $88,789 in 2024, eighth of ten comparable metros. Residents received 87.7% of that output as personal income, the highest share of the ten.
After people are paid for their work, $32,874 of output per resident is left in Portland. In Seattle the figure is $66,036.
Each bar is one metro area’s output per resident in 2024, split into what is paid for work and everything else.
Public companies based here paid shareholders $93.77 billion in 21 years, and Nike paid 77.7% of it.
Each column is one fiscal year of dividends and share buybacks by the metro’s public companies.
Multnomah County pays out a fifth of its payroll to people who live elsewhere. Clark County residents bring home a third more than is paid inside the county.
Each line is the net flow of pay across a boundary as a percentage of the pay earned inside it. Below zero, more pay leaves with commuters than comes in.
Portland-area residents paid about $1,249 more each in federal taxes in 2022 than federal spending returned.
The dot is our middle estimate of federal spending received less federal taxes paid, per resident. The bar is the range between our low and high estimates.
Intel
What the tax agreements cost, and what came back
Intel came to Washington County in 1976 without a public incentive on record and built here for 17 years before the tax program began. The cost of the agreements since then is public. What Intel would have built without them is not known.
From 2013-14 to 2024-25, $2,646.1 million in property tax was abated and $599.8 million came back.
Each column is one fiscal year. The full height is the tax abated, and the lower segment is what Intel paid back in fees and payments.
Downturns
Four national downturns, measured the same way
Portland lost 1.8% of its jobs in 1990–91 and took 20 months to recover. It lost 5.6% between January 2001 and June 2003 and took 55 months. The pandemic took 14.3% of metro jobs between January and April 2020.
How far jobs fell in each downturn, and how long they took to come back
Each dot is one metro area. A dot further left lost a larger share of its jobs from peak to trough.
1990–91 recession
Portland took 20 months to regain the jobs. The middle comparison metro took 17.
2001–03 technology bust
Portland took 55 months to regain the jobs. The middle comparison metro took 51.
2008–10 housing bust
Portland took 66 months to regain the jobs. The middle comparison metro took 61.
2020 pandemic
Portland took 36 months to regain the jobs. The middle comparison metro took 22.
Since 2019
The weakest job record of seven comparable metros
The metro area had 1,207,926 jobs in 2019 and 1,208,981 in 2025. Multnomah County lost 4.9% of its jobs over those years while Clark County, across the river, added 11.2%.
Portland’s metro area grew 0.1% in six years, and its central county shrank more than any other in the group.
The left panel is each metro area’s change in jobs from 2019 to 2025. The right panel is the central county of the same metro.
Whole metro area
Central county
Six explanations
Each story Portland tells about itself, tested against the record
For each explanation we wrote down what the data would show if it were true and what would refute it, before any numbers were pulled.
Extraction
Shown for control onlyResidents received 87.7% of what the metro produced in 2024, the highest share of ten metros, and 28 of 41 traced fortunes stayed. Control did leave: banks seated here hold 3.5% of deposits, and firms controlled from here have 21% of the jobs at the largest private employers.
A few lucky gets
SupportedNike paid 77.7% of all dividends and buybacks by the metro’s public companies. Intel and Nike added 13,062 of the 37,376 jobs we could attribute to named employers from 2010 to 2019. Computers and electronics were 30% to 46% of exports from 2005 to 2024.
A massive subsidy for Intel
MixedFrom 2013-14 to 2024-25, $2,646.1 million in property tax was abated and $599.8 million came back in fees and payments. Nothing in the record establishes what Intel would have built without the agreements. The 2014 agreement names no job count, and Intel has since filed layoff notices covering 4,478 Oregon workers.
Courage and the goals of residents
Real, and aimed at landOf the farm and forest land of 1974, 97% was still in those uses in 2014, and the planning law survived three repeal votes. Of 39 public goals set since 1970, 13 name jobs, income, investment or prosperity, three set a jobs number and none sets an income target.
Outside shocks Portland never reacted to
True of two episodesIt holds for 1980–87 and 2001–03, where the responses we found were $30 million in mortgage bonds in 1980, a state plan of about $2 million in 1982 and a strategy paper in 2002. It fails as a general account, because Portland also lost ground in calm years: the 1920s, the 1950s and 1960s, 1998–99 and 2022–2026.
Nothing unusual happened here
Rejected for the long gapPortland sat below the middle of comparable cities in 47 of 56 years and came last of seven in job growth from 2019 to 2025. The claim does hold for one stretch: job growth of 25.6% from 2010 to 2019 sat inside the range of comparable metros.
None of these stories survives whole. Residents receive more of what is made here than residents of any comparable metro, and the families who made fortunes mostly kept them here. Nike was founded by a resident. Intel came in the 1970s before any tax abatement and expanded later under agreements whose cost was public.
The courage of the 1970s was real. It was aimed at land, air and the shape of the city, and it achieved what it aimed at. No generation of leaders since has set an income goal. Portland fell with its peers in most national downturns, fell behind them in the 1980s and in 2001–03, and also lost ground in calm years: the 1920s, the 1950s and 1960s, the late 1990s and the years since 2022.
The present
Six problems with a history, and six openings the record supports
Each problem below is paired with the decisions that produced it. Each opening is something the evidence shows exists today.
The problems, and where each came from
Dependence on two employers
- Today
- Layoff notices from Intel and Nike equal at most 40% of the metro’s net job loss since September 2022. Nike alone paid 77.7% of shareholder payouts.
- Where it came from
- Five of the other six Fortune 500 headquarters were sold between 1996 and 2002. Tax agreements with Intel began in the 1990s, and the 2014 agreement names no job count.
Few firms in the middle
- Today
- Of the mid-size firms with headquarters here, 22% are still independent, against 39% in Seattle.
- Where it came from
- Portland firms were sold at about the ages their peers’ were, and few grew past $5 billion at home: 4 of 36, against 11 of 36 in Seattle and 18 of 61 in Minneapolis–St. Paul.
Decisions made elsewhere
- Today
- Banks seated here hold 3.5% of deposits and made 0.6% of small-business loan dollars in Multnomah County in 2023. Firms controlled from here have 21% of the jobs at the largest private employers.
- Where it came from
- The two largest banks passed to outside owners in 1930 and 1997, and the headquarters sales ran from 1997 to 2016.
A strained central county
- Today
- Multnomah County jobs are down 4.9% since 2019, housing permits in 2023–25 ran at 40% of the 2019 level, and local taxes per resident rose from $2,264 in fiscal 2016 to $4,219.
- Where it came from
- Property tax limits passed in 1990 and 1997, new taxes on income and business followed from 2016 to 2020, and downtown took the shock of 2020–2022.
Goals without an income target
- Today
- Of 39 public goals set since 1970, none sets an income target, and for 26 of them we found no public vote.
- Where it came from
- The goals of the 1970s were about land, air and the shape of the city. Later plans kept that pattern.
No practice of answering a downturn
- Today
- The responses to the current losses began in 2023, three years in.
- Where it came from
- We found little public response on record for 1980–82, 1990–92, 1998–99 or 2001–03.
The openings
The money that stayed
Foundations that trace to Portland fortunes hold $11.13 billion, the Oregon Community Foundation holds $3.32 billion, and more than $120 billion is invested under decisions made in Oregon. About 2% of the state pension fund’s private equity is in Oregon companies. How any of these pools should be invested is a judgment for their boards and for the residents they answer to.
A region that kept its people
Of the net income that left Multnomah County with movers in tax years 2020–21 to 2022–23, 92% went to Clark County or to other Oregon counties. Metro income per person rose from 105.4% of the national figure in 2019 to 106.4% in 2024. The governments around it are drawn along county and state lines that the movers crossed.
What the 1970s built
The farm and forest land is still there, part of the cancelled freeway’s money built the first light rail line, and the riverfront highway became a park. In 2024, 87% of residents rated the parks good or excellent. Typical asking rents were above the national figure in 2020 and below it by 2025.
Prices that have reset
Two downtown towers sold in 2025 at 12% and 32% of their 2015–16 prices, and office vacancy is near 30%. Business applications in Multnomah County are up 65.9% and match King County’s rate per resident. The median multifamily permit takes 247 days.
Authority that is still local
Between 47% and 54% of local taxes in Multnomah County are set by local governing bodies or voters, who can revisit them. The homeless services tax expires in 2030 unless voters extend it, and the preschool tax’s next rate increase is scheduled for January 1, 2028. The 1997 sale of U.S. Bancorp, by contrast, was decided by a board of twelve directors, eleven of them present.
Health care and the public sector held
Private education and health care added 27,732 jobs between 2019 and 2025 and government added 9,273, while seven of ten sectors shrank. The region’s two largest employers by headcount are now a public university hospital and a hospital system. In our reading this sector is less exposed to a chip cycle than most and more exposed to federal and state budgets.
In our reading
Portland has been good at deciding what kind of place to be, and has left the question of what its economy should be to whoever owned the largest firms at the time.
For most of its history those owners lived here, and the two questions had the same answer. After 1997 most of them did not.
The evidence against this reading
- The slide of 1945 to 1970 happened while local owners still held most of the large employers.
- Denver kept about as few independent mid-size firms as Portland did, 23% against 22%, and grew anyway.
- The expansion of 2005 to 2019 came after control had left.
Five things to watch
- Monthly job counts against Seattle, Denver and Minneapolis–St. Paul.
- Semiconductor employment in Washington County, which stood at 20,689 in February 2026.
- The income of households moving in and out of Multnomah County. The net loss in 2022–23 was $800 million, down from $1,218 million.
- The market value of commercial and industrial property in Multnomah County, which was $43.7 billion in 2025 and 9.4% below its 2020 peak.
- The decision on the homeless services tax, which expires in 2030 unless voters extend it.
Methods and limits
What this account cannot show, and what would change it
The number that would settle the question of extraction is the profit earned on work done here and paid to owners elsewhere. The accounts do not report it.
How the comparisons were made
“Metro” means the seven-county Portland–Vancouver–Hillsboro area unless a line says otherwise. Portland is compared with cities that resembled it at the time, chosen by size, economic role and stage of growth, and the sets were written down before any comparison ran.
From 1970 to 1989 the set is Seattle, Phoenix, Rochester, San Diego, Dallas and Minneapolis–St. Paul. From 1990 to 2009 it is Seattle, Denver, Columbus, San Diego, Phoenix, Minneapolis–St. Paul and Salt Lake City. From 2010 it adds Austin and Raleigh. Job comparisons for 2019 to 2026 use seven metros for which the same monthly series could be built.
After 1969 the figures come from federal accounts. Before 1969 no regional total exists, so the early periods rest on case records of single companies and on the census of control.
What cannot be shown
- Profits at plants and stores owned from elsewhere, which is the largest hole in the ledger. Precision Castparts under Berkshire Hathaway, Daimler’s truck business and Fred Meyer under Kroger are examples.
- The true owners behind agents, trusts and limited liability companies on the property roll.
- Capital gains and the earnings companies kept.
- Where three quarters of the proceeds of the company sales went.
- Output by county before 2001.
- Whether Portland’s shareholder payouts, outside property ownership and family fortunes differ from other cities’, because those figures were built for Portland only.
- What Intel would have built without the agreements.
What would change these conclusions
- The finding that income stayed and control left would weaken if profits of outside-owned plants proved large beside local wages, or if true ownership showed far more than 43.5% of property held elsewhere.
- The finding that the losses since 2022 are Portland’s own would weaken if revised job counts closed the gap, or if Intel’s and Nike’s cuts explained most of it. Their notices equal at most 40% of the metro’s net job loss since September 2022.
- The finding that local ownership was no better for growth rests on 1945–1970, 2005–2019 and bank lending records from 1929 to 1976.
- The account of the 1997–2002 sales rests on merger filings written by the companies and their lawyers.
Sources
- U.S. Bureau of Economic Analysis: personal income, output and the residence adjustment by county and metro area.
- U.S. Bureau of Labor Statistics: monthly metro employment and the Quarterly Census of Employment and Wages.
- Federal Deposit Insurance Corporation: Summary of Deposits.
- U.S. Securities and Exchange Commission: annual reports, proxy statements and merger filings.
- County assessor tax rolls for Multnomah, Washington and Clackamas counties.
- Internal Revenue Service: county-to-county migration data and county income data.
- Washington County: Strategic Investment Program reports.