
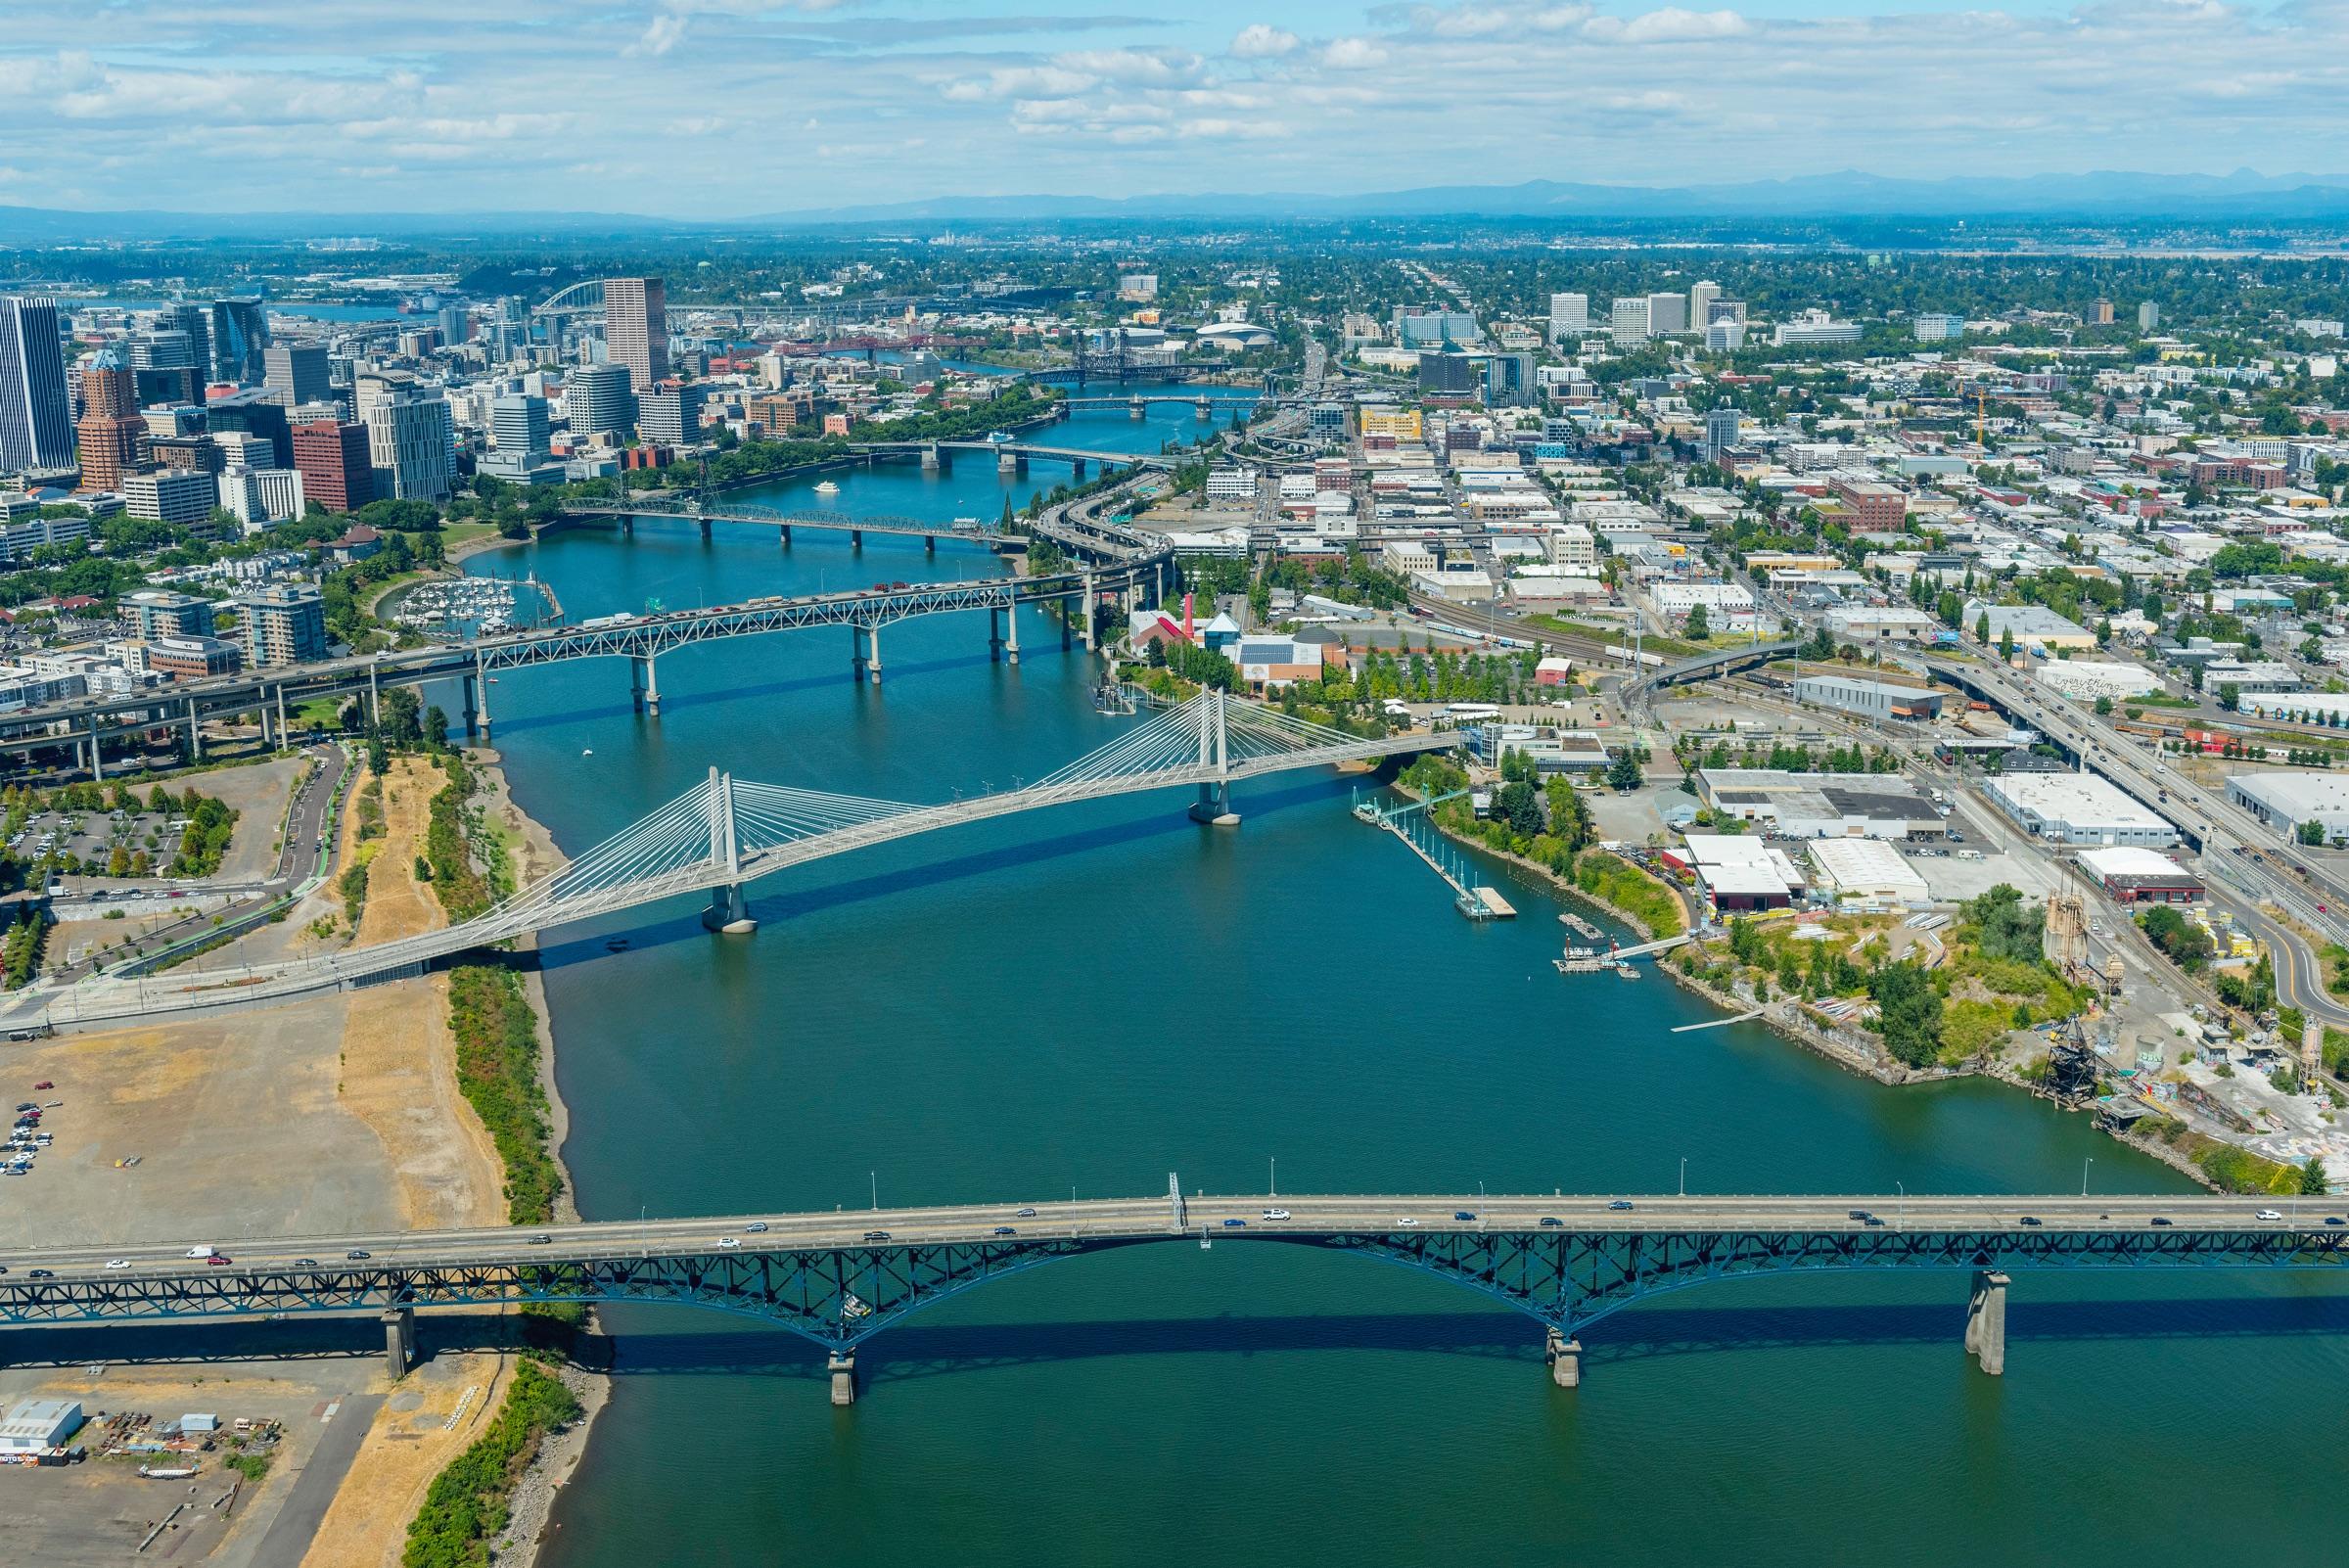
Portland’s job loss since 2019, traced to the block
Why did Portland fall behind?
Since 2019 Portland has lost about 20,500 jobs, and 80% of them were within 0.75 miles of the center of downtown.P1 P2 Other downtowns went through the same shift to remote work and lost far less.A8 This page shows where the jobs were, which buildings they were in, and how much of the loss each cause can account for. Every statement links to its source.
The jobs were lost in the center of downtown
Each ring shows the share of its jobs that part of the city lost from 2019 to 2024. Within 0.5 miles of the center, 17.0% of jobs are gone. More than 2 miles out, 0.7%.P2
Source: Census Bureau, job counts by census block (LODES), 2019 and 2024.Get the data (CSV)
Jobs in Portland and in the places around it, with 2019 set to 100
All four grew through 2019, the suburbs a little faster after 2013.S1 In 2020 Portland fell further than its neighbors, and it has not come back: in 2024 the city had 4.3% fewer jobs than in 2019, while Washington and Clackamas counties had 4.7% more and Clark County 12.3% more.P1 P4 Hover or tap for a year.
Compared here: The City of Portland against the rest of Multnomah County, Washington and Clackamas counties together, and Clark County, Washington. All jobs, counted where the job is located.
- City of Portland
- Multnomah County outside Portland
- Washington and Clackamas counties
- Clark County, Washington
Source: Census Bureau, job counts by census block (LODES), 2010 to 2024, summed inside 2020 boundaries.Get the data (CSV)
The answer
The evidence points most to remote work, then to street conditions, and least to taxes
People in Portland argue about what went wrong: remote work, street conditions after 2020, or taxes. We measured how much of the downtown job loss each can account for, using public records and other cities, and a second review rebuilt the numbers and tried to break each estimate. The answer matters because each cause calls for a different response, and the loss has not stopped: by a preliminary count, Multnomah County had 6.1% fewer jobs in March 2026 than in March 2019 and 2.2% fewer than a year earlier.U7
The short version
Most of Portland’s job loss since 2019 is in the center of the city, and most of that loss did not happen in other downtowns.P1 P2 A8
- Where
- 80% of the 20,510 jobs the city lost were within 0.75 miles of the center of downtown. The rest of Multnomah County gained jobs, all of the gain in health care, education and warehousing.P1 P2 L1
- Why
- The evidence points most to remote and hybrid work, which accounts for at least 20% and at most 76% of the jobs downtown lost. Safety, police response and street conditions come second, and the evidence cannot size them. Local taxes come last, at 0% to 18% of the jobs downtown lost. The ranges are wide because the records cannot separate the three.A1 A2 A5
- Which jobs
- Jobs in downtown office towers, and in the restaurants, hotels and shops around them.P12 B2
- Since when
- The center had been slipping against its suburbs for decades. The slide paused from about 2008 to 2014 and resumed about 2015.P6 S1
- Other cities
- Other downtowns lost far less. Downtown Minneapolis lost about 3% of its office jobs and downtown San Diego about 7%, against 16.6% in downtown Portland. Those are the two of nine comparison downtowns whose block counts are steady enough to use. In Seattle, Denver and Minneapolis the number of downtown office businesses fell 5% to 6%, against 13% in Portland. So between 55% and 90% of downtown Portland’s job loss is specific to Portland: comparison downtowns did not have it.A1 A8 The rest of Oregon kept pace with Colorado and Minnesota outside their largest cities.P11
Remote work can account for 20% to 76% of downtown’s job loss, street conditions for 0% to 67% and local taxes for 0% to 18%
Each bar runs from the least to the most of the 16,439 lost jobs that a cause can account for. The bars overlap, because fewer office workers and worse street conditions both cost restaurant jobs, so they cannot be added together. A bar that starts at 0% means no measurement shows any effect, and none rules one out.A1 A2 A5 A6
Compared here: Downtown Portland only: jobs within 0.75 miles of the center, April 2019 to April 2024. Each range was tested against comparison downtowns and counties.
- 1Remote and hybrid work20% to 76%of the downtown loss
The evidence points most to remote and hybrid work and the fall in visits that came with it. It accounts for at least 20% and at most 76% of the 16,439 jobs downtown lost from 2019 to 2024. Office jobs are 50% of the loss, and 62% of the lost office jobs were lost after April 2021. Other downtowns went through the same shift and lost far less. What Portland shares with them is 10% to 45% of its loss, so remote work by itself does not explain why Portland’s downtown did worse.A1
What decides it, and the strongest evidence against
- Office jobs are 8,264 of the 16,439 jobs lost (50%). 3% of that office loss had happened by April 1, 2020, 38% by April 1, 2021, and 62% came after, spread across 2021 to 2024.
- Comparison downtowns share between 10% and 45% of Portland’s loss (28% to 60% of the loss in restaurants, hotels and shops, and 0% to 45% of the office loss), measured with block counts for Minneapolis and San Diego, counts of downtown businesses for Seattle, Denver and Minneapolis, and county payroll counts for Hennepin and Ramsey.
Against. Downtowns that lived through the same shift lost far fewer office jobs: about 3% in Minneapolis, which has a larger office share, and about 7% in San Diego, against 16.6% in Portland. Employers that said publicly they had gone remote account for 1,538 of the lost jobs (9.4%). What Portland shares with Seattle, Denver and Minneapolis also includes their own unrest and street disorder, so the shared part is not a clean measure of remote work.
- 2Safety, police response and street conditions0% to 67%of the downtown loss
Hatched band: not an estimate for this cause. Downtown lost 2,400 to 4,400 more restaurant, hotel and shop jobs than it would have at the rates of comparison downtowns, which is 15% to 27% of the downtown loss, and street conditions are one of several explanations.
Safety, police response and street conditions come second, and the evidence cannot size them. No measurement puts their share above 0%, and none rules out as much as 67%. What is measured is that downtown Portland lost 2,400 to 4,400 more restaurant, hotel and shop jobs than it would have at the rates of comparison downtowns, which is 15% to 27% of the downtown loss. Street conditions are one explanation of that shortfall. A larger office loss and fewer visitors are others, and the records do not separate them.A2
What decides it, and the strongest evidence against
- Downtown Portland lost 27.0% of its restaurant, hotel, shop and personal-service jobs. The downtowns of Seattle, Denver and Minneapolis lost 9% to 16%. At their rates Portland would have kept 2,415 to 4,363 more of those jobs, which is 15% to 27% of the downtown loss. Three sources agree that Portland’s fall is the largest.
- Those jobs fell by 7,442 by April 1, 2020, before the protests began in late May 2020. They fell by another 3,136 by April 2021 and have come back by 4,547 since.
Against. Nothing in the records measures street conditions against jobs. The shortfall in restaurant, hotel and shop jobs is also what a larger office loss and fewer visitors would produce, and the one test that tries to separate them gives answers from 483 to 2,190 jobs depending on which cities are included. No employer among the 19 with a stated reason named crime or street conditions alone. 62% of the office loss came after April 2021.
- 3Local taxes0% to 18%of the downtown loss
Local taxes rank below those. They account for between 0% and 18% of the downtown loss. No test finds a tax effect: away from downtown, office work inside the city grew faster than just outside it, and no employer that gave a reason named taxes. Those tests cover small employers far from the center, and 62% of the lost office jobs left after the county and Metro income taxes took effect in January 2021, so an effect on downtown firms cannot be ruled out. The 18% ceiling assumes the entire gap between Portland and its suburbs in the number of office businesses is a tax effect.A5
What decides it, and the strongest evidence against
- The number of office businesses in Portland ZIP codes fell 1.8% from 2019 to 2023 while it rose 3.0% in Washington and Clackamas counties. If that whole 4.8 point gap were a tax effect and jobs followed businesses one for one, it would be 2,384 downtown office jobs, 15% of the downtown loss; allowing for Portland’s faster growth before 2019 it would be 2,906 jobs, 18%.
- More than 2 miles from the center and within 1 mile of the city line, office jobs rose 24.4% inside Portland (13.8% without the five largest gaining blocks) and 2.7% to 6.0% just outside in Washington and Clackamas counties. That band holds 5,090 office jobs, 4.8% of the city’s. None of the 19 employers that gave a reason for leaving or shrinking named taxes.
Against. For a larger effect: 5,121 downtown office jobs (31% of the downtown loss) left after April 2021, when the county and Metro income taxes were in force; the gap between Portland and its suburbs in the number of office businesses opened entirely between the 2021 and 2023 counts; professional-services businesses in the central ZIP codes fell 10.3%; and the two tests that find nothing cover small employers far from downtown. For a smaller effect: Hennepin and Ramsey counties, which have no local income tax, lost 5.8% of their office jobs from 2021 to 2025 against 8.5% in Multnomah County.
- 4Fewer residents0% to 4%of the downtown loss
Fewer residents account for at most 4% of the downtown loss. That ceiling assumes shop and restaurant jobs fall 1% for each 1% of residents lost, which the records are too imprecise to confirm.A6
What decides it, and the strongest evidence against
- The city lost 3.0% of its residents. If restaurant, hotel and shop jobs fell 1% for each 1% of residents lost, that would be 671 of the 22,360 such jobs downtown had in 2019, 4% of the downtown loss.
Against. The 1% for 1% response is an assumption. The measured response across 48 large counties is too imprecise to tell from zero.
- How much of this was already under way before 2020?
- The slide against the suburbs that began before 2020 describes a trend already under way, and its cause is unknown. If it had continued it would account for between 0% and 26% of the downtown loss. Downtown was still adding jobs through 2019, only more slowly than the rest of the region.A3
- How much is banks and insurers shrinking everywhere?
- Of the office jobs downtown lost, 3,301 were in banking and insurance, 20% of the whole downtown loss. Banks and insurers shrank in comparison cities too: at their rates downtown Portland would have lost 880 to 2,380 of these jobs anyway, which is 5% to 14% of the downtown loss. These jobs are already counted in the office loss above.A4
- Could some of the lost jobs still exist?
- Between 1% and 24% of the recorded downtown loss may be staff who are still employed and are now reported at another address. This concerns how jobs are counted, and most of it would sit inside the remote-work range above.A7
- Proven
Measured directly from public records, reproduced in a second review, and it holds whichever cities Portland is compared with. - Strongly supported
A measured pattern with a clear mechanism and a comparison that isolates it. No rival explanation fits as well. - Likely
Fits the timing and the comparisons, but cannot be separated from other things that changed at the same time. - Not shown
Widely believed. The records either do not support it or cannot test it. Not shown is different from disproven. - Not known
A question the public record cannot answer yet.
Remote work is the only one of the three explanations with a measured minimumLikely
Remote and hybrid work accounts for 20% to 76% of the jobs downtown lost.A1 Downtown lost 2,400 to 4,400 more restaurant, hotel and shop jobs than it would have at the rates of comparison downtowns, and street conditions are one explanation of that.A2 Local taxes account for 0% to 18% of the jobs downtown lost.A5 The evidence cannot divide the part of the loss that is specific to Portland among the three.K1
The loss is inside the city limits, and mostly downtownProven
The City of Portland had 477,989 jobs in 2019 and 457,479 in 2024, a loss of 20,510. The rest of Multnomah County gained 4,103.P1 Within 0.75 miles of the center of downtown, jobs fell by 16,439. More than 2 miles out, the city lost 0.7%.P2
It is one of the worst records among the central counties of large metro areasProven
Multnomah County lost 4.9% of its jobs from 2019 to 2025. Of the central counties of the 50 largest metro areas, only Cleveland’s and Memphis’s did worse on this measure. Using each metro’s historic core county, Multnomah is 4th worst.P3 The suburbs gained jobs, but the Oregon side of the region is weak too: most of the growth outside Multnomah County was in Clark County, Washington.P4 P5
We know which buildings lost the jobs. For most of them we do not know which employers.Proven
Ten census blocks within 0.75 miles of the center carry 54% of downtown’s net loss.B1 Each of the fifteen largest losing blocks within 1.25 miles can be matched to buildings: a bank tower, two insurers’ buildings, a utility headquarters and the old county courthouse are among them.B2 For about 72% of the jobs lost on the fifteen largest losing blocks, public records do not say which employer lost them or where they went.B6
Downtown lost the most office jobs and the largest share of its service jobsProven
Within 0.75 miles of the center, office-type jobs fell by 8,264 and restaurant, hotel and shop jobs by 6,031.P12 Over the same years, office jobs in the parts of the city more than 2 miles from downtown grew 21.8%, under the same City taxes.P9
Multnomah County’s share of the region’s jobs has been falling for more than 50 yearsProven
Multnomah County held 70.2% of the four-county region’s jobs in 1969 and 41.9% in 2022. Denver’s and Minneapolis–St. Paul’s central counties fell the same way.P6 In almost every downturn since 1981, the county lost jobs while the rest of the region grew or lost less.P7
Portland began losing ground to its suburbs again about 2015Likely
Multnomah County began losing ground to its suburbs again about 2013 to 2015, before the pandemic and before the taxes and housing rules of 2016 to 2019. The cause is not known.S1 K4
More people left, and arrivals did not rise as they did elsewhereStrongly supported
More households left Multnomah County after 2020, at about the same rate as in comparable counties. The people leaving had unusually high incomes, and arrivals from other states did not rise as they did elsewhere.P10 Against the middle of Seattle, Denver and Minneapolis–St. Paul, 58% of the population gap is lower immigration from abroad and 35% is fewer births relative to deaths.S6
Where
80% of the jobs Portland lost were within 0.75 miles of the center of downtown
The Census Bureau publishes job counts for every census block. Adding them up by distance from the center of downtown shows where the 20,510 jobs went missing.
Change in jobs from 2019 to 2024, by distance from the center of downtown
The same rings as the map at the top of this page, counted in jobs. The innermost 0.5 miles lost 13,670 jobs, 17.0% of what it had. Beyond 2 miles, the rest of the city lost 0.7%.P2
Compared here: Five parts of the City of Portland, by distance from the center of downtown (SW 6th Avenue near Pioneer Courthouse Square). All jobs, 2019 against 2024.
Jobs gained or lost, 2019 to 2024
The loss appears to follow the city limit more than the county line. The part of Multnomah County outside Portland gained jobs.P1 That test is weaker than it looks, because all of that gain is in health care, education and warehousing.L1
The 80% is a share of the city’s net loss. Outside downtown the city lost 7,130 restaurant, hotel and shop jobs and 3,277 jobs in other kinds of work, and it gained 2,255 office jobs and 4,232 jobs in health care and education, for a net loss of about 4,070.P2
Among 50 cities
Multnomah County ranks 48th of 50 large central counties for job growth since 2019
Every large city center was hit in 2020. To see whether Portland’s loss is ordinary, this chart ranks the central county of each of the 50 largest metro areas by its change in jobs from 2019 to 2025.
Change in jobs, 2019 to 2025, in the central county of each of the 50 largest metro areas
Portland’s central county is Multnomah County, in orange. The three regions most like Portland are in blue. Multnomah County lost 4.9% and ranks 48th. Denver County gained 6.0%, King County (Seattle) was flat and Hennepin County (Minneapolis) lost 1.9%.P3 The loss has continued. In March 2026, the latest month published, Multnomah County had 484,384 jobs by a preliminary count, 6.1% fewer than in March 2019 and 2.2% fewer than in March 2025. On that March-to-March measure it ranks 47th of the 50 instead of 48th, only because Washington, D.C. fell below it. Cleveland’s and Memphis’s central counties also did worse.U7
Compared here: The county with the most jobs in each of the 50 largest metro areas. Orange is Multnomah County. Blue is King County (Seattle), Denver County and Hennepin County (Minneapolis).
The rest of Oregon kept pace with the rest of Colorado and Minnesota
If state policy were holding Oregon back, the rest of the state should trail too. Oregon outside the Portland area added jobs about as fast as Colorado outside Denver and faster than Minnesota outside the Twin Cities, though more slowly than Washington outside Seattle.P11 If Oregon had added jobs at Washington’s rate it would have about 58,000 more, and Multnomah County alone accounts for 87% of that.S7
Compared here: Four states, each without its largest metro area: Oregon, Washington, Colorado and Minnesota. All jobs, 2019 against 2025.
Change in jobs, 2019 to 2025
The suburbs did not do well either. The Portland metro area is last of ten comparison metros for job growth since 2019, and most of the growth outside Multnomah County was across the river in Clark County, Washington.P5 Columbus’s and Austin’s central counties lost nearly as much of their regions’ share of jobs as Multnomah County did, but those regions grew, so their centers still added jobs. The direction may also run the other way: Portland’s region grew slowly partly because its center shrank.S5
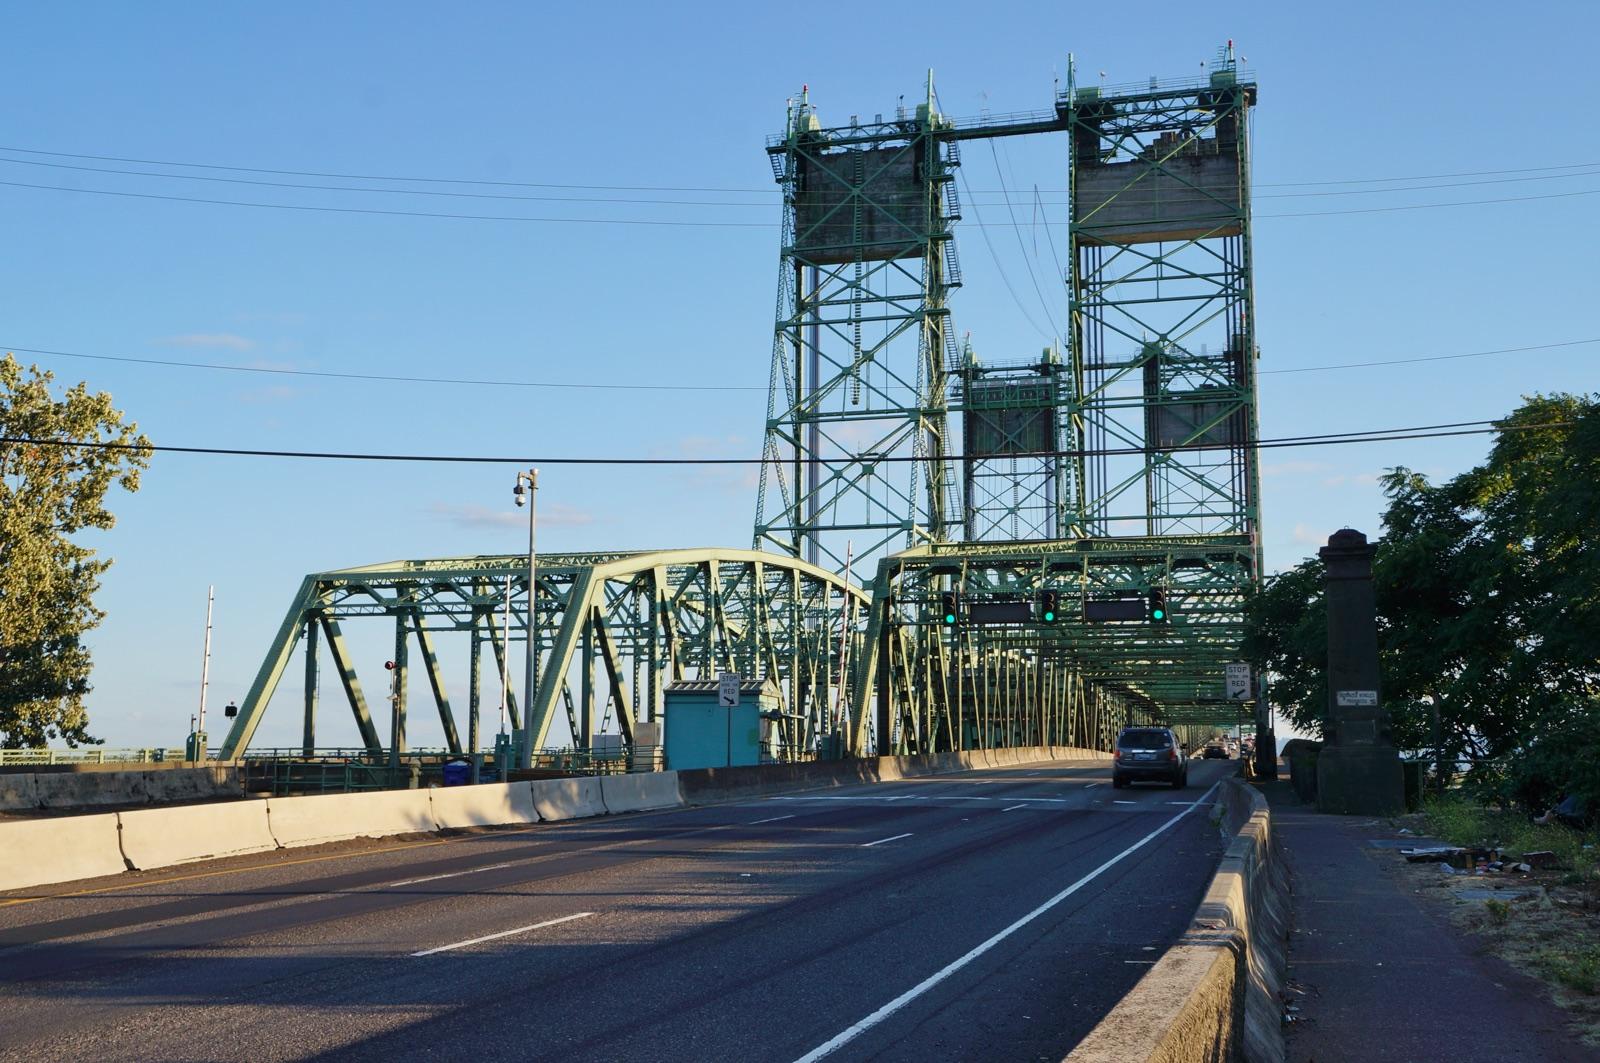
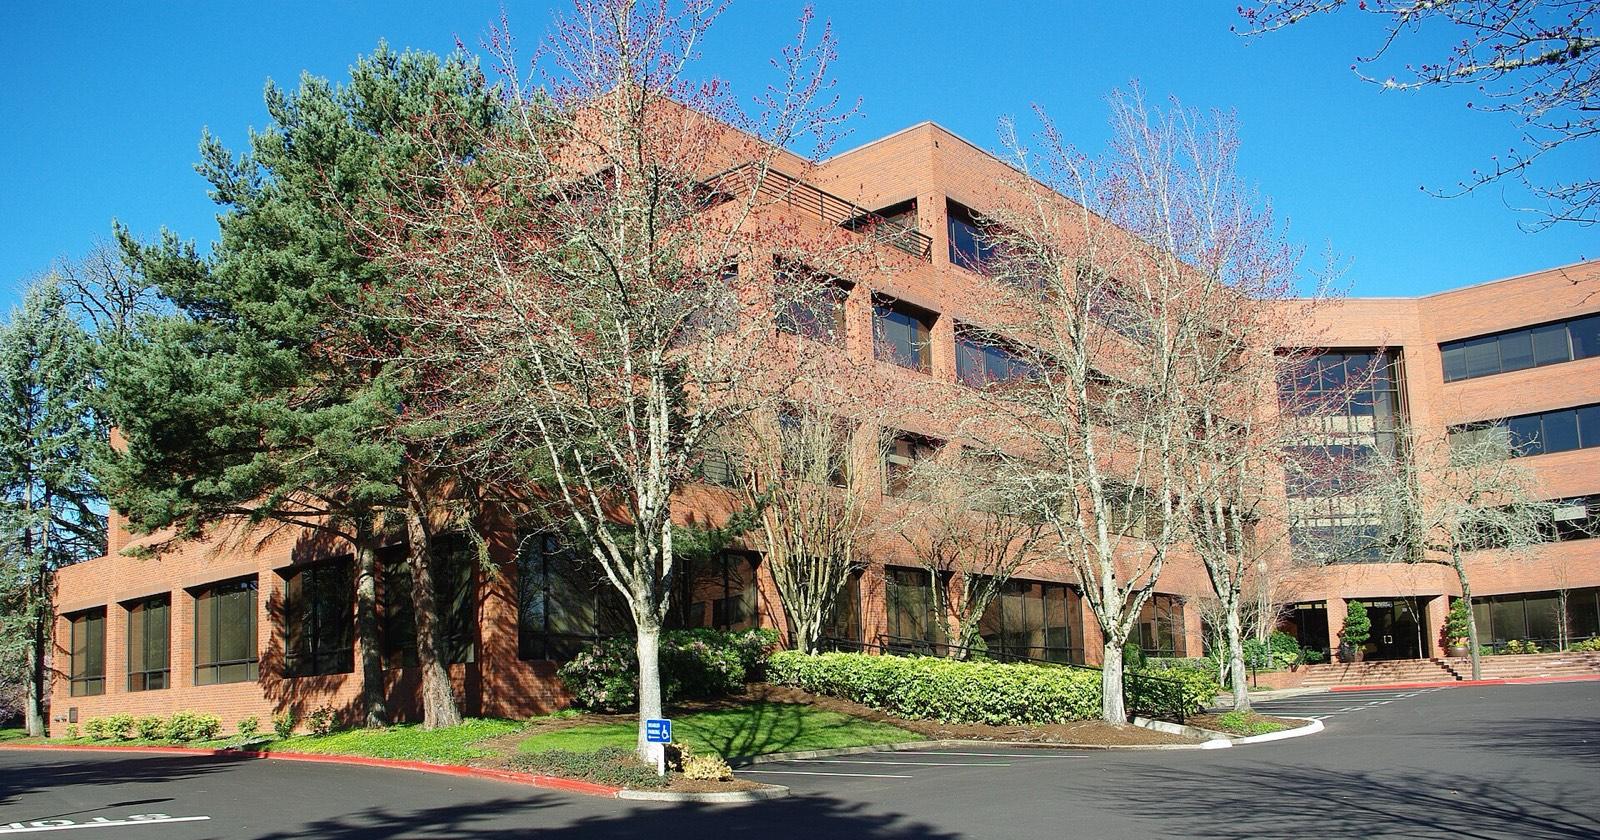
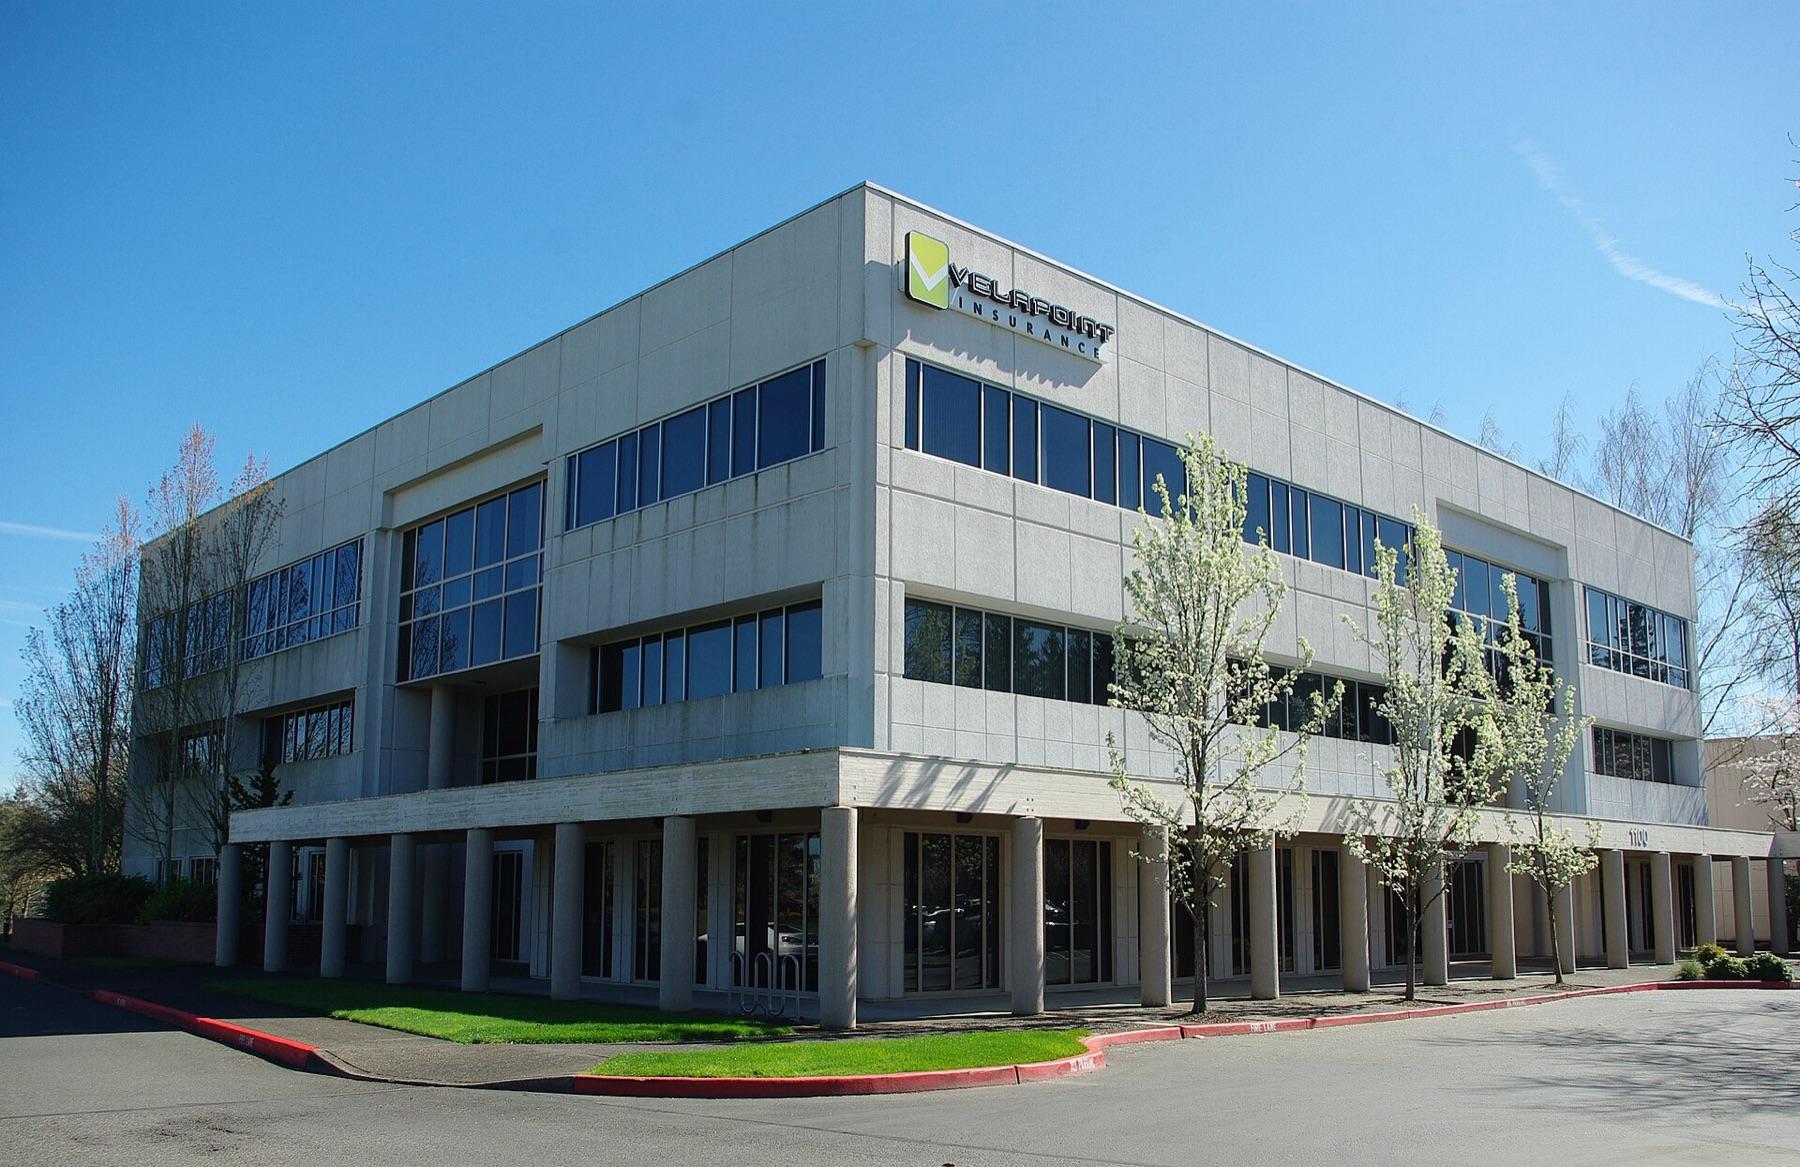
The buildings
Ten city blocks account for 54% of downtown’s job loss. These are the buildings on the blocks that lost the most.
A census block downtown is usually one city block. We matched the blocks that lost the most jobs to the buildings on them, then searched company filings, public agency records and news reports for what each employer did and why.
Every downtown block that gained or lost 150 jobs or more, 2019 to 2024
Orange circles lost jobs and blue circles gained them. The size of a circle is the number of jobs. The ten blocks that lost the most lost 8,827 jobs between them, which is 53.7% of downtown’s net change and 32.4% of all the jobs lost on blocks that fell.B1 The map and the table below cover a wider area, out to 1.25 miles from the center. Hover or tap a circle for the building.
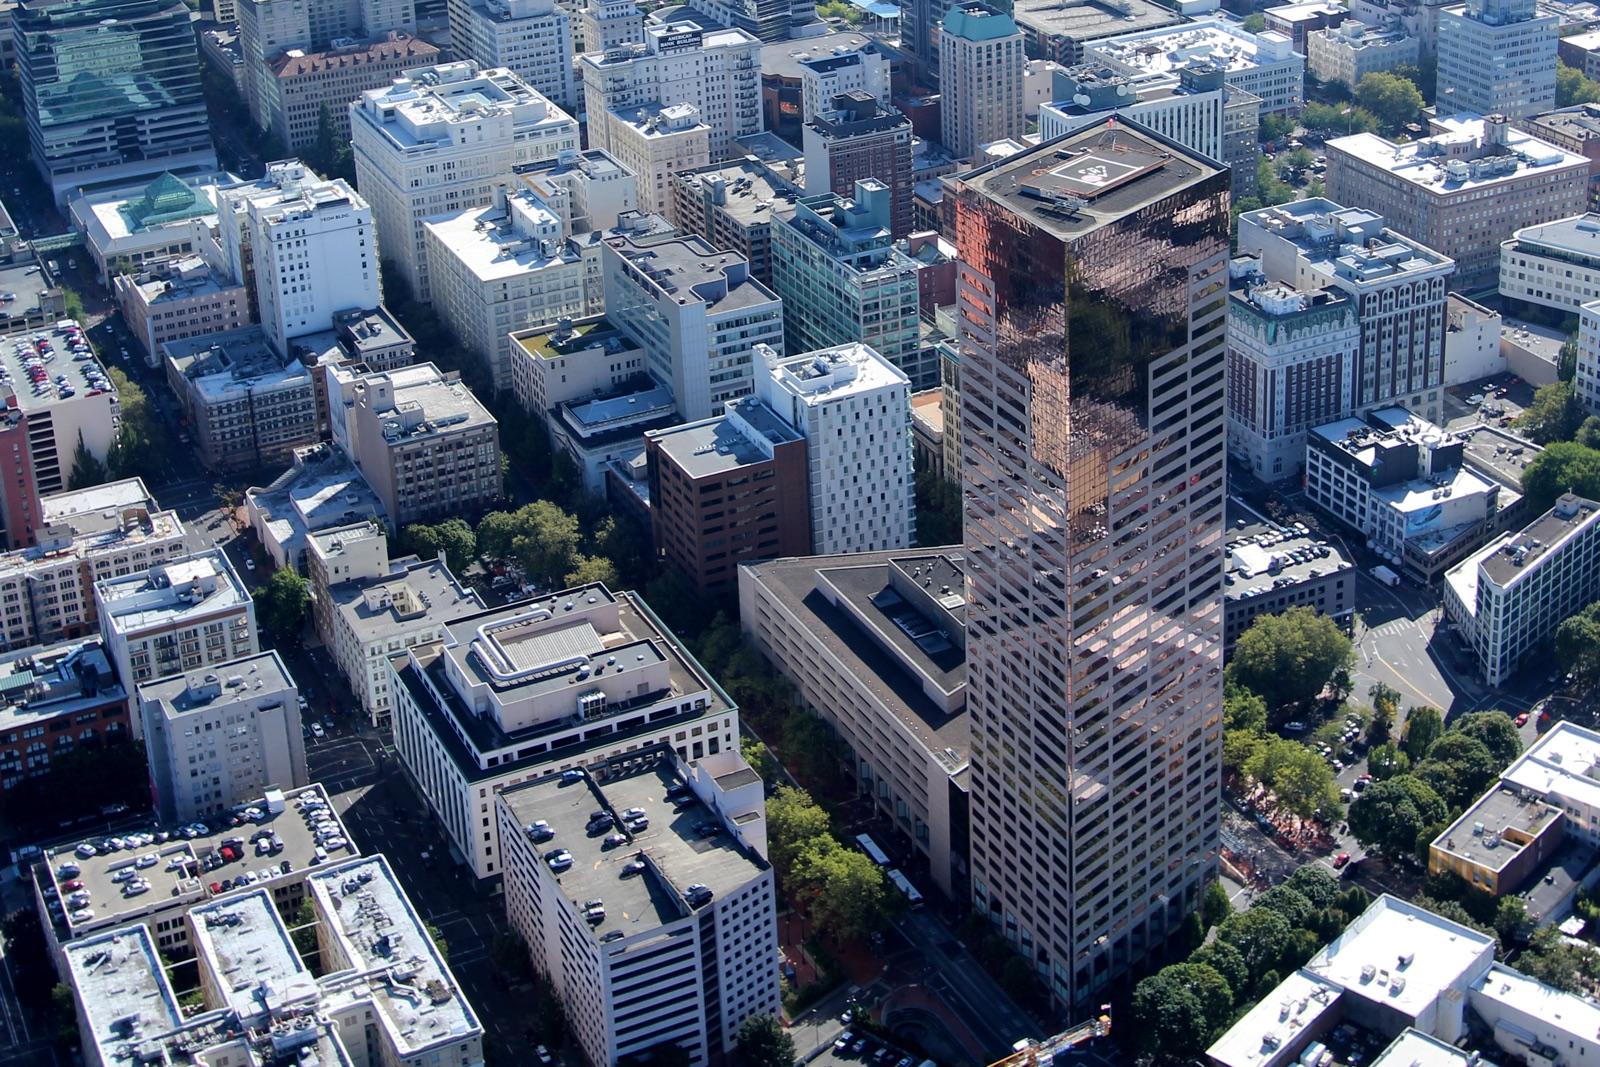
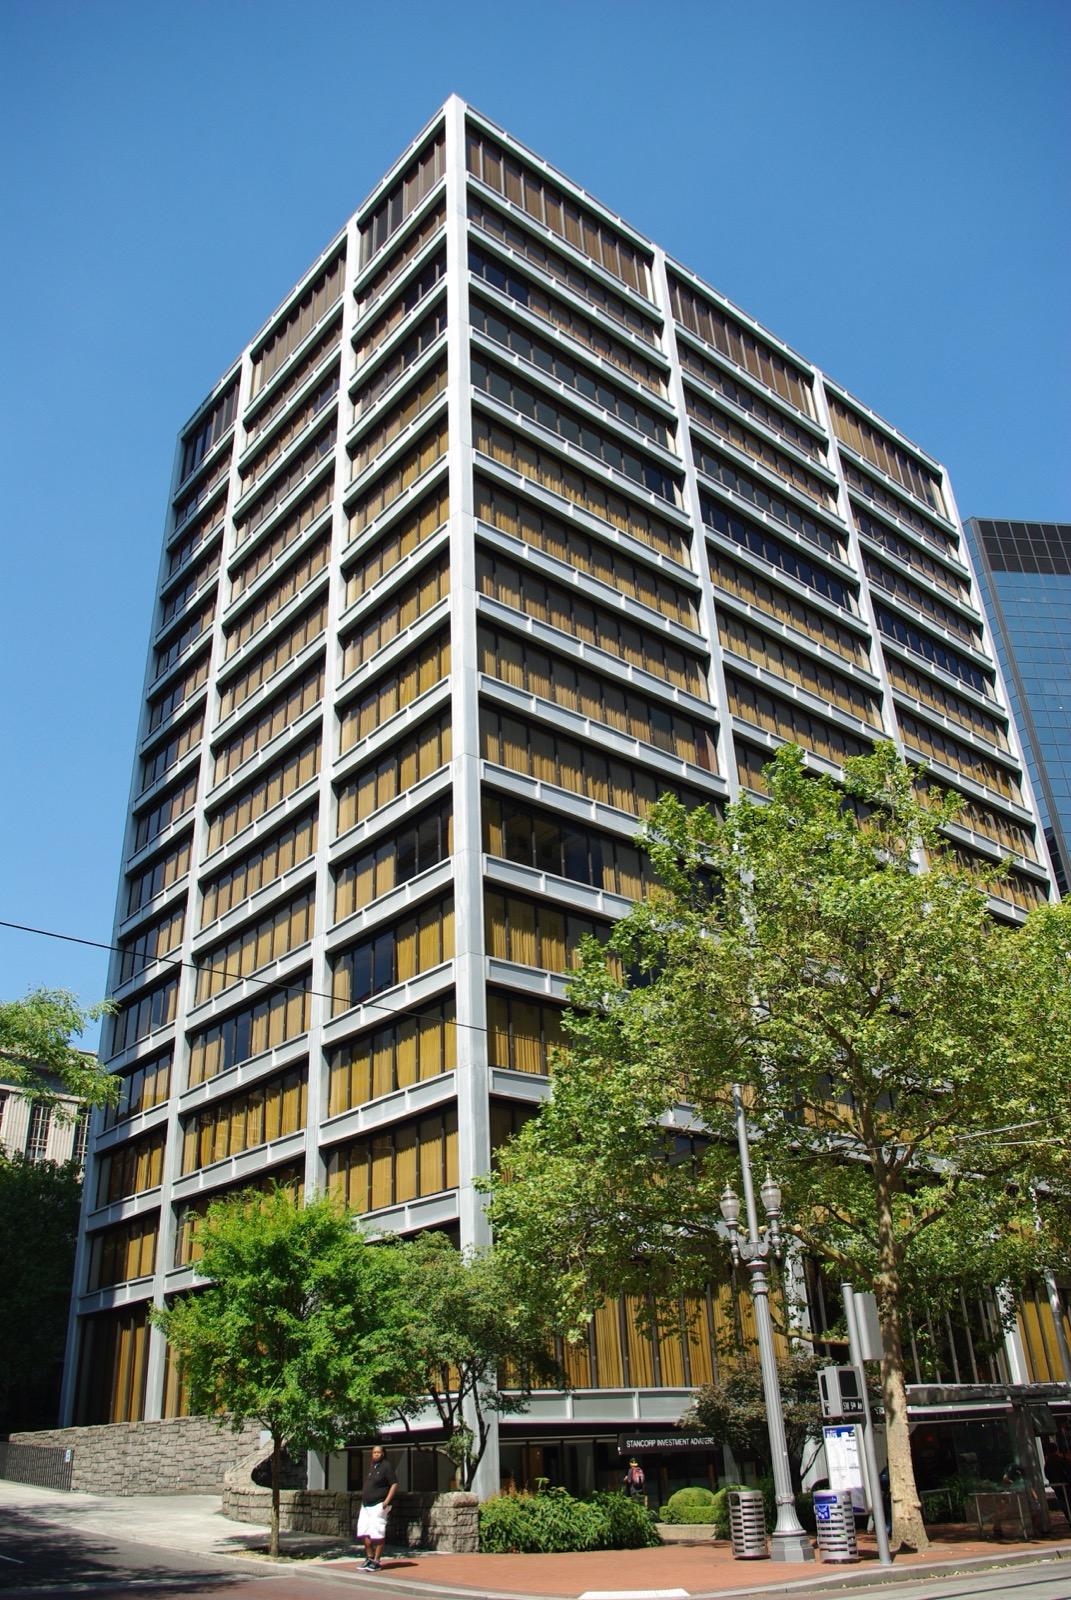
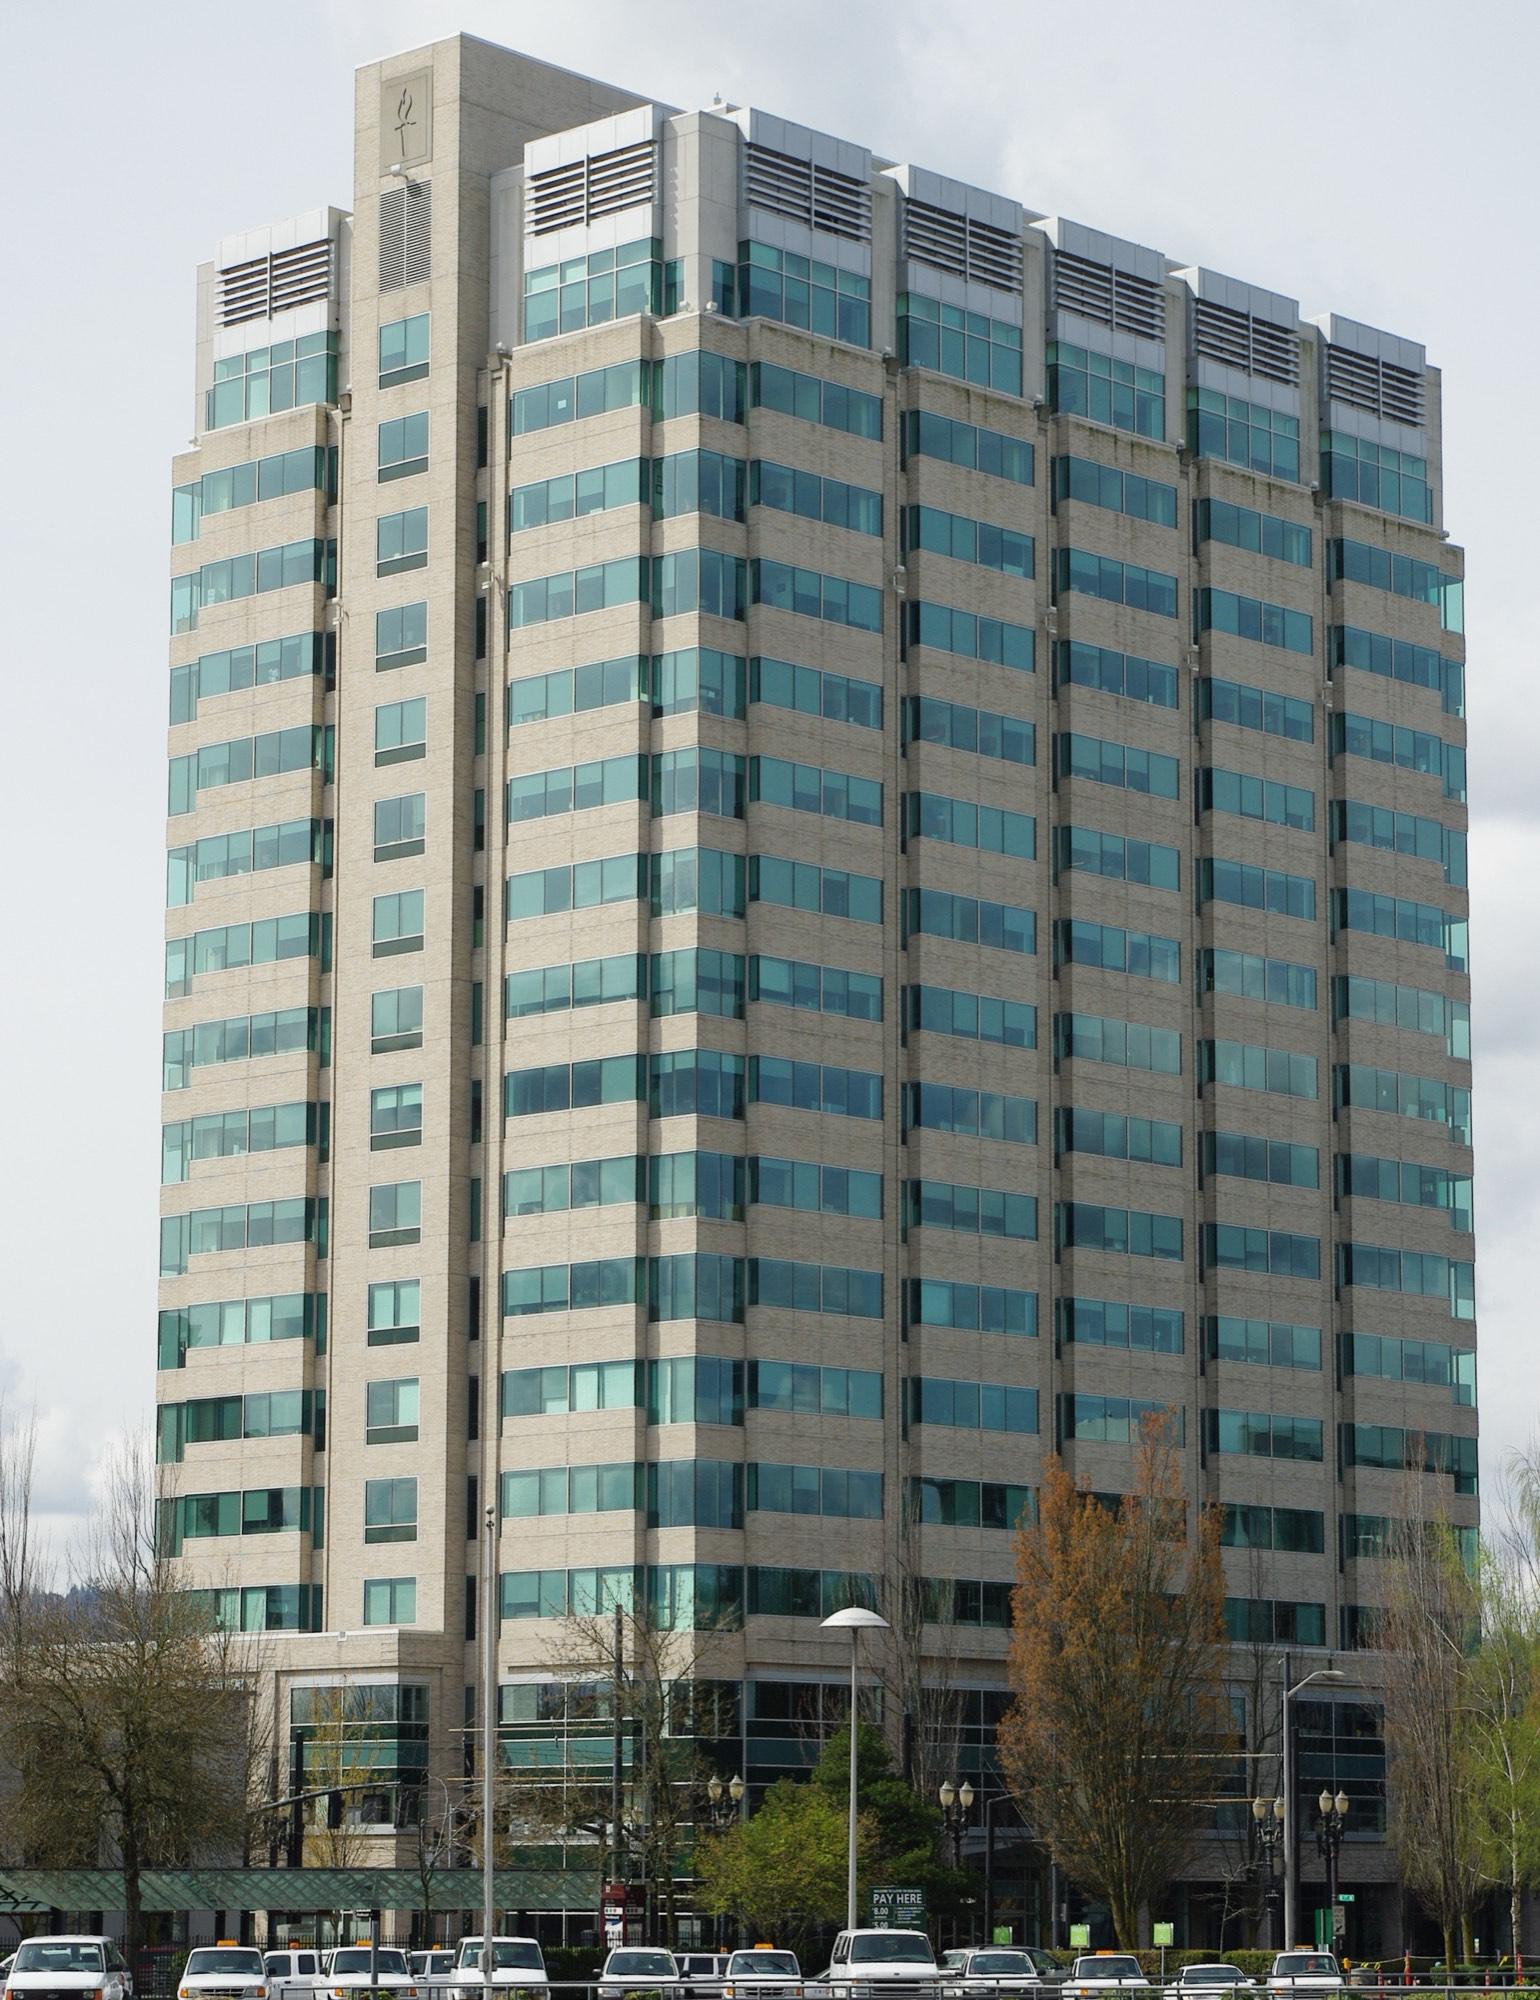
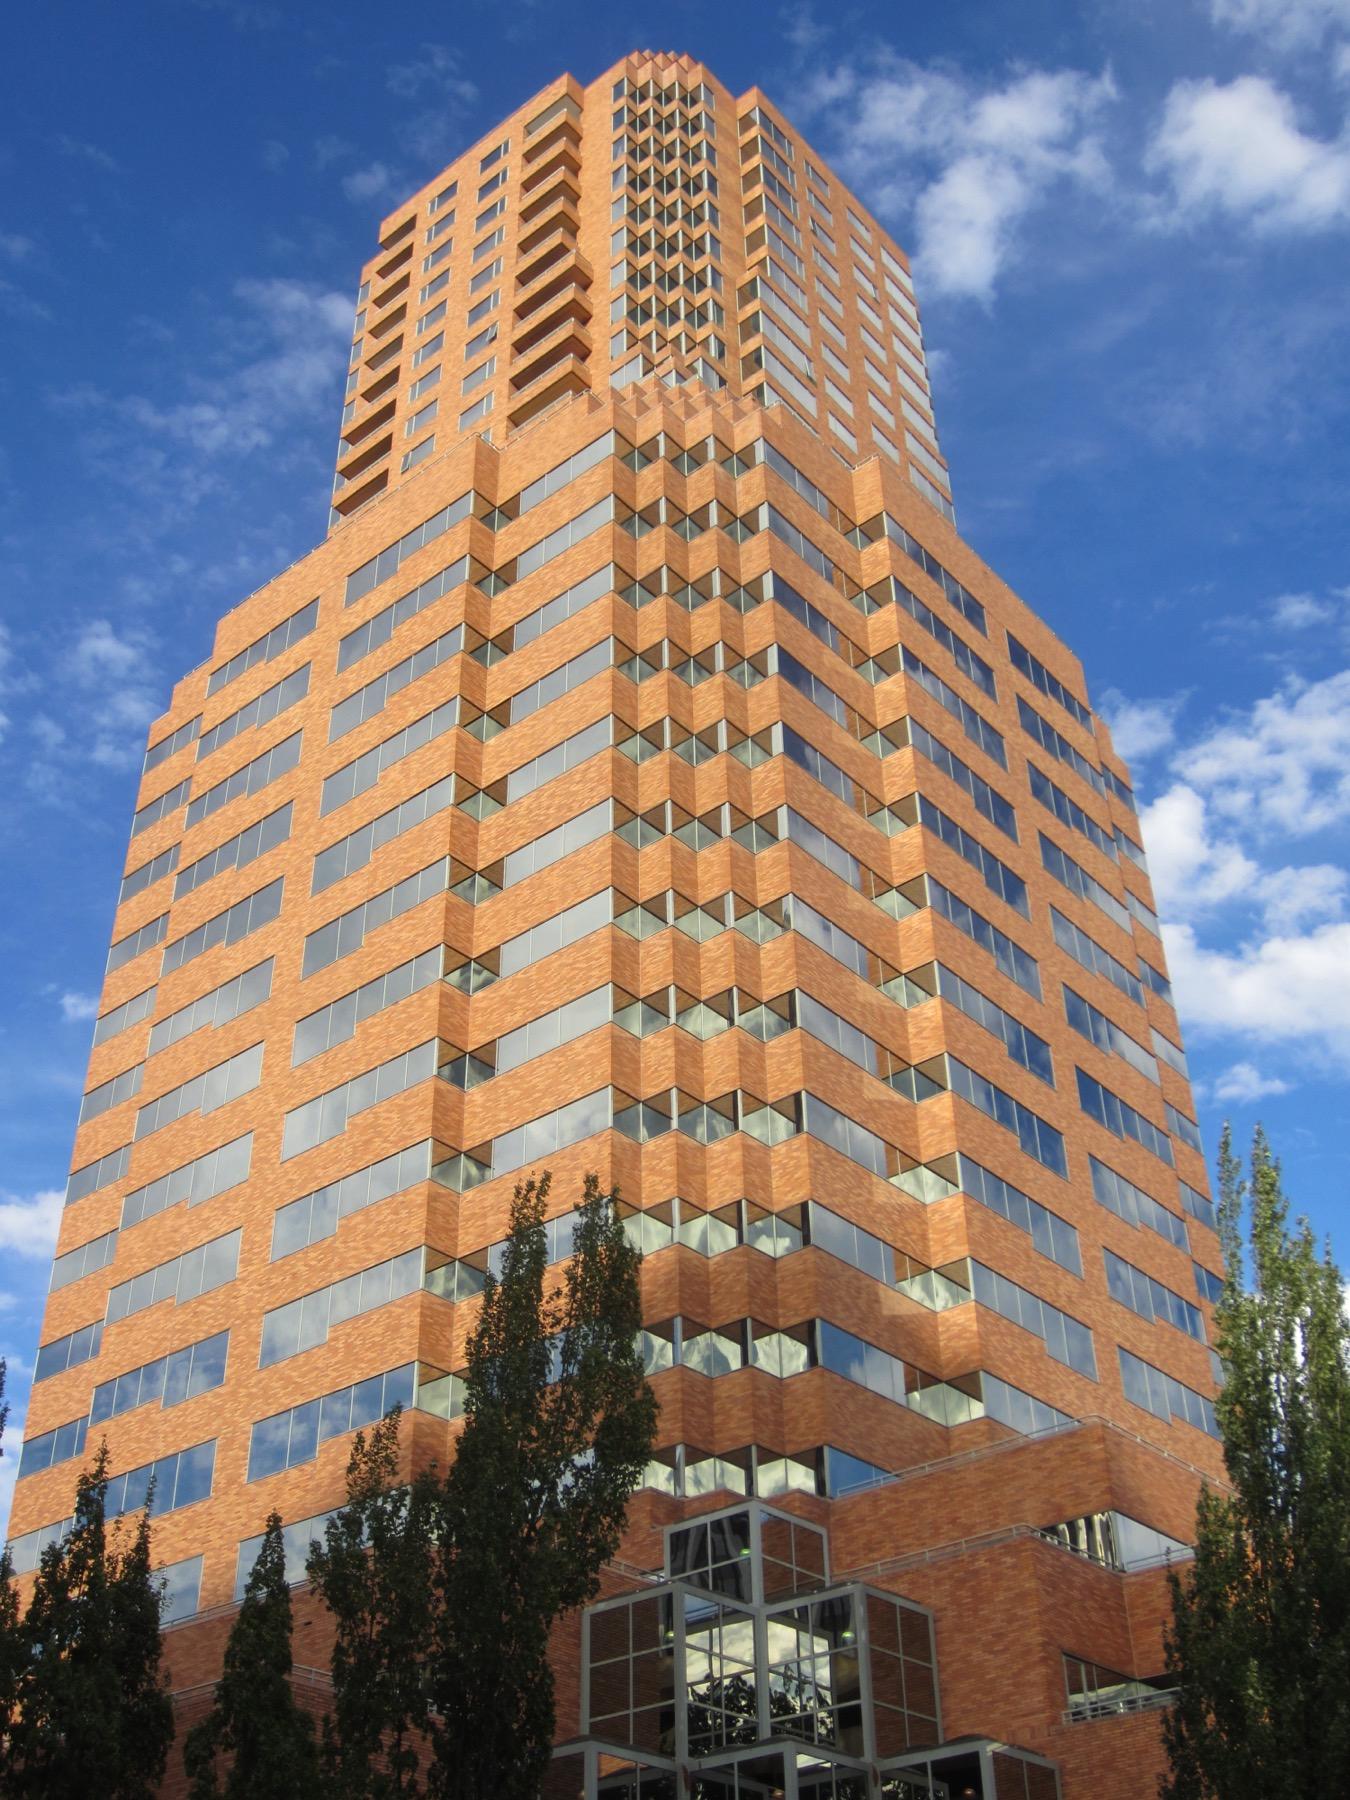
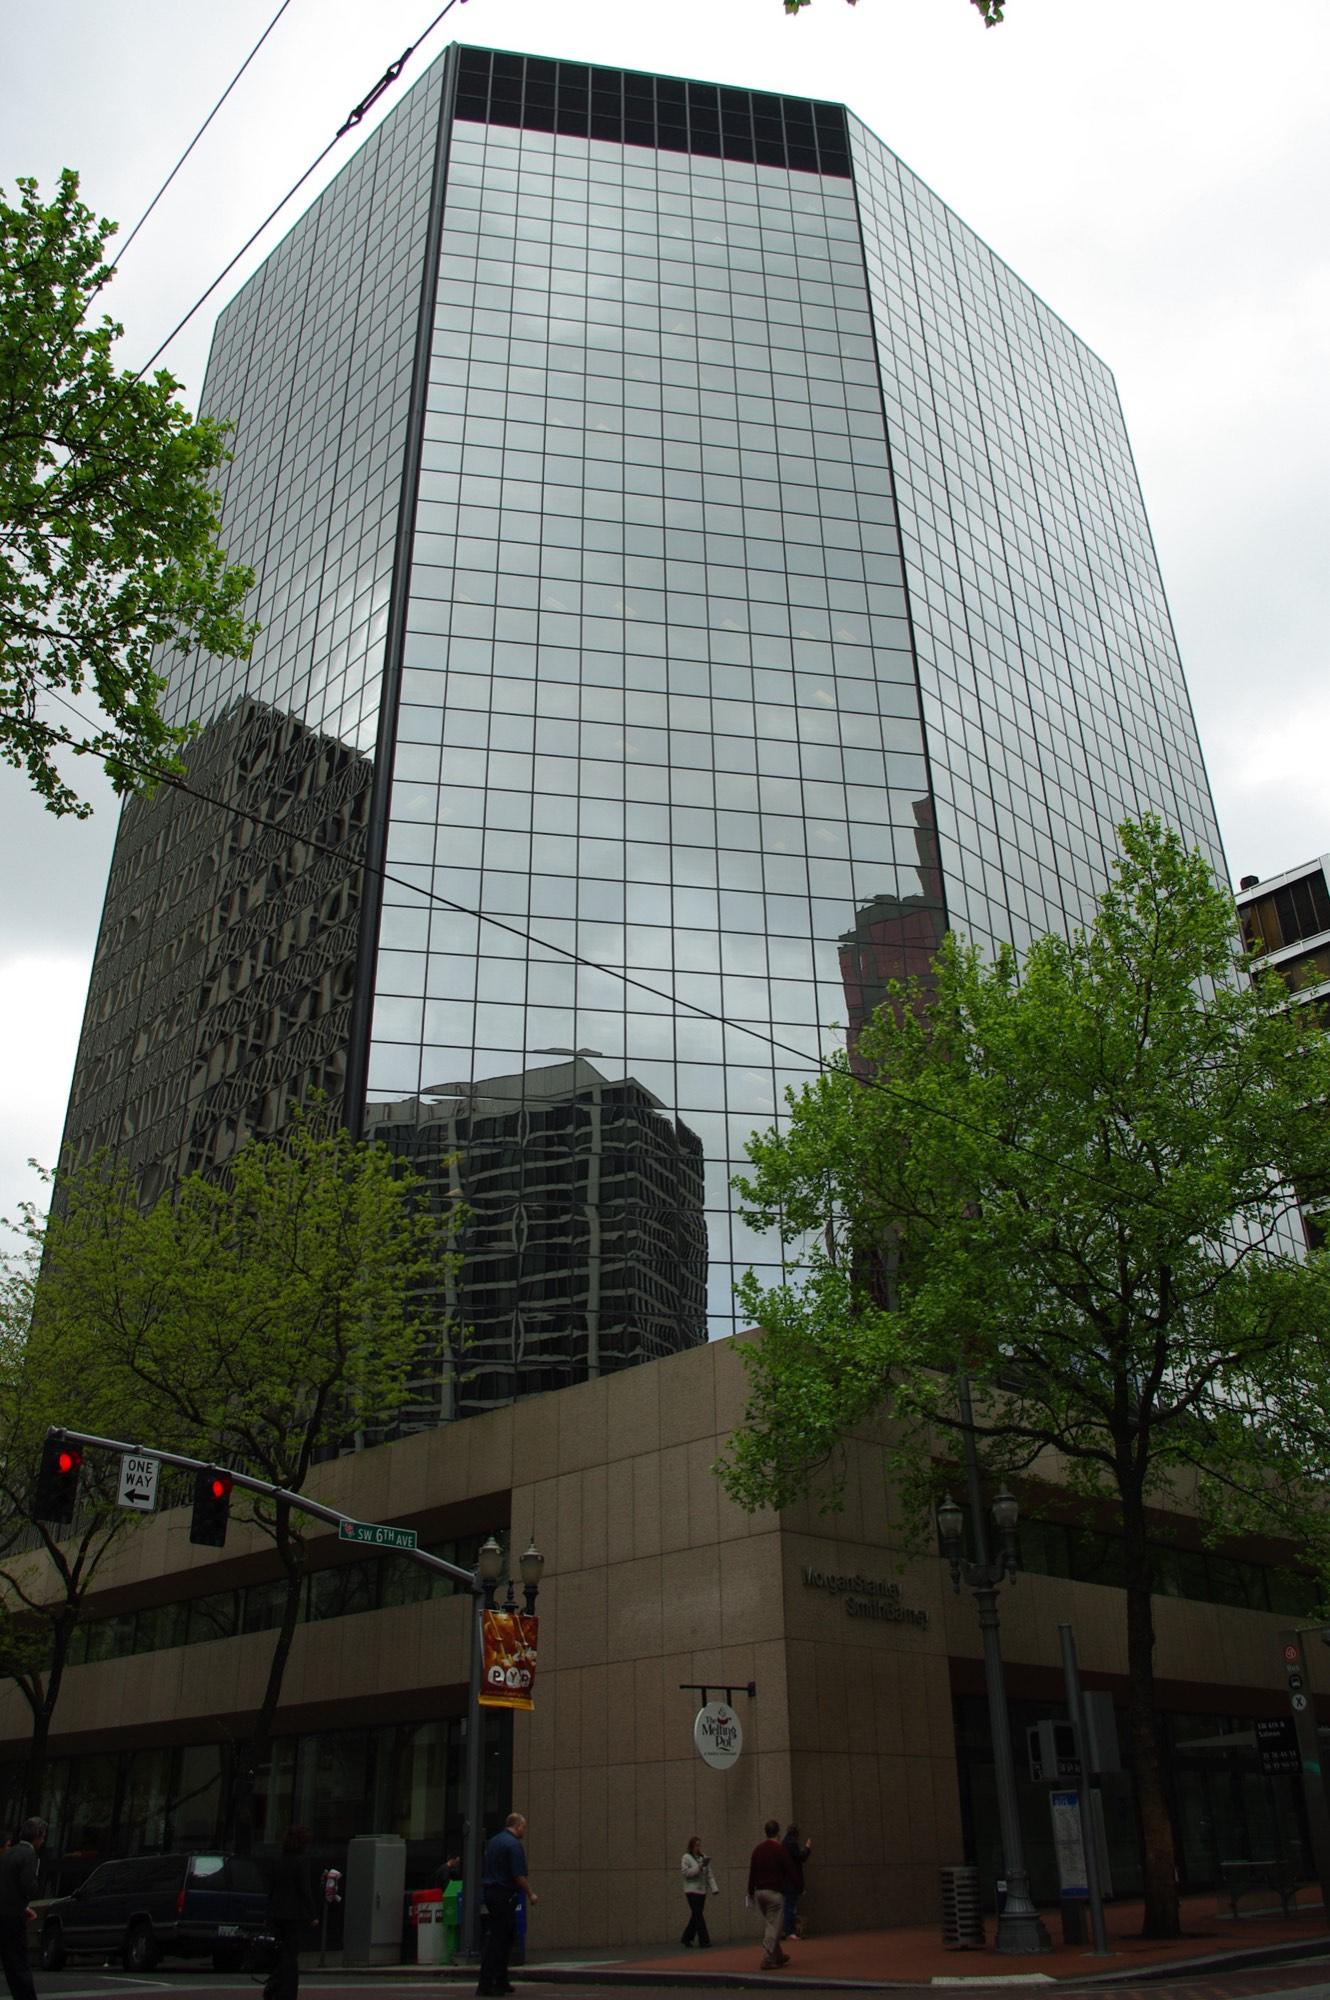
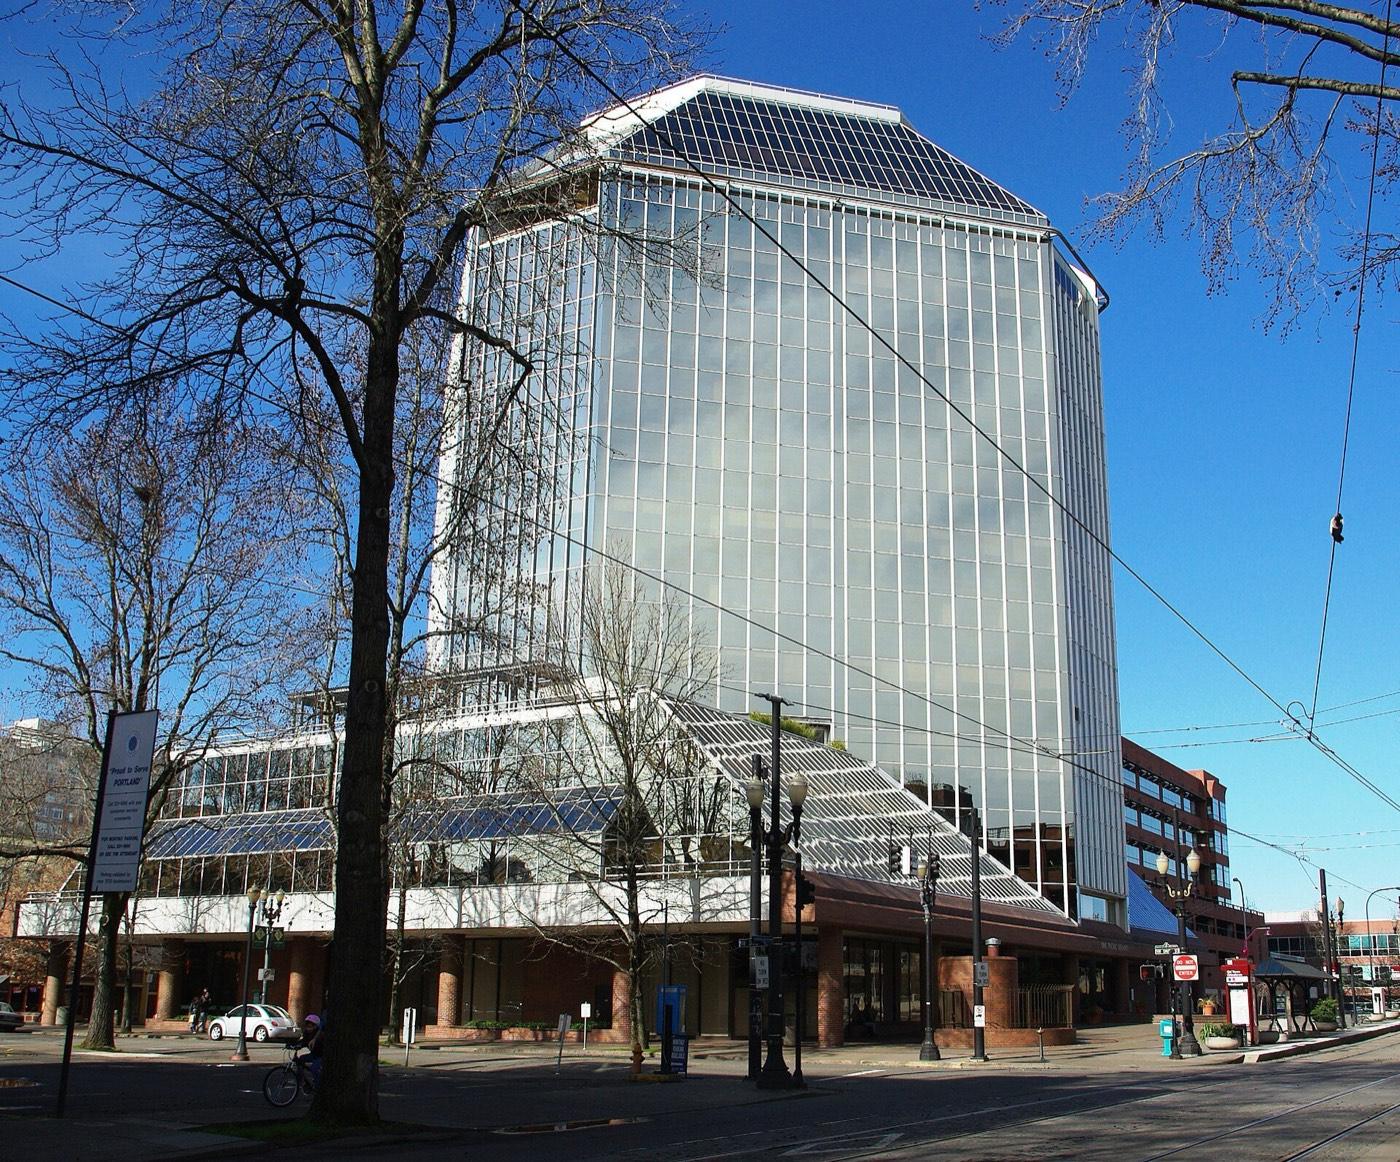
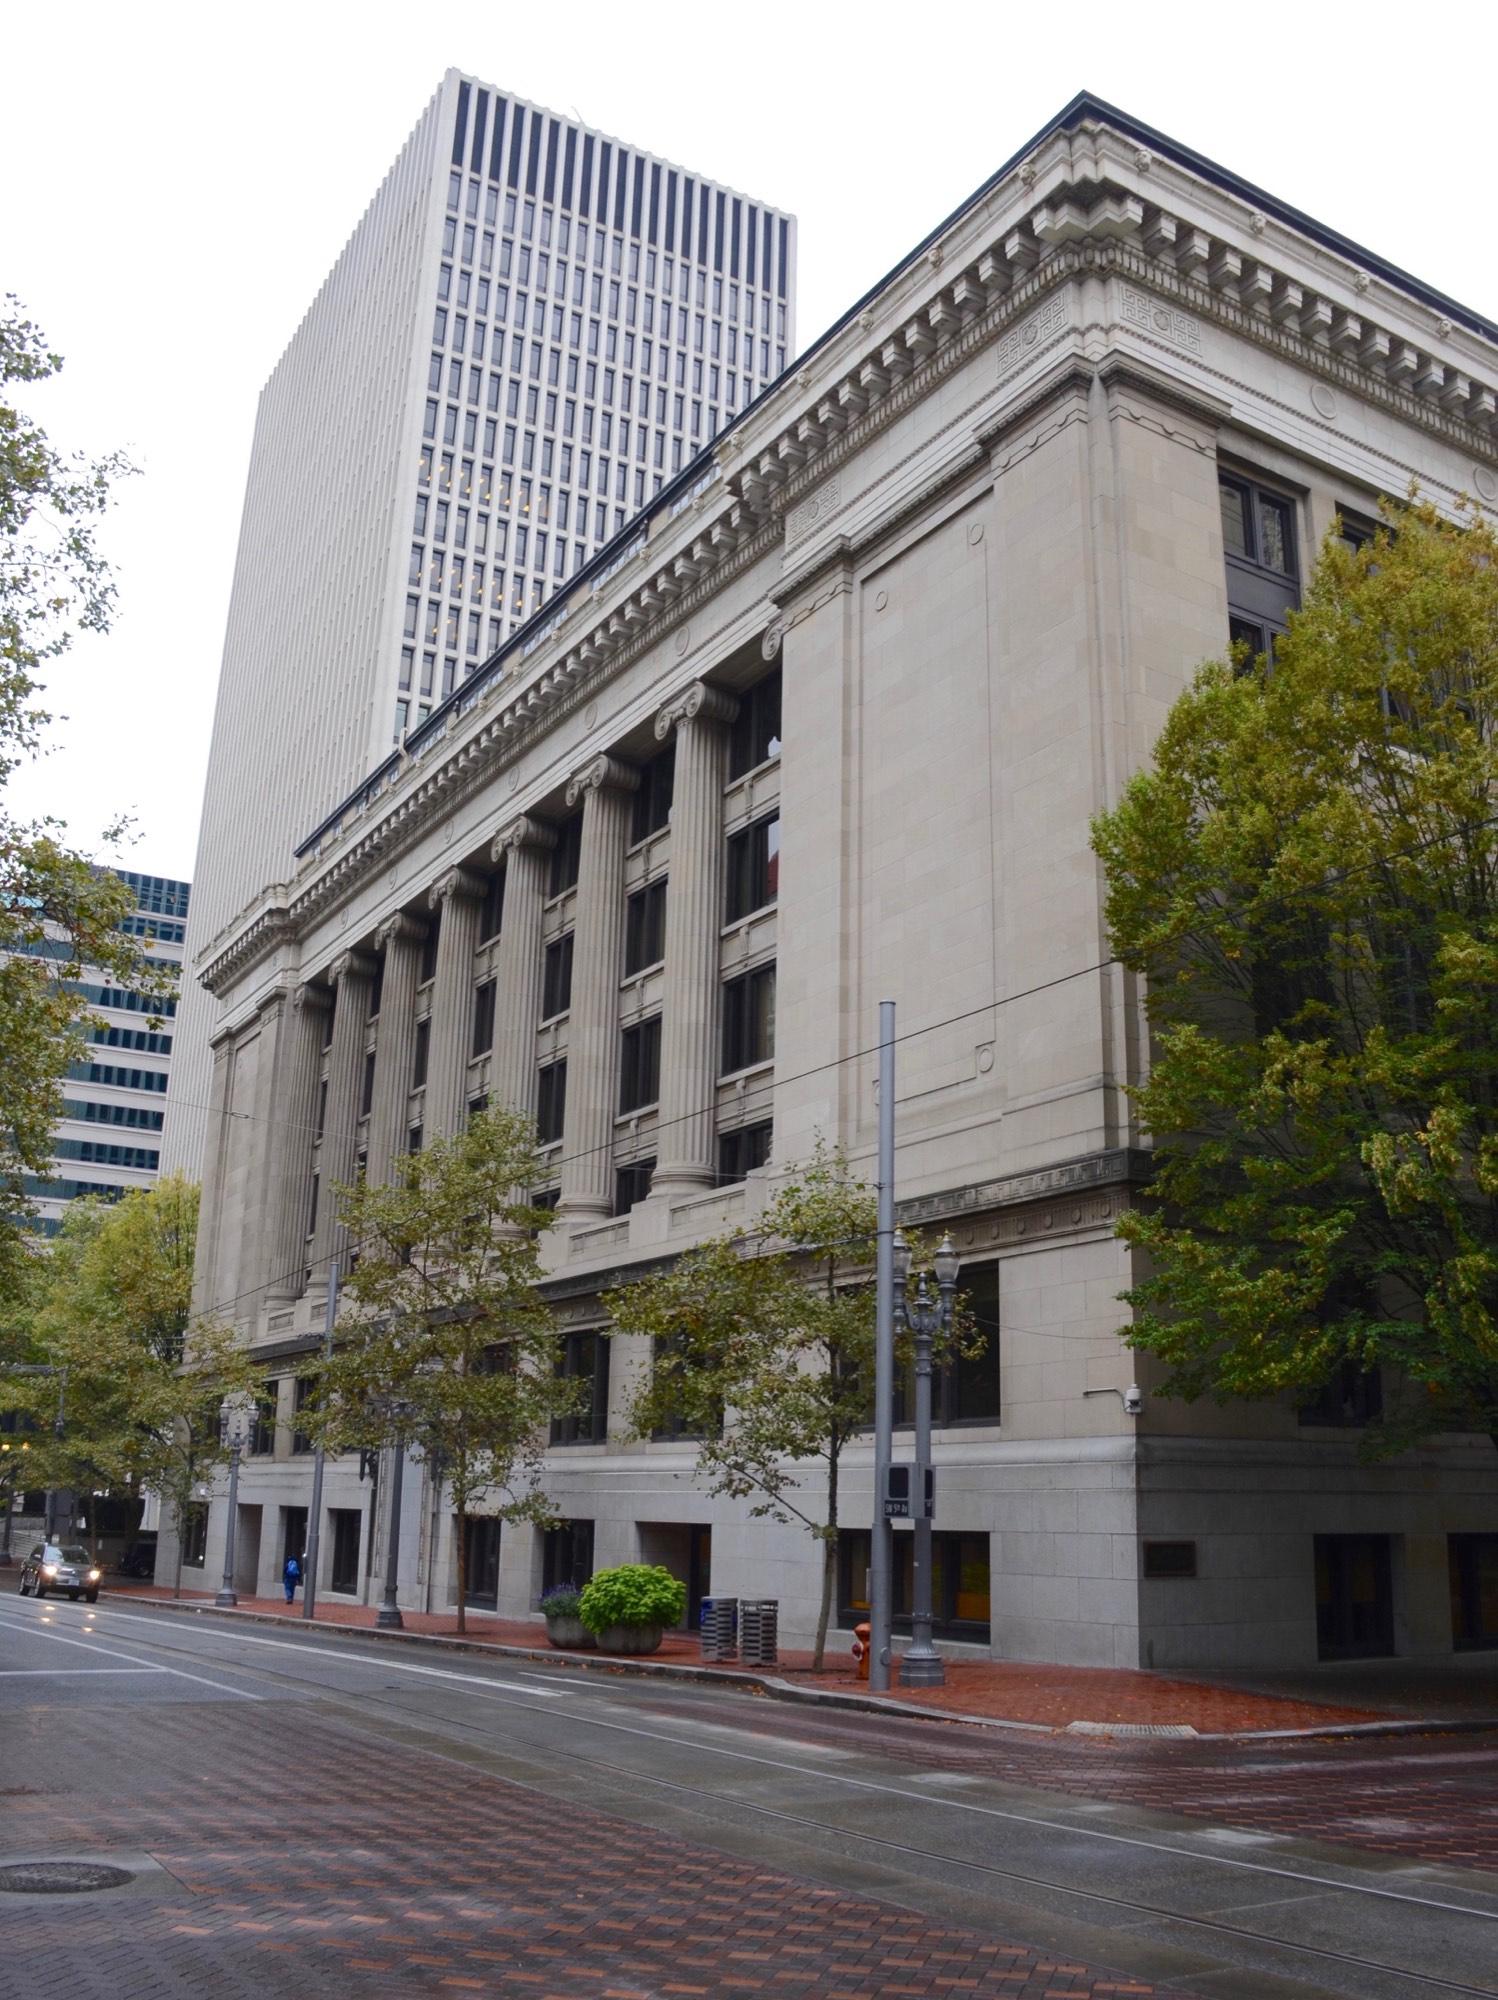
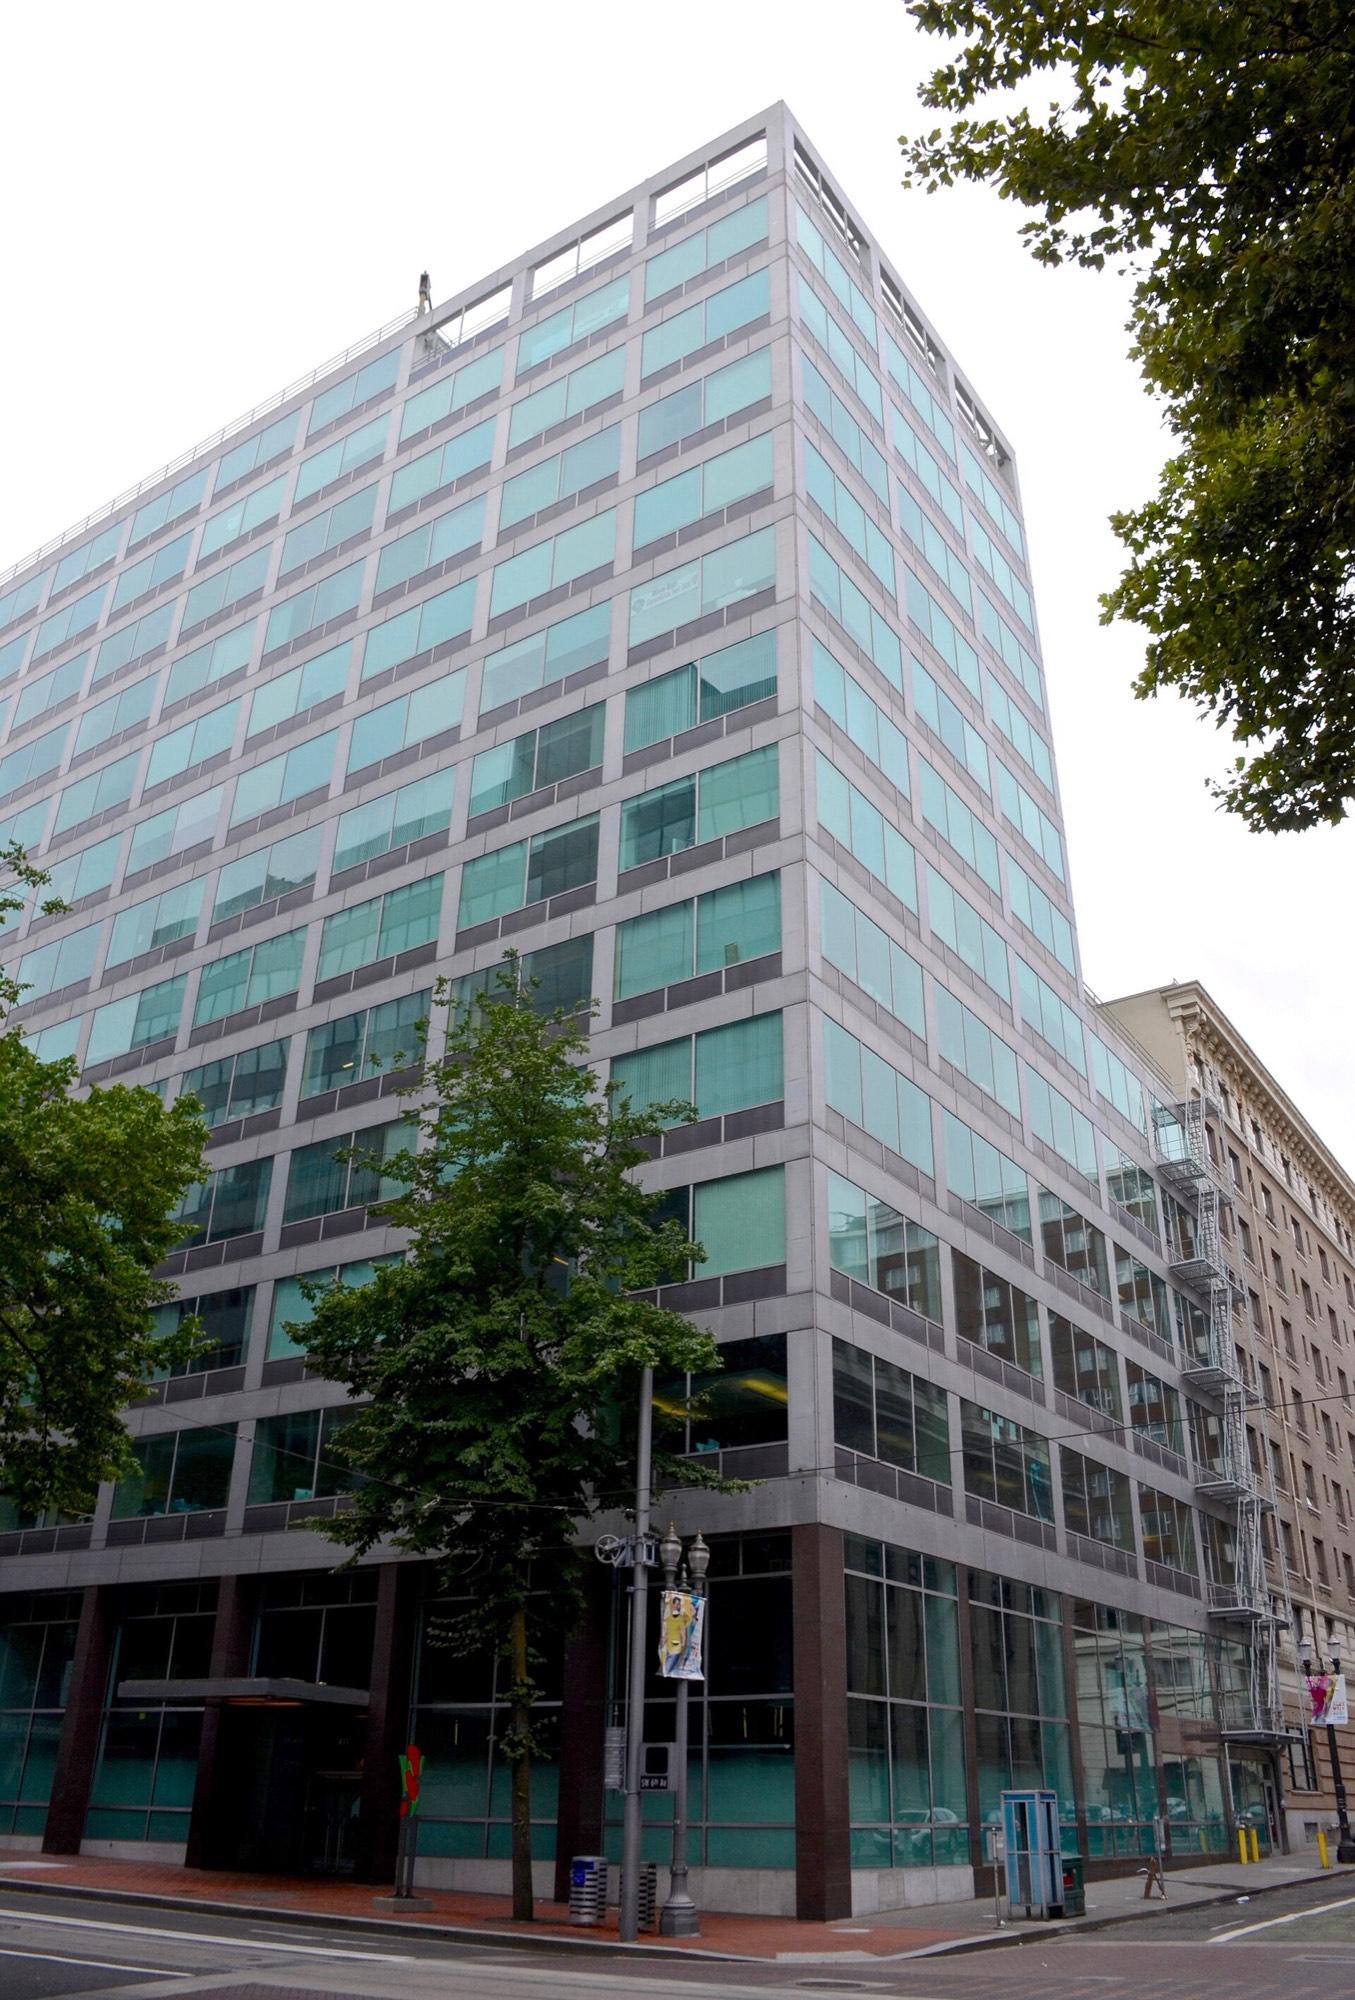
The fifteen blocks that lost the most jobs
The job records count jobs by block and by industry. They never name an employer. Where a building has one main tenant, the industry suggests who it is.B2 B10
Compared here: The fifteen census blocks within 1.25 miles of the center of downtown that lost the most jobs. The pale bar is the block’s jobs in 2019 and the dark part is what remained in 2024. Under each is the largest change by industry.
- 1U.S. Bancorp Tower111 SW 5th Ave−2,569
Finance and insurance 1,410 to 222; administrative and support services 775 to 216. U.S. Bank said in September 2024 that it would not renew most of its lease here; finance jobs on the block had fallen in every year since 2019.
- 2Standard Plaza1100 SW 6th Ave−1,260
Finance and insurance 1,695 to 356; other services 19 to 2. The Standard owns the building. That the lost finance jobs are its staff now working elsewhere is inferred. No document says so.
- 3Liberty Centre650 NE Holladay St−810
Finance and insurance 573 to 118; administrative and support services 357 to 39. Liberty Mutual said in September 2022 that it would leave the building by the end of that year for a smaller office in Lake Oswego.
- 4Harrison Square1800 SW 1st Ave, and 1618 SW 1st Ave−741
Real estate 473 to 43; administrative and support services 247 to 0. TriMet moved its offices from Harrison Square to One Main Place in June 2023.
- 5Congress Center1050 SW 6th Ave−655
Professional and technical services 575 to 280; public administration 239 to 24.
- 6Pioneer Tower and Pioneer Place888 and 700 SW 5th Ave−640
Professional and technical services 694 to 343; accommodation and food services 82 to 0.
- 7Cascade and Wilcox buildings and Hotel MonacoSW 6th Ave at SW Washington St−628
Management of companies 230 to 3; accommodation and food services 159 to 32.
- 8One Pacific Square220 NW 2nd Ave−605
Utilities 596 to 0; information 15 to 0. NW Natural moved its headquarters to 250 SW Taylor St in 2020.
- 9KOIN Tower222 SW Columbia St−604
Administrative and support services 704 to 377; finance and insurance 338 to 158.
- 10Portland State University offices1600 SW 4th Ave−591
Education 3,766 to 2,898; management of companies 80 to 3. The university's education jobs first appear at this one block in 2018 (0 in 2017, 4,035 in 2018), which suggests its whole payroll is reported at this address. That reading is inferred.
- 112525 and 2501 SW 1st Ave−588
Information 432 to 213; administrative and support services 138 to 1.
- 12SE Yamhill St at SE Water Ave (61 to 115 SE Yamhill St)−534
Health care and social assistance 328 to 0; manufacturing 252 to 44.
- 13Old Multnomah County Courthouse1021 SW 4th Ave−494
Public administration 484 to 1; information 9 to 0. The courts moved to the new courthouse in October 2020; the job records show most of the move in 2023.
- 14Graphic Arts Building120 NW 9th Ave, and 165 NW Park Ave−474
Administrative and support services 202 to 0; professional and technical services 178 to 0.
- 15Commonwealth Building421 SW 6th Ave; Hotel Lucia; Hotel Vintage−422
Accommodation and food services 217 to 78; professional and technical services 608 to 508.
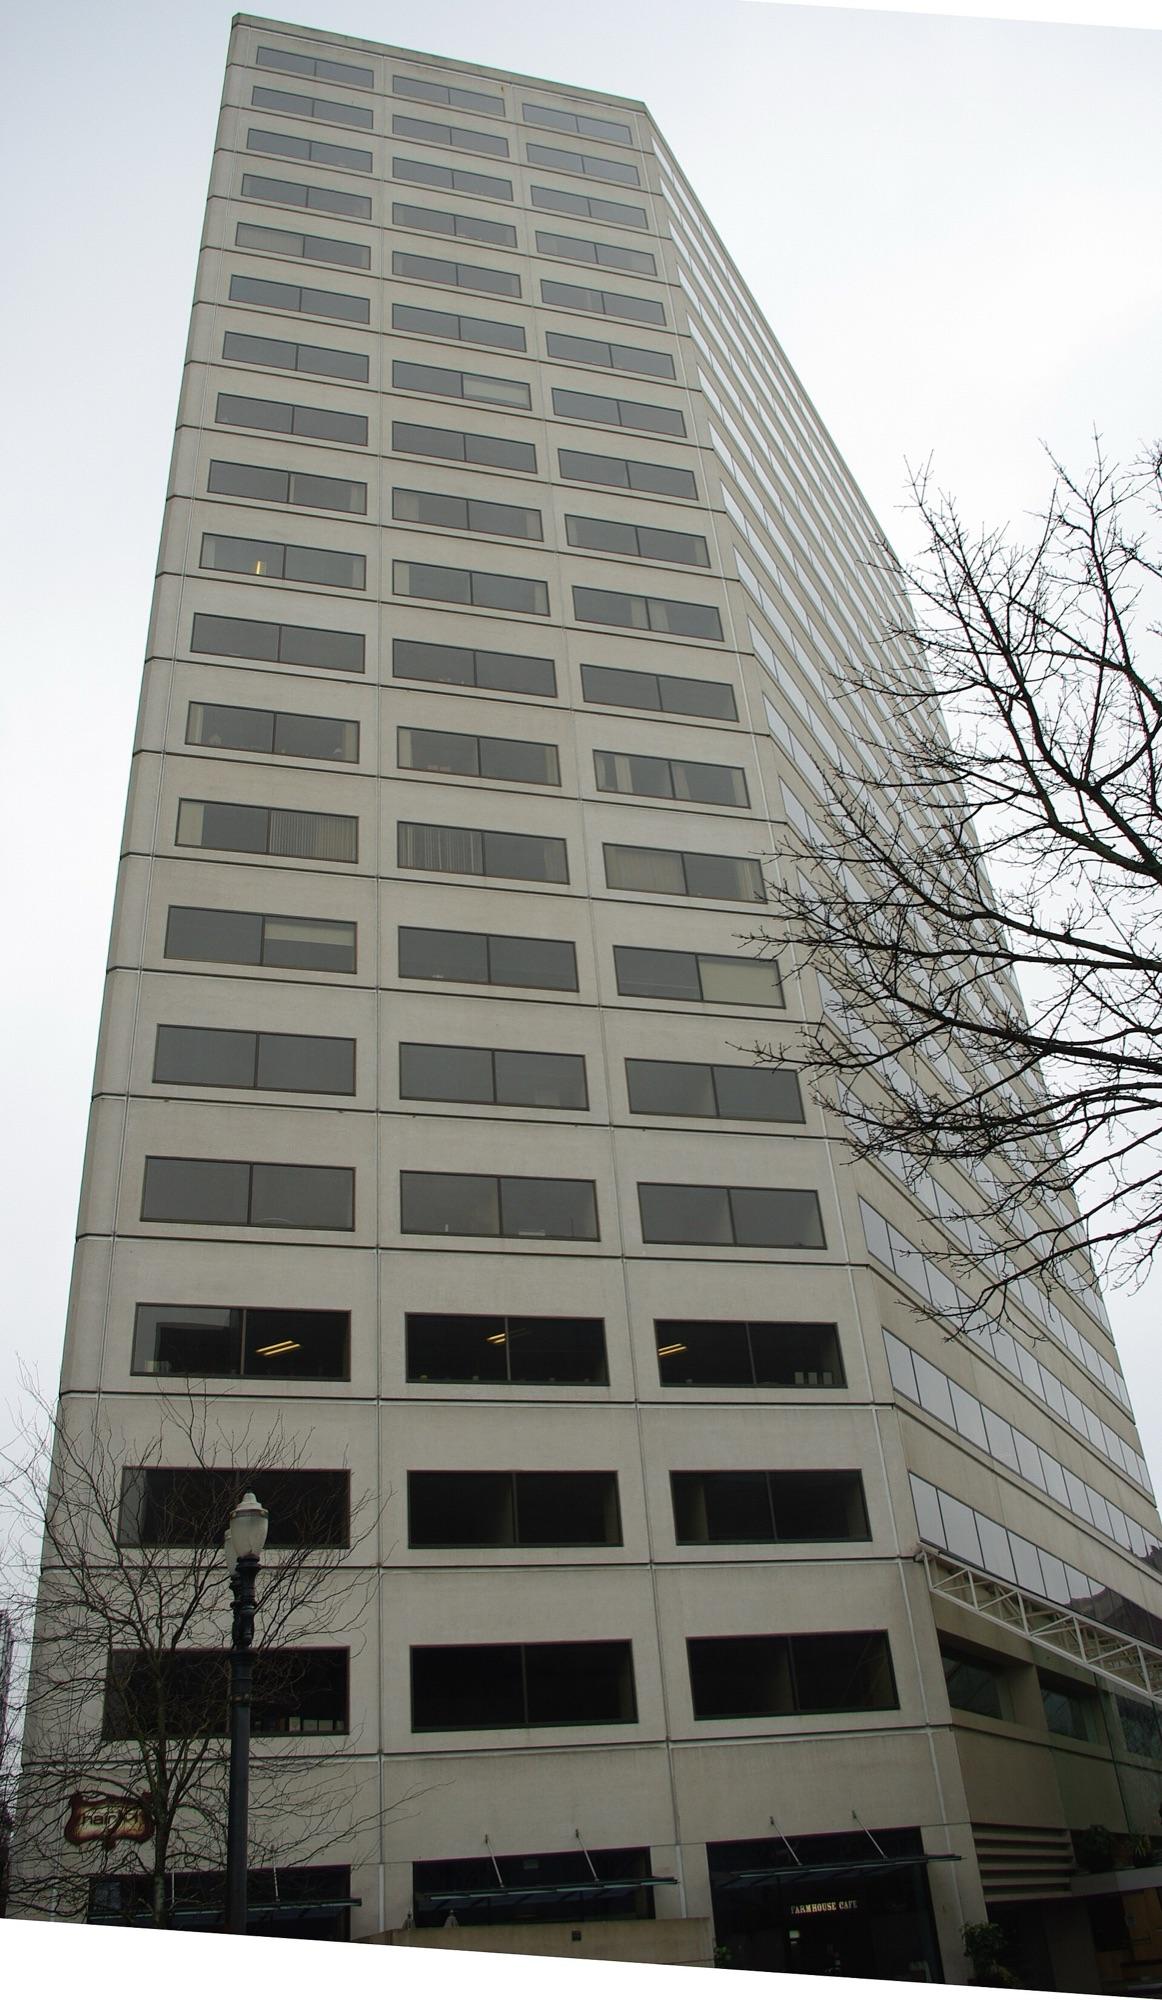
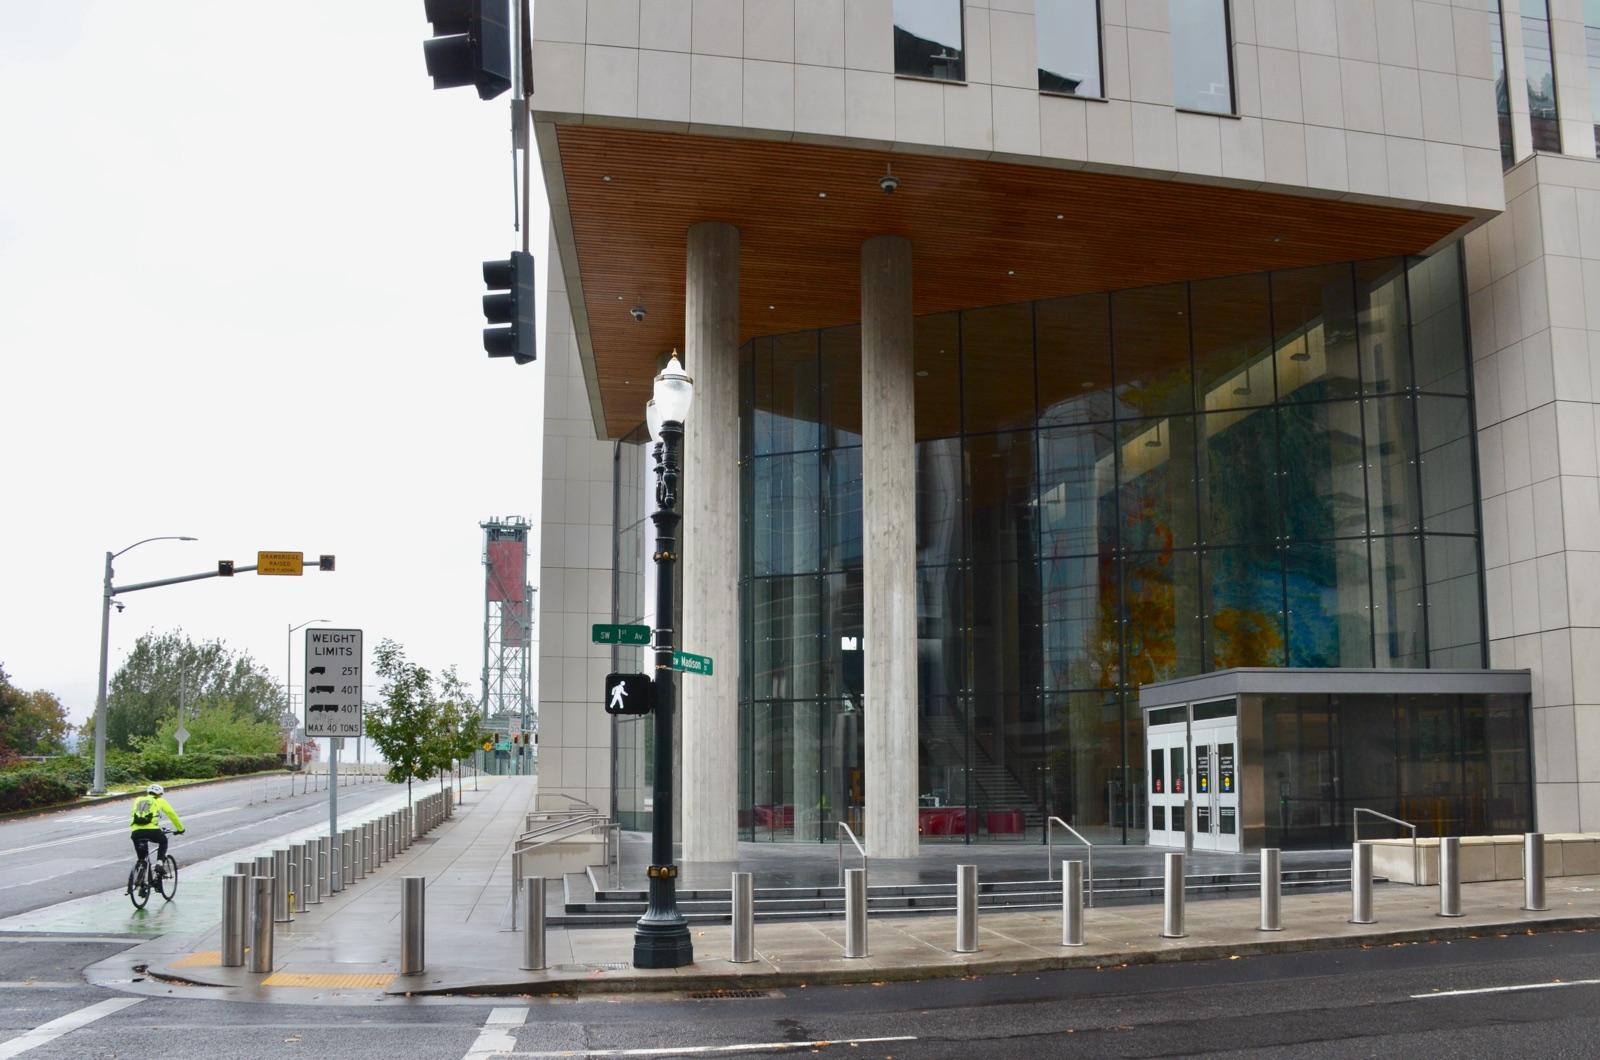
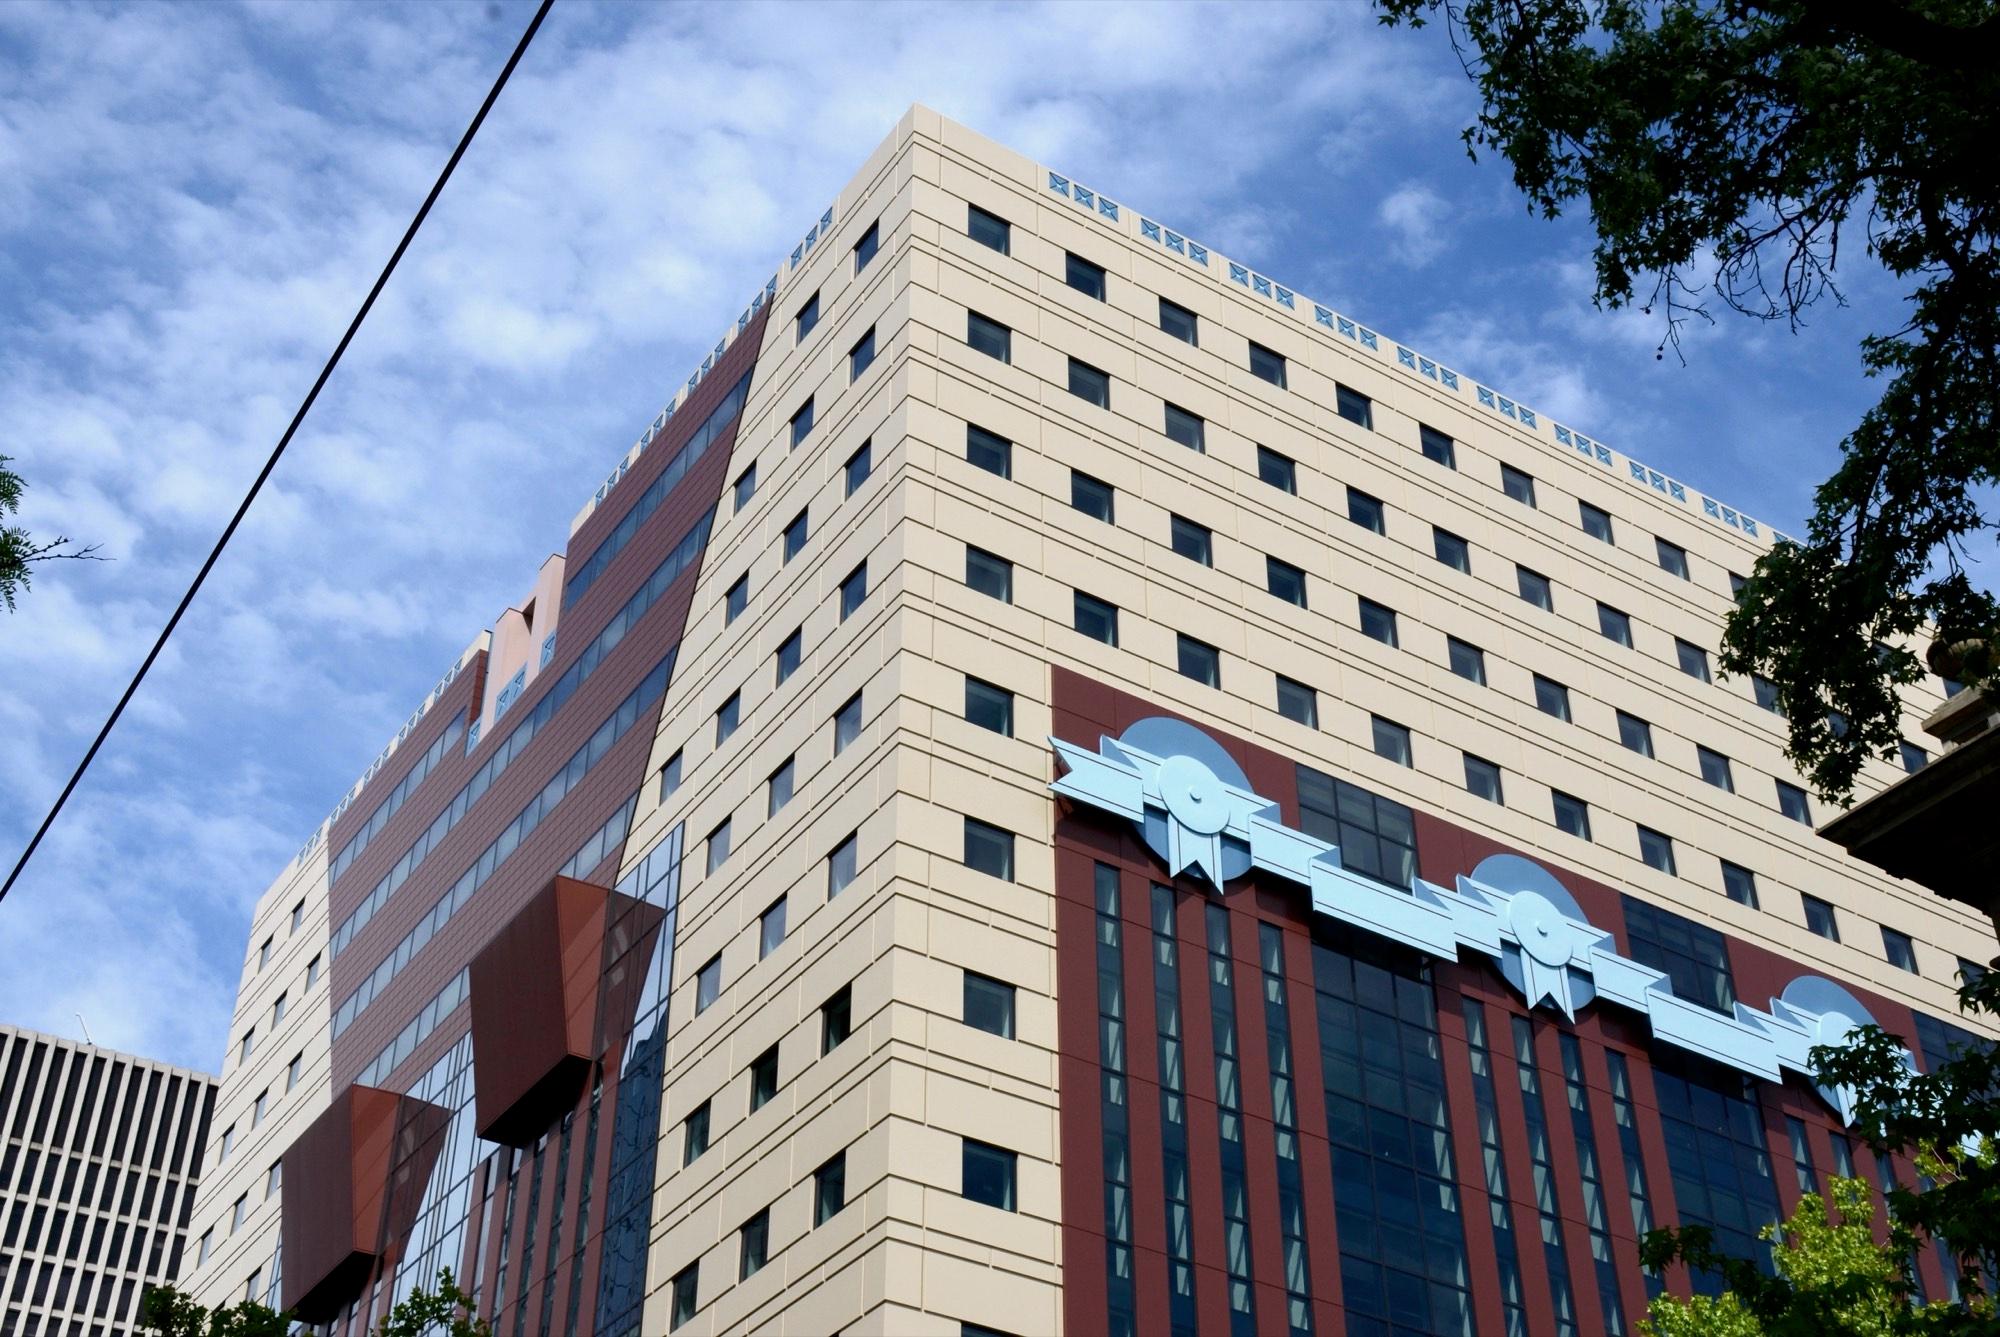
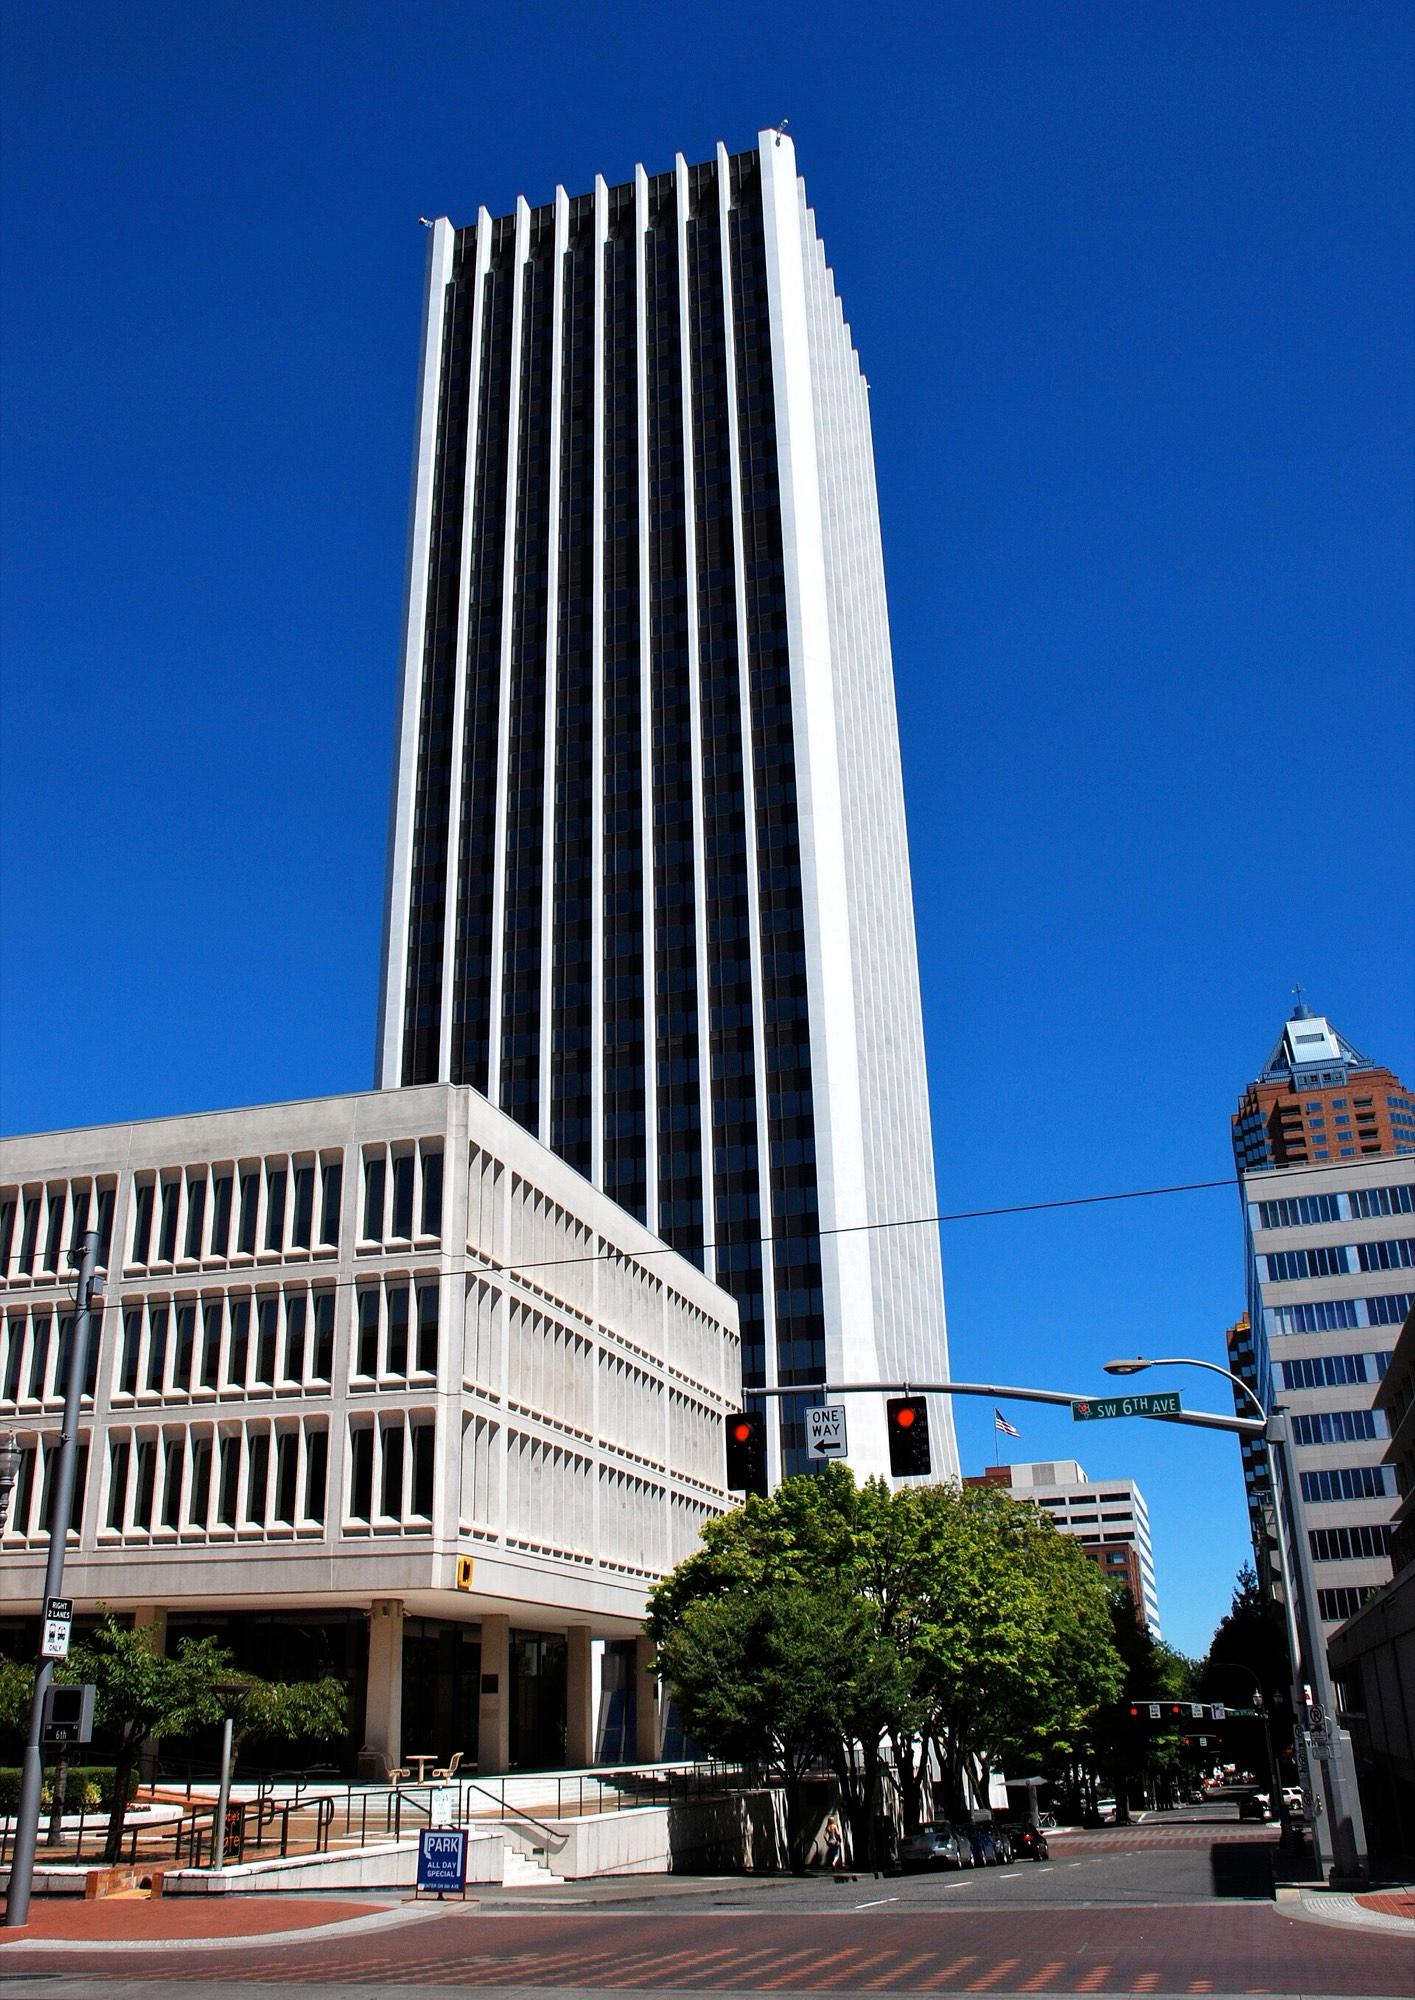
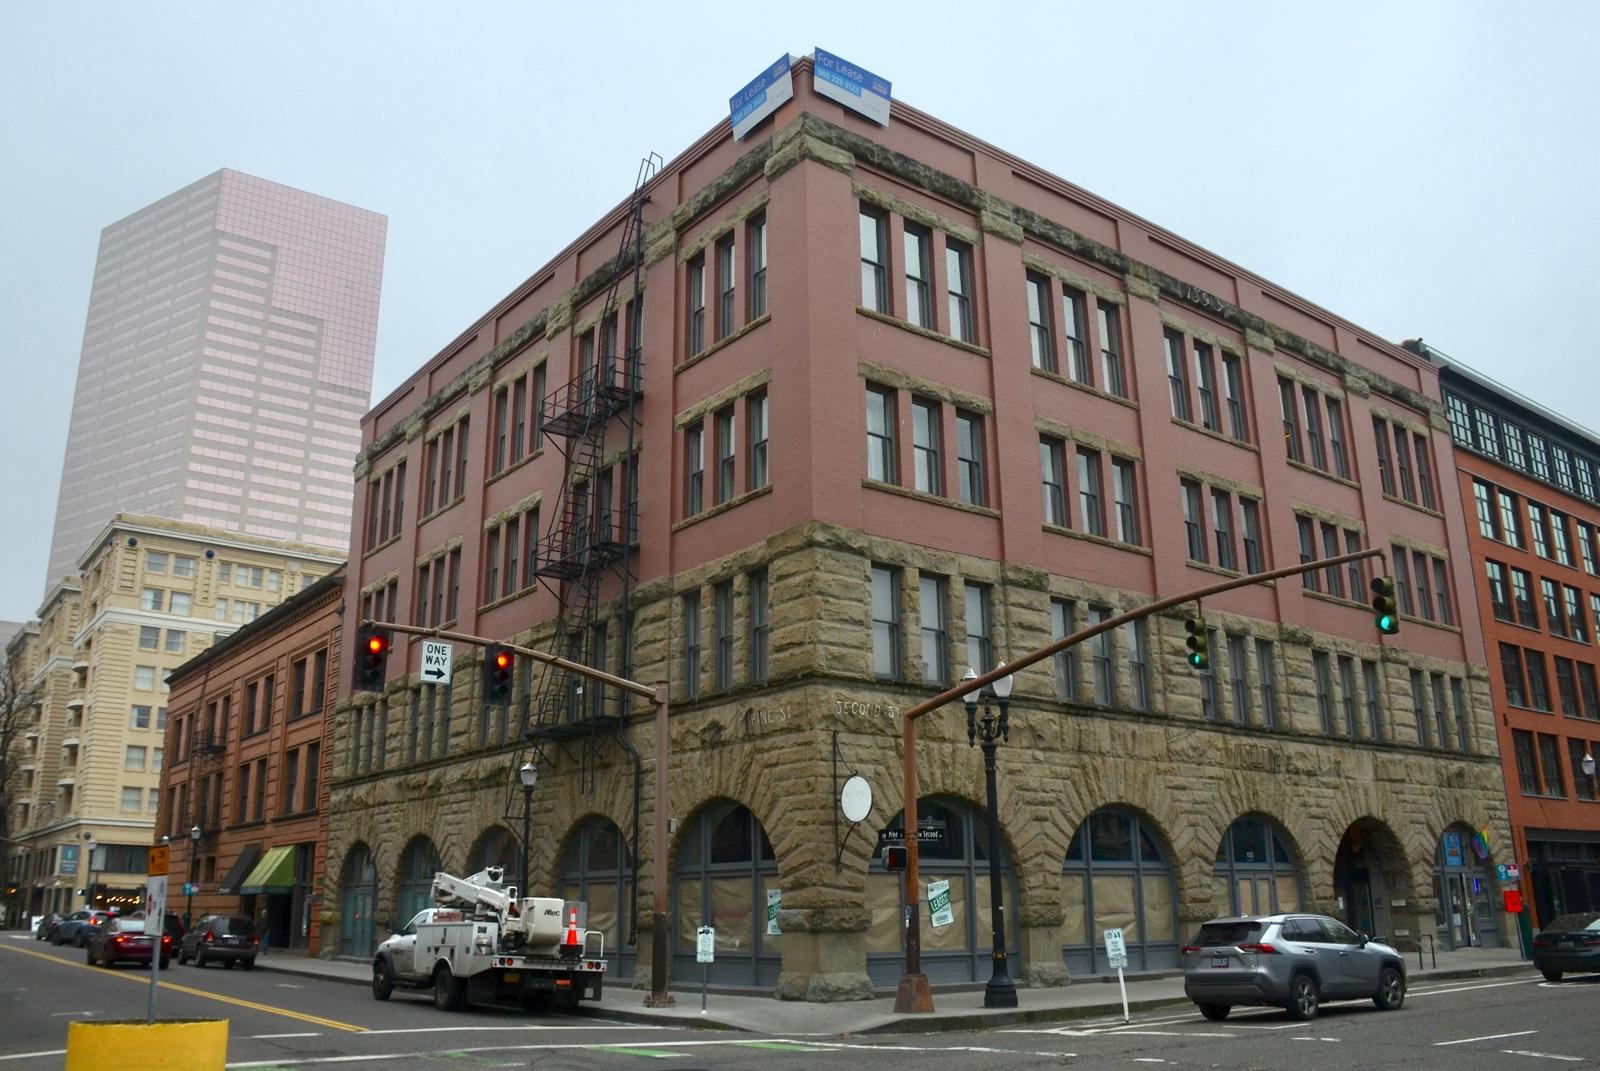
Above: four downtown blocks where the job records show more jobs in 2024 than in 2019. TriMet moved its offices into One Main Place, and the county courts moved into the new Central Courthouse.B5
What the employers said
These are the decisions we could document, with the employer’s or owner’s reason in its own words where one was given. Of the 33 events, 19 come with a stated reason. None of those names taxes. Several name remote and hybrid work, the cost of a lease or the condition of a building, and one building owner names unrest and crime. These are public statements, and they cover a minority of the jobs lost. Rows marked provisional rest on a secondhand source or on an inferred match between a block and an employer.B5 B6
- U.S. BankU.S. Bancorp Tower, 111 SW 5th Ave
Announced it would not renew most of its lease in the tower when it ends in 2025. A spokesperson said some employees would move to other downtown offices and several hundred would leave downtown, many of them for a building the bank owns in Gresham, with no job cuts.
“As part of our work to manage our real estate, we made the decision to not renew the lease for most of our space at U.S. Bancorp Tower.”
Job counts, detail and sources
LODES counts finance and insurance jobs at this block, from every employer on it, at 1,410 in 2019, 609 in 2023 and 222 in 2024. Most of that fall came before this announcement, and no source says whose jobs they were, so no figure is entered here.
Sources: Portland Tribune, U.S. Bank to leave iconic, pink Portland high-rise named after it
- The Standard (Standard Insurance Company)Standard Plaza, 1100 SW 6th AveProvisional
Sent more than 3,000 employees across the company home in March 2020. In December 2020 its chief executive said the company would not return to having nearly all staff in the office and did not plan to sell its buildings or sublet space.
“We will not go back to March 1, 2020, where we had virtually all employees in our office. I suspect we will endorse a hybrid program.”
Job counts, detail and sources
LODES counts finance and insurance jobs at this block at 1,695 in 2019 and 356 in 2024. That those are the company's staff now working elsewhere is inferred: the company owns the building, no layoff was found, and no other block in the region gained the jobs.
Sources: Oregon Business, Future of Work: 'I Would Like to Have the Option to Return to Downtown Portland'
- Liberty Mutual InsuranceLiberty Centre, 650 NE Holladay St
Told its Portland employees it would leave its more than 97,000 square feet in the building by the end of 2022 and move to a smaller office in Lake Oswego, with room for 150 employees who work partly from home. The company had 500 employees in the building before the pandemic, and 380 of its Portland office employees were working from home only by September 2022.
“Due to COVID and the ensuing transition of many employees to a permanent work-from-home or hybrid work arrangement, we are taking the opportunity to right-size our local footprint and relocate to a smaller space in Lake Oswego.”
Job counts, detail and sources
LODES counts finance and insurance jobs at this block at 573 in 2019 and 118 in 2024.
- NW NaturalOne Pacific Square, 220 NW 2nd Ave
Moved its headquarters from One Pacific Square, where its lease ended in 2020, to leased space in a new building at 250 SW Taylor St under a 20-year lease that began in March 2020. LODES counts utilities jobs at the old block at 596 in 2019 and 0 in 2020, and at the new block at 0 in 2019, 583 in 2020 and 765 in 2024.
“The selection is the lowest cost option for a 2020 lease that meets the company's criteria and allows for optimal emergency response and seismic readiness.”
- Multnomah County Circuit Court (Oregon Judicial Department)Old Multnomah County Courthouse, 1021 SW 4th Ave
Moved from the old courthouse to the new Central Courthouse at 1200 SW 1st Ave. The old building's last day was September 29, 2020 and the new one opened on October 5, 2020; both dates are from Wikipedia, which cites The Oregonian.
Job counts, detail and sources
LODES counts public administration jobs at the old block at 484 in 2019, 360 in 2022, 7 in 2023 and 1 in 2024, and at the new block at 0, 212, 629 and 639, so the records show most of the move two to three years late. A 2015 plan expected 395 judges and employees in the new building.
Sources: Wikipedia, Multnomah County Courthouse; Multnomah County, County board approves $28 million sale of Central Courthouse to NBP Capital; Multnomah County and Oregon Judicial Department, Multnomah County Central Courthouse, presentation to the Oregon Legislature
- TriMetHarrison Square, 1800 SW 1st Ave, and 1618 SW 1st Ave
Its board approved a lease of about 95,000 square feet at One Main Place, 101 SW Main St, in January 2022, and staff began working there in June 2023. The Harrison Square lease ran to June 2023.
“In addition to being a seismically safer and more up-to-date building that better meets TriMet's search criteria, the economic terms offered by One Main Place were far superior to those offered by Harrison Square.”
Job counts, detail and sources
The agency cut the space it needed from 120,000 to 95,000 square feet because of its telework policy. LODES counts administrative and support jobs at the Harrison Square block at 247 in 2019 and 0 in 2024, and at the One Main Place block at 0 and 407. The match of those jobs to TriMet rests on the counts of local government jobs at the two blocks.
Sources: TriMet Board of Directors, Resolution No. 22-01-02, authorizing a lease for administrative office space at 101 SW Main Street; Mass Transit magazine, TriMet moves to new headquarters in downtown Portland; TriMet Board of Directors, Resolution No. 24-09-53, authorizing an amendment to the lease at One Main Place
- KBS Growth & Income REIT (owner of the Commonwealth Building)Commonwealth Building, 421 SW 6th Ave; Hotel Lucia; Hotel Vintage
Reported that occupancy of the Commonwealth Building fell from 87% at the start of 2021 to 51% at the end of 2022. Occupancy is a share of leased space and says nothing about jobs, and the owner names no tenant and no place they went.
“Continued social unrest and increased crime in the downtown Portland area, along with employees continuing to work from home has resulted in many tenants leaving the downtown Portland area for suburban options”
Job counts, detail and sources
Sources: KBS Growth & Income REIT, Inc., Form 10-K for fiscal year 2022
- Unitus Community Credit UnionDowntown headquarters (the report gives no address)Provisional
Announced it would move its headquarters out of the city and split it among several locations, one in Tigard. LODES counts finance and insurance jobs at the block where Unitus Plaza stands by its coordinates at 199 in 2019, 273 in 2023 and 0 in 2024, and a Tigard block went from 0 to 338 finance jobs in 2024.
“This new operational model allows Unitus to create an activity-based working environment, where employees can work out of different types of spaces over the course of a day or week. This gives employees the ability to choose how they work best.”
Job counts, detail and sources
The match of those blocks to the credit union is inferred.
Sources: KPTV, More businesses announce they're leaving downtown Portland
- Lattice SemiconductorU.S. Bancorp Tower, 111 SW 5th AveProvisional
Left its Portland office in early 2019, sublet the space, and moved its headquarters to a building it already used in Hillsboro. The company's filing does not name the Portland building; the research places the office in this tower from 2015 press reports that were not saved, so the match is provisional.
“Under a previously approved restructuring plan, we fully vacated the space in Portland, Oregon in early 2019 and subleased the vacated space.”
Job counts, detail and sources
No count of Portland staff is given.
Sources: Lattice Semiconductor Corporation, Form 10-K for the fiscal year ended December 28, 2019
- City of PortlandPortland Building, 1120 SW 5th Ave, and other City offices
Required office employees to work at their desks at least 20 hours a week from April 1, 2023. Three hundred employees were exempted to work remotely full time.
“This approach provides maximum flexibility for in-person collaboration”
Job counts, detail and sources
Before the pandemic 2,950 city employees worked from downtown offices.
Sources: Willamette Week, 300 City Employees Won't Have to Return to the Office Next Month; Oregon Public Broadcasting, Portland Mayor Ted Wheeler wants to reduce remote work for city employees
The full list has 33 documented events. Get all 33 (CSV)
Where the 12,890 jobs lost on those fifteen blocks went, as far as the record shows
About 1,300 never left downtown: NW Natural, the county courts and TriMet moved within downtown, and the same kind of jobs appear at the new address.B5 One insurer left its block for a smaller office in Lake Oswego: the block lost 455 finance jobs, though the company said most of its staff were by then working from home. We found no job that moved out of the region. For 9,273 jobs, 72% of the total, we found no public record that names the employer or the destination.B6 Counted industry by industry, these blocks lost 12,890 jobs. That is more than their net change in the table above, because some industries grew on the same blocks.
Compared here: The fifteen census blocks within 1.25 miles of the center of downtown that lost the most jobs from 2019 to 2024.
Jobs lost on the fifteen largest losing blocks
12,890 jobs
- 9,273 no employer or destination identified71.9%
- 1,339 kept the building, staff work elsewhere (inferred)10.4%
- 1,326 moved to another address inside downtown10.3%
- 497 shrank or closed3.9%
- 455 moved to a suburb3.5%
Which jobs, and when
Restaurant, hotel and shop jobs fell in 2020. Downtown office jobs fell in 2021, 2022 and 2024.
Two kinds of work account for most of the loss downtown, and they did not fall at the same time. The order matters, because each explanation for the decline predicts a different one.
Jobs within 0.75 miles of the center of downtown, by kind of work
Office-type work is information, finance, real estate, professional services and company management. It lost the most jobs. Restaurants, hotels and shops lost the largest share, 27%. Government jobs rose.P12
Compared here: Downtown Portland only: every census block within 0.75 miles of the center. 2019 against 2024.
Jobs gained or lost, 2019 to 2024
Office jobs fell downtown and grew beyond 2 miles
Both lines are inside the City of Portland, where the same City business taxes apply. Downtown lost 16.6% of its office jobs. The parts of the city more than 2 miles out gained 6,382, a rise of 21.8%.P9 B8 The two largest pieces of that gain are a hospital system’s office park and a truck maker’s headquarters. Neither is an office that left downtown. Without its three largest blocks the outer gain is 15.3%.B8
Compared here: Two parts of the City of Portland: within 0.75 miles of the center of downtown, and more than 2 miles from it. Office-type jobs only.
- Downtown
- Portland beyond 2 miles
Multnomah County lost 11.8% of its office jobs, the most of ten comparison counties. Minneapolis–St. Paul’s central counties lost 8.2% and Denver’s gained.
On this broad measure, which includes temporary help and call centers, office-type jobs fell 10.5% in Multnomah County from 2019 to 2025 and by the same share in Minneapolis–St. Paul’s central counties. On the narrower measure used for downtown, Multnomah County’s fell 11.8%, the most of ten comparison counties, and Minneapolis–St. Paul’s fell 8.2%. In Denver’s central county they rose about 16% on the broad measure and about 21% on the narrower one. Most of Multnomah County’s loss came after 2022.S2 Downtown itself lost its office jobs earlier: 33% of the downtown loss came after 2022. This county measure is also broader than the downtown one, because it includes administrative and support services. On the narrower measure, 61% to 72% of the county’s loss came after 2022.B7
Compared here: Multnomah County against Denver County and against Hennepin and Ramsey counties together. Seattle’s county is left out because about 50,000 of its jobs were moved into this group in 2022, which breaks the comparison.
- Multnomah County
- Denver County
- Hennepin and Ramsey
Portland fell behind its suburbs first in restaurant and shop jobs, then in office jobs, then in the number of businesses
Each line divides Portland’s count by the count in Washington and Clackamas counties, with 2019 set to 100. A falling line means Portland is losing ground to its suburbs. Consumer-facing jobs dropped at once in 2020. Office jobs slipped every year from 2021. The number of business establishments slipped in 2021 and fell faster in 2022.S3
Compared here: The City of Portland divided by Washington and Clackamas counties together, for three measures. Job counts end in 2024 and business counts in 2023.
- Consumer-facing jobs
- Office-type jobs
- Business establishments
Which industries
Multnomah County lost jobs in most kinds of work. In 12 of 26 industries it did worse than all nine comparison counties.
Downtown lost the most jobs in hotels and restaurants, in finance and insurance, and in professional services. Across Multnomah County, 16 of the 26 industries compared here had fewer jobs in 2025 than in 2019. The county holds 42% of the Portland area’s private jobs, and the rest of the area gained jobs.J2 J4 J7
Downtown jobs by industry: the change from 2019 to 2024
From 2010 to 2019 downtown added 18,361 jobs, and 39% of that gain was in professional and technical services, the group that holds law, engineering, accounting and consulting firms along with custom software.J1 Since 2019 hotels and restaurants have lost 3,673 jobs, finance and insurance 3,301 and professional and technical services 2,919. About 2,500 of the finance and insurance jobs were on two blocks. The two groups that include software firms, information and professional services, are 24% of the loss. No industry added more than about 400 jobs.J2
Compared here: Downtown Portland only: every census block within 0.75 miles of the center. 2019 against 2024, with the 2010 to 2019 change in each note.
Jobs gained or lost, 2019 to 2024
Some of this happened in similar downtowns too. Hotel and restaurant jobs fell 32% in downtown Portland, 24% in downtown Seattle, 18% in Denver and 12% in Minneapolis. Shop jobs fell in downtown Seattle and Denver, and head-office jobs fell in all three. Professional and technical services did not: those jobs fell 13% in downtown Portland and were flat in downtown Seattle and Minneapolis. Information jobs rose in five of the nine comparison downtowns and fell in four.J3
Portland did not start with a worse mix of industries. If each industry downtown had changed at the rate it did in downtown Seattle, Portland would have lost between zero and about 3,000 jobs. At downtown Minneapolis rates it would have lost 3,000 to 7,500. It lost 16,439.J3
Jobs by detailed industry in ten central counties, 2019 to 2025
County payroll records divide work much more finely than the downtown files. Multnomah County had the largest fall, or the smallest gain, of the ten in 12 of 26 industries, and it was below the middle of the other nine in 24. Three industries are 62% of the county’s net loss of private jobs: manufacturing (7,410 jobs), restaurants and bars (6,294) and retail (5,817). In retail, wholesale and doctors’ offices the gap to the next county is about 1 percentage point. From 2015 to 2019 the county was last in 2 of the 26 and below the middle in 17.J4
Compared here: Multnomah County against the central counties of the nine comparison metros. Percent change in jobs from 2019 to 2025. Private employers, except the government row.
| Industry | Portland | Jobs | Seattle | Denver | Minneapolis-St. Paul | Columbus | San Diego | Phoenix | Salt Lake City | Austin | Raleigh | Middle of 3 most similar | Middle of all 9 | Rank |
|---|---|---|---|---|---|---|---|---|---|---|---|---|---|---|
| Totals | ||||||||||||||
| All jobs | −4.9% | −25,695 | +0.2% | +6.0% | −1.7% | +3.4% | +3.1% | +11.0% | +12.2% | +19.9% | +15.7% | +0.2% | +6.0% | 1 of 10 |
| All private jobs | −7.0% | −31,408 | −0.4% | +5.8% | −2.7% | +2.7% | +2.9% | +11.8% | +12.0% | +21.9% | +16.8% | −0.4% | +5.8% | 1 of 10 |
| Software and computing | ||||||||||||||
| Software publishers | +1.4% | +67 | −4.6% | +85.9% | −3.3% | +35.9% | −13.0% | +124.5% | +64.8% | +91.5% | +38.1% | −3.3% | +38.1% | 4 of 10 |
| Computer systems design and custom software | −19.7% | −1,368 | +9.8% | +43.3% | −12.8% | −12.2% | −12.2% | −3.1% | +15.9% | +43.2% | +14.6% | +9.8% | +9.8% | 1 of 10 |
| Computer and electronics factories | −1.4% | −31 | −13.3% | n/a | −5.0% | −19.2% | −4.4% | +0.4% | +5.0% | +13.1% | n/a | −9.2% | −4.4% | 5 of 8 |
| Professional services | ||||||||||||||
| Law firms | +1.4% | +81 | +5.5% | +9.6% | −2.7% | +1.9% | +10.2% | +21.9% | +21.5% | +13.2% | +25.1% | +5.5% | +10.2% | 2 of 10 |
| Accounting | +15.6% | +566 | +23.0% | +23.9% | +1.9% | −2.5% | +2.7% | −3.4% | +24.2% | +66.7% | +24.6% | +23.0% | +23.0% | 5 of 10 |
| Architecture and engineering | −5.0% | −406 | +12.5% | +29.7% | +8.7% | +17.6% | +9.2% | +31.2% | +34.8% | +47.6% | +28.7% | +12.5% | +28.7% | 1 of 10 |
| Management and technical consulting | +16.6% | +1,052 | +0.9% | +51.5% | −3.4% | +34.7% | +5.8% | +3.8% | +46.4% | +21.8% | +30.0% | +0.9% | +21.8% | 5 of 10 |
| Advertising and public relations | −19.5% | −596 | −10.5% | +24.6% | −15.4% | +23.4% | −10.7% | −0.8% | +16.6% | +8.7% | +18.2% | −10.5% | +8.7% | 1 of 10 |
| Scientific research labs | +18.3% | +227 | +43.8% | +58.0% | +15.4% | +12.6% | +4.2% | +36.6% | +47.1% | +44.5% | +17.7% | +43.8% | +36.6% | 5 of 10 |
| Finance | ||||||||||||||
| Banks and lenders | −31.5% | −2,335 | −12.5% | +6.6% | −28.1% | −5.7% | −23.6% | −7.1% | −4.5% | +14.4% | +32.0% | −12.5% | −5.7% | 1 of 10 |
| Insurance | −21.1% | −2,039 | −9.4% | +25.5% | −1.3% | −29.8% | −13.4% | +3.8% | +6.1% | −4.1% | +19.8% | −1.3% | −1.3% | 2 of 10 |
| Securities and investment firms | −16.0% | −387 | +4.2% | −8.1% | −0.2% | +7.4% | +9.5% | +1.2% | +50.1% | +40.9% | +48.1% | −0.2% | +7.4% | 1 of 10 |
| Head offices and staffing | ||||||||||||||
| Company head offices | −19.2% | −3,693 | n/a | +8.0% | −9.3% | +1.9% | −8.3% | +32.1% | +8.8% | n/a | −11.8% | −0.7% | +1.9% | 1 of 8 |
| Temporary help and staffing | −19.1% | −2,007 | −17.3% | −21.0% | −27.8% | +0.1% | +8.3% | −10.4% | −6.5% | +38.6% | +23.4% | −21.0% | −6.5% | 3 of 10 |
| Making, building and moving goods | ||||||||||||||
| All manufacturing | −20.8% | −7,410 | −13.6% | −15.6% | −2.7% | −1.9% | −4.6% | +8.3% | +8.5% | n/a | −9.3% | −13.6% | −3.6% | 1 of 9 |
| Construction | −6.6% | −1,687 | −8.6% | −6.5% | +11.4% | +35.3% | +5.8% | +30.3% | +31.3% | +28.9% | +28.2% | −6.5% | +28.2% | 2 of 10 |
| Wholesale | −11.0% | −2,573 | −9.6% | −4.9% | −0.8% | −9.6% | −7.9% | +20.9% | +19.4% | −4.1% | +9.0% | −4.9% | −4.1% | 1 of 10 |
| Transportation and warehousing | +12.8% | +3,640 | +16.8% | +23.8% | n/a | +5.4% | +24.2% | +35.9% | +17.5% | +42.9% | +79.7% | +20.3% | +24.0% | 2 of 9 |
| Shops, restaurants, hotels and the arts | ||||||||||||||
| Retail | −13.6% | −5,817 | n/a | −3.6% | −12.7% | +1.6% | −7.3% | +5.3% | −4.4% | +6.6% | +4.0% | −8.2% | −1.0% | 1 of 9 |
| Restaurants and bars | −14.1% | −6,294 | −6.4% | −5.5% | −7.3% | −0.1% | +0.4% | +12.0% | +9.3% | −1.4% | +7.8% | −6.4% | −0.1% | 1 of 10 |
| Hotels | −19.6% | −1,271 | −11.5% | −3.7% | −11.8% | −10.4% | −3.5% | +4.2% | −1.9% | +6.6% | −3.7% | −11.5% | −3.7% | 1 of 10 |
| Arts, entertainment and recreation | +4.2% | +339 | +3.7% | +12.5% | +3.5% | +7.6% | +2.1% | +26.4% | +30.8% | +34.6% | +14.1% | +3.7% | +12.5% | 4 of 10 |
| Health and education | ||||||||||||||
| Private hospitals | +1.6% | +239 | −2.4% | +10.3% | −0.7% | −5.7% | +38.9% | +19.2% | +7.0% | +18.6% | +40.3% | −0.7% | +10.3% | 4 of 10 |
| Doctors, clinics and outpatient care | +3.3% | +766 | +4.5% | +6.5% | +5.5% | +19.8% | +21.1% | +32.0% | +29.5% | +52.7% | +33.9% | +5.5% | +21.1% | 1 of 10 |
| Private colleges and universities | −30.9% | −1,553 | −5.6% | −15.6% | −15.7% | +1.7% | −42.3% | +33.7% | −0.6% | +4.4% | −5.0% | −15.6% | −5.0% | 2 of 10 |
| Government | ||||||||||||||
| Government, all levels | +7.8% | +5,713 | +4.9% | +7.4% | +5.9% | +7.0% | +4.5% | +4.0% | +13.5% | +9.6% | +9.1% | +5.9% | +7.0% | 7 of 10 |
Six industries year by year, with 2019 set to 100
The industries did not fall together. Jobs at banks and lenders and at company head offices started down in 2020 and 2021. Computer systems design held its 2019 level through 2022 and then lost 20% in three years. Private colleges lost 16% of their jobs in 2020 and have not recovered them.J6 Hover or tap for a year.
Compared here: Multnomah County in orange, the middle of Seattle, Denver and Minneapolis–St. Paul’s central counties in blue, and the middle of all nine in gray.
Computer systems design and custom software
In 2025 Multnomah County was 19.7% below its 2019 level, the three most similar 9.8% above and all nine 9.8% above.
- Multnomah County
- Three most similar
- All nine
Software publishers
In 2025 Multnomah County was 1.4% above its 2019 level, the three most similar 3.3% below and all nine 38.1% above.
- Multnomah County
- Three most similar
- All nine
Banks and lenders
In 2025 Multnomah County was 31.5% below its 2019 level, the three most similar 12.5% below and all nine 5.7% below.
- Multnomah County
- Three most similar
- All nine
Company head offices
In 2025 Multnomah County was 19.2% below its 2019 level, the three most similar 0.6% below and all nine 1.9% above.
- Multnomah County
- Three most similar
- All nine
Architecture and engineering
In 2025 Multnomah County was 5.0% below its 2019 level, the three most similar 12.5% above and all nine 28.7% above.
- Multnomah County
- Three most similar
- All nine
Private colleges and universities
In 2025 Multnomah County was 30.9% below its 2019 level, the three most similar 15.6% below and all nine 5.0% below.
- Multnomah County
- Three most similar
- All nine
Software is split between two of these industries, and they moved differently. Firms that design computer systems and write custom software cut 19.7% of their jobs in Multnomah County, the largest fall of the ten, while the same industry grew 43% in the central counties of Denver and Austin. Software publishers held about level here, up 1.4%. Together the two lost 1,301 jobs, or 11.2%, close to the falls in San Diego County (12.3%) and in Hennepin and Ramsey counties (10.9%). Since 2022 the two together have fallen in eight of the ten counties.J5
Multnomah County is 42% of the Portland area’s private jobs, a smaller share than most of the comparison counties hold of theirs. Counting all seven counties of the area, private jobs fell 0.8% from 2019 to 2025, still the weakest of the ten areas, and jobs outside Multnomah County rose 3.8%. At that wider level the Portland area ranks last in about 4 of the 26 industries. Securities firms, architecture and engineering firms and doctors’ offices all did better in Washington, Clackamas and Clark counties than in Multnomah. Head offices and banks lost jobs in both.J7
These records count jobs by the employer’s industry at the address the employer reports. They do not show what work each person does, where workers live, or whether a job that disappeared here moved, ended or went remote.J4
The history
Multnomah County’s share of the region’s jobs has been falling since at least 1969
Part of what happened after 2019 is the newest stretch of a very old trend, and part of it is new. Federal job counts from 1969 to 2022 separate the two.
Each central county’s share of the jobs in its region, 1969 to 2022
In 1969 Multnomah County had 70.2% of the jobs in the four-county Portland region. By 2022 it had 41.9%. Denver’s and Minneapolis–St. Paul’s central counties lost share the same way.P6 The long decline is not special to Portland.
Compared here: Multnomah County as a share of Multnomah, Washington, Clackamas and Clark counties; Denver County as a share of its seven-county region; Hennepin and Ramsey counties as a share of the seven-county Twin Cities region.
- Multnomah County
- Denver County
- Hennepin and Ramsey
In most downturns since 1981, Multnomah County lost jobs while the rest of the region gained or lost fewer
These are the years from 1981 to 2022 in which Multnomah County lost jobs, except 2001, which cannot be compared with 2000. In 1981 to 1983, 1991, 1999, 2002 to 2003 and 2020, the rest of the region grew or lost less. The exceptions are 2009 and 2010, when the suburbs lost slightly more.P7
Compared here: Multnomah County against Washington, Clackamas and Clark counties together. Change in jobs from the year before.
- How is this decline different from the 1980s?
- The declines of 1979 to 1987 and 1997 to 2003 were falls in income across the whole region, heaviest in Washington County. This one is not. Since 2019, income per person in Multnomah County has risen slightly against the national average. What the county lost is jobs and residents.P8 P3 S6
- Why was downtown so exposed?
- Partly because the city planned it that way. The 1972 Downtown Plan and the 1988 Central City Plan concentrated the region’s office space downtown. By 2012 downtown held 49% of the region’s multi-tenant office space, against an average of 27% in the cities the same report compared it with. That is a likely reason the loss landed downtown, though other cities planned their downtowns the same way and lost less.S4
- When did the recent slide start?
- About 2013 to 2015. The center held its share from 2008 to 2014, then began losing it again, before the pandemic and before the taxes and housing rules of 2016 to 2019.S1 The idea that the taxes of 2018 to 2020 started the slide is not shown: the county’s share was already falling every year from 2015.N9 Why it began then is not known.K4
- How much of today’s job loss is the earlier slide continuing?
- By one method, 27% of the job loss in Multnomah County that growth in the rest of the region does not explain.L5 A second method, which assumes the earlier pace against comparison counties would have continued, gives 46% of today’s gap.F12

Who left, who came
People left Portland at about the same rate as similar cities. The people who left earned more than usual, and arrivals did not rise.
A common belief is that residents fled. Federal tax records, which follow households from one county to another, show departures rising about as much as in similar counties. The differences are in who left and in how few people arrived.
Households leaving for another state
Over the three years after 2020, departures from Multnomah County rose 16.1%, against 16.5% in comparable counties. The answer depends on the years: in 2021 and 2022 they rose faster here.P10
- Multnomah County
- Typical of the nine
Households arriving from another state
Arrivals in Multnomah County stayed flat. In comparable counties they rose 9.5%.P10
- Multnomah County
- Typical of the nine
Compared here: Multnomah County against the middle of the nine comparison cities’ central counties. Years are the second year of each pair of tax years, so 2022 means moves between 2021 and 2022. Source: IRS Statistics of Income, county migration data.Get the data (CSV)
After 2020, the households leaving Multnomah County were better off than the ones who usually leave
A household that moves away usually earns less than a household that stays. In the typical comparison county a leaving household earned 68% to 78% of what a staying household earned in each year shown. In Multnomah County that figure was about 81% before 2020 and about 98% after, the largest rise of the ten counties.P10 The higher the line, the better off the people leaving. At 100% they earn the same as the people staying.
Compared here: Multnomah County against the middle of the nine comparison cities’ central counties.
- Multnomah County
- Typical of the nine
Multnomah County’s population fell behind similar counties mostly because fewer people arrived from abroad and births were fewer
From 2020 to 2025 Multnomah County lost about 25 residents for every 1,000. Seattle’s and Denver’s central counties each gained about 32, and Minneapolis–St. Paul’s lost about 3. Against the middle of the three, 58% of the gap is lower immigration from abroad, 35% is fewer births relative to deaths, and 7% is people moving to other parts of the country. Immigration is the largest part against Seattle. Against Denver and Minneapolis–St. Paul, births less deaths is as large or larger.S6
Compared here: Multnomah County against the middle of King County (Seattle), Denver County, and Hennepin and Ramsey counties (Minneapolis–St. Paul). Change from July 2020 to July 2025 for every 1,000 residents.
Multnomah County’s gap to the three, per 1,000 residents
- Was it the cost of housing?
- Not shown for the years after 2020. Multnomah County lost residents to the rest of the country at about the same rate as the central counties of Seattle and Minneapolis–St. Paul, though faster than Denver’s.N5 S6
- Was it Portland’s reputation?
- Not shown as something separate from conditions on the ground. Arrivals from other states stalled just as much in Washington and Clackamas counties and in Minneapolis’s county.N6
- Are people moving to Clark County, Washington?
- People with high incomes have been moving there for years, from the Oregon suburbs as much as from Portland. From 2019 to 2023 Clark County gained high-income tax filers against both at similar rates.S8
Three explanations
Each of the three explanations has evidence for it and evidence against it
Three things could each produce a loss concentrated in the center of one city. Offices emptied in March 2020, police response slowed from June 2020, and the county income tax took effect in January 2021. Because these fell within ten months of each other, comparisons across years cannot fully separate them. The next three sections give the evidence on each.F4 F17 F23
An office-heavy downtown
The idea. Downtown was built around office work. When office workers stopped coming in every day, their jobs left downtown, and so did the jobs that depended on them.
LikelyThe cause the evidence points to most: it accounts for 20% to 76% of the jobs downtown lost.
What fits
- Downtown held 49% of the region’s multi-tenant office space. The average in comparison cities was 27%.S4
- 80% of the city’s job loss was within 0.75 miles of the center of downtown.P2
- The number of people working on site in Portland fell 20.0%.L2
- Employers on the largest losing blocks said in their own words that remote and hybrid work is permanent.B6
What does not fit
- Other downtowns have remote work too and lost far fewer office jobs: about 3% in downtown Minneapolis and about 7% in downtown San Diego, the two of nine with usable block counts, against 16.6% in downtown Portland.A1
- Downtown restaurants, hotels and shops lost 27.0% of their jobs. Offices lost 16.6%.P12
- Across large central counties, neither the share of office jobs nor the share of people working from home predicts which ones lost jobs.L2
Police response and street conditions
The idea. After 2020 downtown became less safe and less cared for, so customers, visitors and employers stayed away.
LikelySecond of the three, and the evidence cannot size it: between 0% and 67% of the jobs downtown lost.
What fits
- Restaurant and hotel jobs fell 12.2% in Multnomah County, the worst record of 49 large central counties.L3
- Police took 7.5 minutes to reach the most urgent calls in May 2020 and 16.4 minutes that August.F4 The yearly average rose 135% from 2019 to 2025.F23
- The owner of one downtown office building told investors that unrest, crime and employees working from home had led many tenants to leave for the suburbs. The statement is quoted in section 04.
What does not fit
Taxes
The idea. New local taxes on businesses and high earners made Portland a more expensive place to run a company or to live, so companies and people left.
Not shownLast of the three: 0% to 18% of the jobs downtown lost. No test finds an effect, and none rules one out.
What fits
- Four new or higher local taxes were adopted from 2018 to 2020.F17
- After 2020, households leaving Multnomah County earned as much as those staying. That happened in no comparison county.F18
- By one measure, up to 48% of the income the county lost to moves left beyond what left the neighboring counties.F19
- 62% of the office jobs downtown lost were lost after April 2021, when the county and Metro income taxes were in force.A5
What does not fit
- Office jobs grew 21.8% in the parts of Portland more than 2 miles from downtown, where the same City taxes apply. That matches the outer parts of Seattle (22.0%) and Minneapolis (21.0%).P9
- Nothing changed in the job counts when the City’s taxes rose in 2018 and 2019.N1
- The Oregon suburbs pay the Metro income tax too, and no effect is shown in the income of their top earners.N2
- Counts of tax filers with income of $200,000 or more do not settle it. By 2023 Portland had about 830 fewer of them than it would have had at the growth rate of its Oregon suburbs since 2019, and 7,728 fewer than at Clark County’s rate. It also had 8,425 fewer than at the rate of east Multnomah County, which pays the same taxes.L4
Across all of Multnomah County the loss is broader than downtown, and the ranges are as wide
Multnomah County lost 25,695 jobs from 2019 to 2025. The county’s loss is broad. Factories, retail and wholesale lost 15,800 jobs, equal to 61% of the net loss, and Multnomah had the largest fall of ten comparison counties in manufacturing, wholesale, banking and insurance, office work, and restaurants and hotels alike. Why the county lost 20.8% of its factory jobs is not established. None of the explanations for downtown reaches those jobs.M8
Compared here: Multnomah County, all jobs, 2019 to 2025, tested against nine comparison counties and 48 large metro areas. The bars overlap and cannot be added.
- 1Remote and hybrid work12% to 64%of the county loss
For the county too the evidence points most to remote and hybrid work, with a wide range: at least 12% and at most 64% of the 25,695 jobs Multnomah County lost from 2019 to 2025. Office jobs fell by 12,104, which is 47% of the county’s net loss, and 66% of that fall came in 2024 and 2025, when seven of nine comparison counties were losing office jobs too. Multnomah’s 11.8% fall was the largest of the ten. Hennepin and Ramsey counties, the nearest case, lost 8.2%.M1
What decides it, and the strongest evidence against
- Office jobs (information, finance, real estate, professional services and company management) fell by 12,104 in Multnomah County, 11.8%, the largest fall of ten comparison counties. That is 47% of the county’s net loss. Hennepin and Ramsey counties lost 8.2%; six of the nine gained.
- 66% of the county’s office loss came in 2024 and 2025. Seven of nine comparison counties also lost office jobs from 2023 to 2024.
Against. The county’s loss is as bad outside offices: Multnomah also had the largest falls of ten in manufacturing (20.8%), wholesale (11.0%) and restaurant, hotel and entertainment jobs (12.2%). Factories, wholesalers and builders lost 11,670 jobs that remote work does not reach. Across 48 large central counties a larger office share does not go with a larger job loss.
- 2The slide that began before 20204% to 54%of the county loss
Dark band: two methods give 15% and 25% to 31% of the county loss.
Part of the county’s loss continues a slide that began before 2020. From 2015 to 2019 Multnomah County’s jobs grew 8.3% while the rest of the region’s grew 11.4%. If that gap had continued, it would account for 15% to 31% of the 25,695 jobs lost; the full range of the estimates is 4% to 54%. This describes a trend that was already under way, with no cause identified, and 14 of 48 large central counties were falling behind their suburbs faster.M2
What decides it, and the strongest evidence against
- From 2015 to 2019 Multnomah County’s jobs grew 8.3% and the rest of the region’s grew 11.4%. Six more years of that yearly gap, with the rest of the region growing 3.9% as it did, would leave the county down 0.7%, which is 3,747 jobs, 15% of the loss.
- Across 48 large metros, central counties that lagged their suburbs from 2015 to 2019 kept lagging afterward. That pattern predicts 25% to 31% of Multnomah’s loss, with margins of error from 4% to 54%.
Against. Multnomah’s earlier gap was not unusual: 14 of 48 central counties lagged their suburbs by more. After allowing for its region’s growth, Multnomah’s shortfall is still the second largest of 48. The trend does not say what caused it.
- 3Safety, police response and street conditions0% to 63%of the county loss
Hatched band: not an estimate for this cause. Restaurant, hotel and entertainment jobs fell by 3,100 to 4,600 more than the comparisons predict, which is 12% to 18% of the county loss, and street conditions are one of several explanations.
For the county, safety and street conditions cannot be sized: the range is 0% to 63%. What is measured is that restaurant, hotel and entertainment jobs fell 12.2% in Multnomah County, the most of ten comparison counties and about twice the 5.7% fall in Hennepin and Ramsey counties. The extra loss is 3,100 to 4,600 jobs, 12% to 18% of the county total. The records do not say how much of that is street conditions and how much is fewer office workers, visitors and residents.M3
What decides it, and the strongest evidence against
- Restaurant, hotel and entertainment jobs fell 12.2% in Multnomah County (7,226 jobs), the largest fall of ten comparison counties. Hennepin and Ramsey counties lost 5.7%, King County 5.0% and Denver 2.3%.
- The fall beyond what the region’s growth, population change and comparison counties would predict is 3,100 to 4,600 jobs, 12% to 18% of the county loss.
Against. The 3,100 to 4,600 is what is left after other things are allowed for. Street conditions themselves were not measured. Fewer office workers, visitors and residents would produce the same shortfall. Nothing ties the office, factory or wholesale losses to safety.
- 4Local taxes0% to 30%of the county loss
Local taxes account for between 0% and 30% of the county’s job loss. No job count breaks at a tax date. The office loss did come late, 66% of it in 2024 and 2025, which is when leases signed before the 2021 income taxes would run out, but Hennepin and Ramsey counties, which have no local income tax, lost office jobs in those two years as well: 4.7% against 8.1% in Multnomah. The part of that late fall specific to Portland is 3,300 to 5,400 jobs, 13% to 21% of the county loss, and taxes share it with every other local cause.M4
What decides it, and the strongest evidence against
- If the whole gap between Portland and its Oregon suburbs in the number of office businesses (4.8 points from 2019 to 2023, or 5.8 allowing for the earlier trend) were a tax effect, it would be 5,121 to 6,243 office jobs. Adding at most 1,500 jobs from the spending of households that left gives a ceiling of 26% to 30% of the county loss.
- Office jobs fell 8.1% in Multnomah County from 2023 to 2025. They fell 4.7% in Hennepin and Ramsey counties, which have no local income tax, and 2.6% at the median of nine comparison counties. Multnomah’s extra fall is 3,300 to 5,400 jobs, 13% to 21% of the county loss.
Against. For a larger effect: the office loss came late, when leases signed before the 2021 income taxes would run out, and Multnomah’s late fall was the largest of ten. For a smaller effect: no job series breaks at a tax date, office work in Portland away from downtown outgrew the suburbs, and Hennepin and Ramsey counties, with no local income tax, lost office jobs in the same two years.
- 5A slow region0% to 26%of the county loss
A slow region explains little: between 0% and 26% of the county’s loss. Portland’s suburbs grew 3.9% from 2019 to 2025, a little less than suburbs elsewhere. A central county with suburbs growing that fast would normally have gained jobs. Multnomah’s shortfall against that expectation is the second largest of 48 large metros.M5
What decides it, and the strongest evidence against
- Across 48 large metros a central county gains 0.52% for each 1% its suburbs grow. Portland’s suburbs grew 3.9% from 2019 to 2025, which is 0.6 points less than the suburbs of Seattle, Denver and Minneapolis-St. Paul and 2.0 points less than the middle of the 48. That gap is worth 1,200 to 6,700 county jobs, 5% to 26% of the loss.
Against. The link may run the other way, from a weak center to a weak region. Given its region’s growth, Multnomah County should have gained about 4,600 jobs; it lost 25,695, the second largest shortfall of 48.
- 6Fewer residents0% to 12%of the county loss
Fewer residents account for at most 12% of the county’s loss. That ceiling assumes shop and restaurant jobs fall 1% for each 1% of residents lost, which the records are too imprecise to confirm.M6
What decides it, and the strongest evidence against
- The county lost 2.6% of its residents from 2020 to 2025. If shop, restaurant and personal-service jobs fell 1% for each 1% of residents lost, that would be 3,179 of 124,342 such jobs, 12% of the county loss.
Against. The 1% for 1% response is an assumption; the measured response is too imprecise to tell from zero.
Explanation one: remote work and an office downtown
Downtown depended on office workers, and that hurt it. It did not have too few residents.
Remote work is the explanation the evidence points to most. A common complaint goes further and says downtown relied on office workers because the city never built enough housing there. The records support the part about office work and do not support the part about housing.A1 F49 F50
Downtowns with more office jobs got fewer of their visitors back
Each dot is one downtown. Left to right is the share of its jobs that are office jobs. Up and down is how many visitors it had in spring 2023 compared with 2019. The dashed line is the trend. Portland sits below the line, and so do Seattle, Columbus, Minneapolis and Raleigh, by more.F49
Compared here: 54 American downtowns, each defined the same way: everything within 1.25 miles of the densest cluster of jobs. The nine comparison cities are labeled.
Downtown Portland has about as many residents per job as comparable downtowns
Residents for every 100 jobs, at three distances from the center. Portland has far more close in, about the same at 1.25 miles, and somewhat fewer at 2 miles.F50
Compared here: Portland against the middle of the nine comparison downtowns, at each distance.
Within 0.75 miles of the center
Within 1.25 miles of the center
Within 2 miles of the center
- What does office work not explain?
- Weekends lagged too, and few office workers come in on weekends anyway. In spring 2023, the last time downtowns were compared against 2019, weekend visits to downtown Portland were at 71% of their 2019 level, against 79% in the typical comparable downtown. Weekends have since recovered further by the downtown district’s own count: Downtown Portland Clean & Safe reports Saturday visits in 2025 at 88.6% of their 2019 number. That count has no comparison with other cities.F49U4
- How empty are downtown offices now?
- Office vacancy downtown is now 28% to 39%, depending on which broker’s building list and definition is used, up from about 12% at the end of 2019. Kidder Mathews counts 27.8% of downtown office space vacant and offered by the landlord in the third quarter of 2026 (29.6% with sublease space), Cushman & Wakefield 35.2% in the downtown core, and CBRE 38.8%, a figure we took from the Portland Metro Chamber’s November 12, 2026 presentation to the City Council and did not check against CBRE’s own report.U11 On one broker’s measure, downtown Portland is not the emptiest of the comparison downtowns for which it publishes a figure. Cushman & Wakefield counted 37.5% of office space vacant in downtown Seattle and 37.1% in downtown Denver in the third quarter of 2026, against 35.2% in Portland’s downtown core and 32.6% in its wider central district, which adds the Lloyd District and the close-in east side. It counted 33.3% in downtown Austin, 32.8% in downtown Minneapolis and 22.7% in downtown Salt Lake City. The broker draws each downtown differently and publishes no downtown figure for Columbus, San Diego, Phoenix or Raleigh.U12
- Has downtown recovered?
- It has been recovering, but no measure that compares downtowns against 2019 has been published since spring 2023. The University of Toronto has since published a second series, from a different phone data provider, that compares each fall with the fall before. It shows more phone activity in downtown Portland in fall 2025 than in fall 2023, and a larger rise than in the typical comparable downtown. The size of Portland’s rise depends on how missing days are handled, from 18% to 58%, so we do not turn it into a level against 2019. Downtown Portland Clean & Safe, which buys its own phone counts, reports about 32 million visits to its 273-block district in 2025, 5.5% more than in 2024, with Saturday visits at 88.6% of their 2019 number.U1 By the downtown district’s count, monthly visits by visitors and office workers together reached 3 million in summer 2026 for the first time since 2019, when the summer peak was 3.8 million. Office workers have stayed near 350,000 a month since 2022, 43% of the 819,000 of October 2019 (Downtown Portland Clean & Safe figures, reported by Willamette Week).U5
Explanation two: police and street conditions
Police response slowed in June 2020 and violence rose. How much the police cuts caused is uncertain.
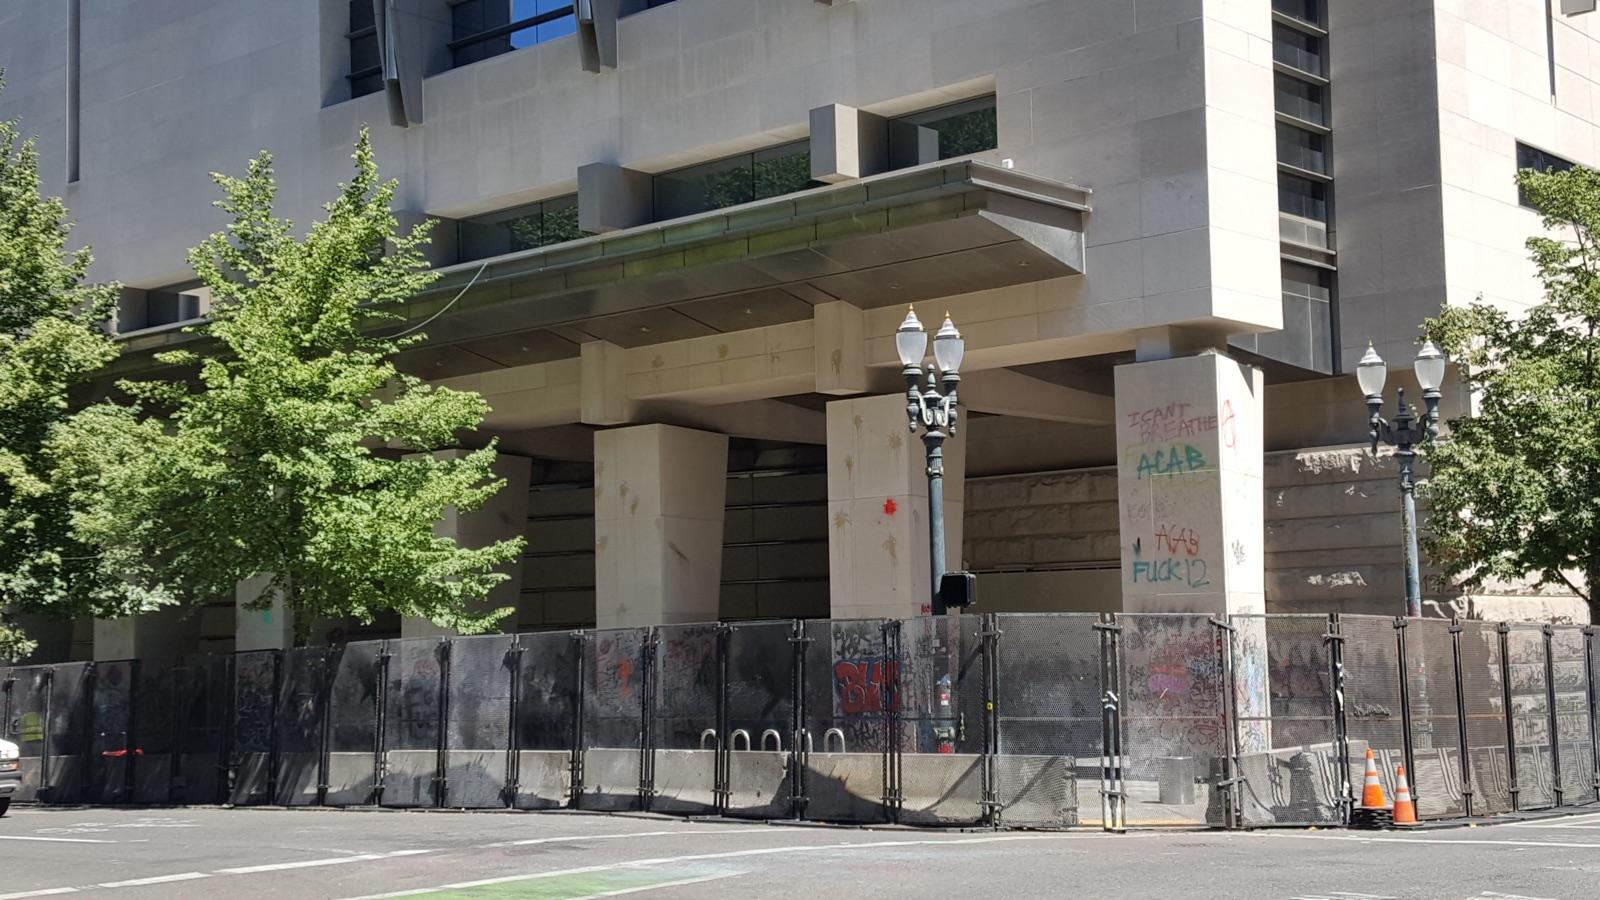
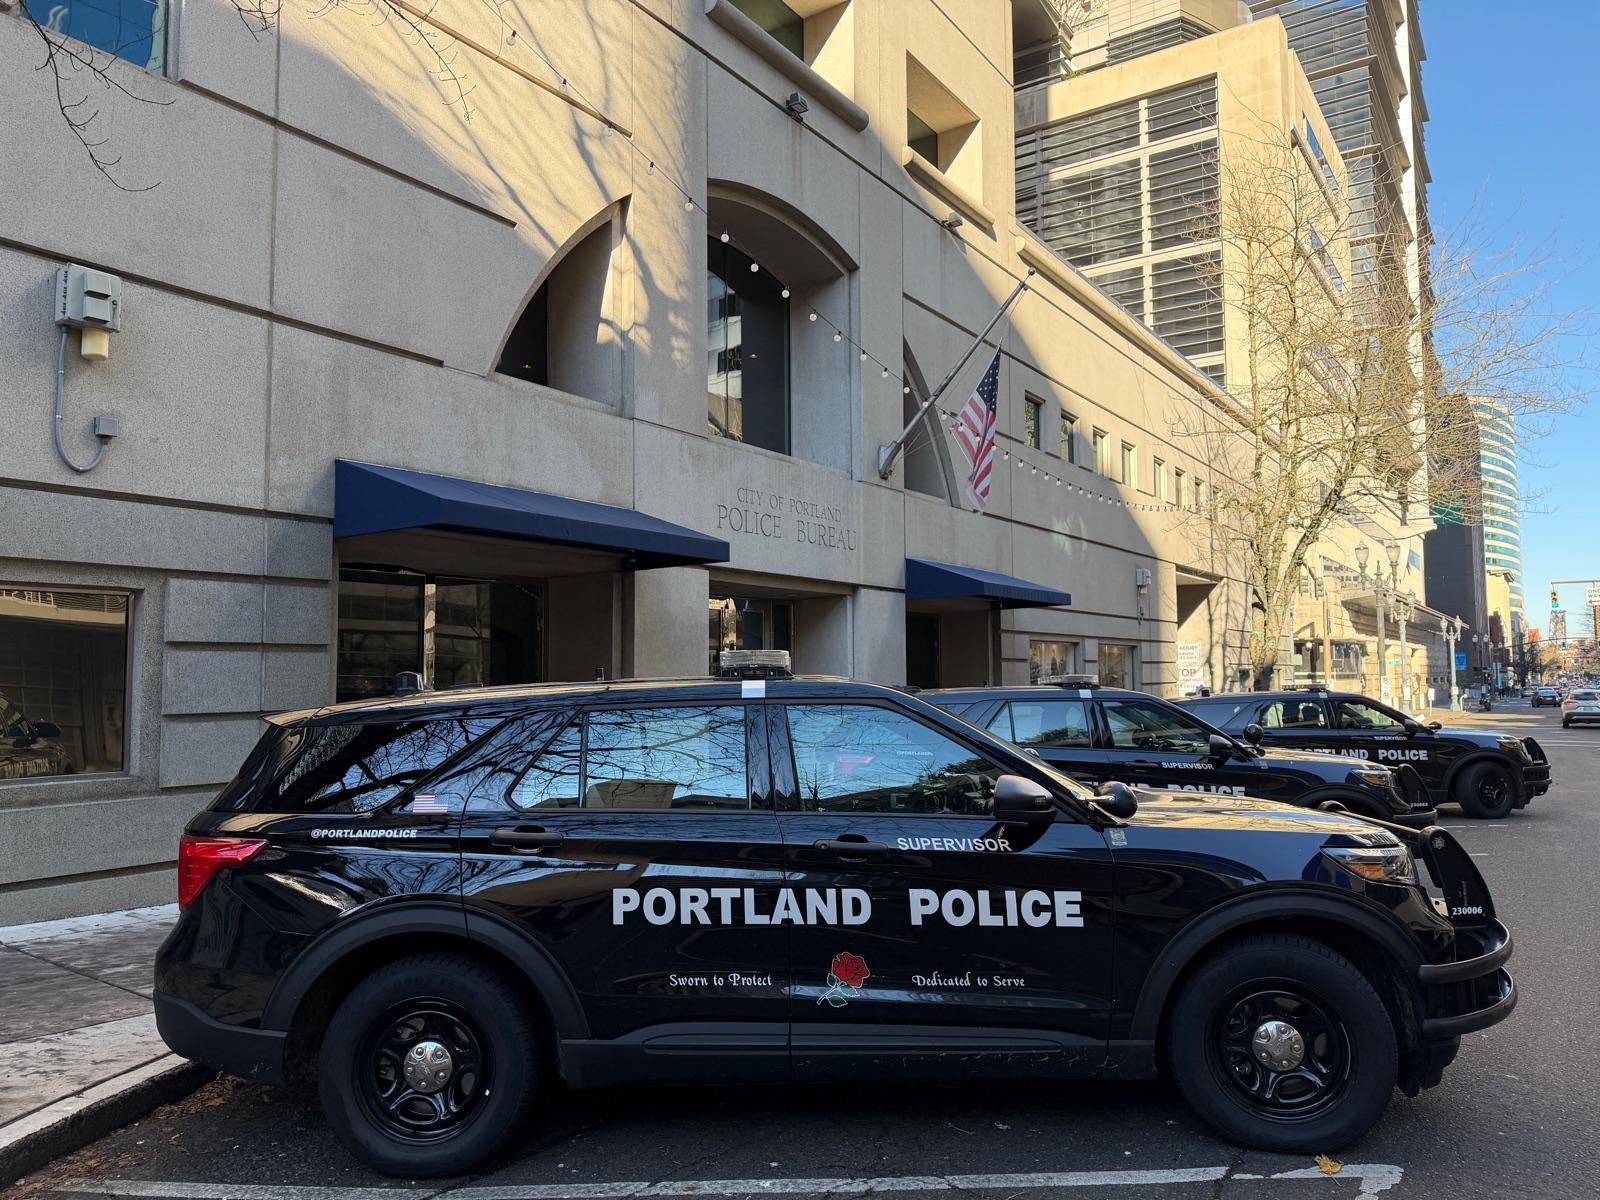
On June 17, 2020, three weeks into nightly protests, the City Council voted 3 to 1 for a budget that eliminated 84 police officer positions, including the 38-person Gun Violence Reduction Team. No officer was laid off. The police budget fell once, by 3.6%, and was back above its earlier level two years later.F4 F22
Police response to urgent calls slowed in June 2020 and has not recoveredF23
Minutes for Portland police to reach the most urgent calls, by month. It was 7.5 minutes in May 2020, 12.2 in June and 16.4 in August.F4 Averaged over the year, it rose 135% from 2019 to 2025. It has barely moved since: in the first ten months of 2026 the average was 18.9 minutes, against 19.1 in the same months of 2025 and 8.3 in the same months of 2019.F23U13
Compared here: Portland only. Comparable monthly figures are not published for most of the nine cities.
Response times kept rising after the number of officers stopped falling
Each line is set to 100 in 2019. Portland had 889 sworn officers in 2019 and 791 in 2021, a fall of 11% of the force. Since 2021 the number has risen to 814 by the FBI’s count, and the Bureau reported 815 sworn members on November 5, 2026. Of those, 305 officers are assigned to patrol, and the Bureau estimates that 55 are working across the city at a given time.U14 Over the same four years the average time to reach the most urgent calls went from 12.2 minutes to 19.5 minutes, even though the number of urgent calls fell by 25% from 2019 to 2025.F53
Compared here: Portland only, 2016 to 2025: the number of sworn police officers, the number of high-priority calls dispatched, and the average minutes for an officer to arrive at those calls. Each line is set to 100 in 2019, and the figures in brackets are the real 2019 and 2025 values.
- Minutes to arrive (8.3 to 19.5)
- Sworn officers (889 to 814)
- Urgent calls (76,877 to 57,733)
Most of the added time is calls waiting for an officer to be assigned
The average response time has two parts: minutes the call waits before an officer is assigned, and minutes the officer spends travelling. The wait went from 1.9 minutes in 2019 to 10.8 minutes in 2025, which is 79% of the rise in the average. Travel time went from 6.4 minutes to 8.6. The middle call rose less, from 6.5 minutes to 9.9, so the longest waits grew the most.F53
Compared here: Portland only. Average minutes to reach high-priority calls in each year, split into waiting for an officer and travelling.
From 2019 to 2022 Portland lost about the same share of its officers as the typical comparison city. By 2025 it had lost less.F24
Change in the number of sworn officers from 2019 to 2022, by the FBI’s count. Seattle lost 24% and Minneapolis and St. Paul together 23%.F24 Portland did start with fewer officers for its size than most: 1.34 for every 1,000 residents in 2019, against 1.85 in the typical comparison city. Only San Diego had fewer among the cities with a reliable count.F24 By 2025 Portland had recovered part of the loss and was 8.4% below its 2019 number, a smaller loss than in the typical comparison city (15.0%). Seattle was 24.9% below and Minneapolis and St. Paul together 21.6%.U15
Compared here: Portland against Seattle, Denver, Minneapolis and St. Paul together, San Diego, Phoenix, Salt Lake City and Austin. Columbus and Raleigh are left out because the FBI’s 2019 counts for them are missing or unreliable.
Change in sworn officers, 2019 to 2022
How much staffing can explain
- Published research estimates that each additional officer prevents between 0.058 and 0.102 homicides a year. Run in reverse for the 98 to 168 officers Portland lost, that is 6 to 17 homicides a year.F25
- Portland has had about 41 more homicides a year than the trend in comparison cities would predict. So staffing could explain 14% to 42% of the extra.F25
- If only Portland’s loss beyond what other cities lost is counted, it explains none.F25
- For violent crime overall, one published estimate gives 18% to 29% of Portland’s extra violent crime and a second, less precise one gives 55% to 95% of it.F25
Reasons to doubt it is the main cause
- In 2020 itself, violent crime rose less in Portland than in the typical comparison city.F26
- Three of five neighboring police forces (Beaverton, Vancouver and the county sheriff) saw the same rise in serious assaults as Portland. Hillsboro and Gresham did not.F26
- Traffic stops had already fallen 67% from 2012 to 2017 without a rise in violence.F26
The district attorney
Did the district attorney stop prosecuting?
It is not shown that he stopped prosecuting serious crimes. Multnomah County’s district attorney announced on August 11, 2020 that he would not charge offenses tied only to protesting.F27 Felony cases fell 15% in 2020 and were back to 6% above their 2019 level in 2025. Washington and Clackamas counties fell further and did not recover: in 2025 they were 18% and 32% below. A new district attorney took office in January 2025, so the 2025 figures are from his successor’s first year.U26F27
Cases for minor offenses fell 71% from 2019 to 2022, against 14% and 17% next door. They have since risen, from 2,540 cases in 2022 to 5,710 in 2025, but were still 35% below 2019, while Washington and Clackamas counties were 29% and 10% above it.U26 The decline began before 2020, and police were also sending prosecutors far fewer cases.F27 That may matter for vandalism and disorder downtown. It was not measured.
Compared here: Multnomah County against Washington and Clackamas counties. Felony cases filed in court each year, with 2019 set to 100.
- Multnomah County
- Washington County
- Clackamas County
Explanation three: taxes
After the county income tax passed, the households leaving earned more than before. How much of that the tax caused is uncertain.
Four tax changes approved by voters or the City Council arrived between 2018 and 2020, and the county’s business income tax also rose in 2020. The clearest evidence concerns one of them: Multnomah County’s income tax on high earners, which took effect in January 2021.F17 F5
- The City Council raised the city’s business income tax to 2.6% of net business income.F17
- Portland voters approved a 1% tax on the sales of large retailers to fund clean energy projects, with 65% of the vote.F17
- Voters in the Metro district, which covers the urban parts of Multnomah, Washington and Clackamas counties, approved income and business taxes for homeless services, with 58% of the vote.F17
- Multnomah County voters approved Preschool for All, an income tax on high earners, with 64% of the vote.F17
After 2020, households leaving Multnomah County came to earn as much as those staying. In the two neighboring counties they never did.F18
The average income of a household that moved away, divided by the average income of a household that stayed. At 1.0 the two are equal. Washington and Clackamas counties pay the Metro homeless services tax and do not pay the Multnomah County tax,F17 which makes them the fairest comparison.
Compared here: Multnomah County against its two Oregon neighbors and against the middle of the nine comparison cities’ central counties. Years are the second year of each pair of tax years, so 2022 means moves between 2021 and 2022.
- Multnomah County
- Washington County
- Clackamas County
- Typical of the nine
Most of the income that left Multnomah County went beyond the three neighboring counties
Where the extra income that left Multnomah County went over three years, beyond the usual pattern. The lines and circles are sized by dollars.
How much
- Multnomah County lost $3.1 billion in income to moves over three years, counting what leavers took minus what arrivals brought.F19
- Between $0.10 billion and $1.50 billion of that left Multnomah beyond what left the neighboring counties. That is 3% to 48% of the loss. The top figure counts the year of the vote, before the tax applied.F19
- That range measures how Multnomah County differed from its neighbors. The tax is one possible reason, and crime, school closures and remote work changed in the same months.
- Measured in people instead of dollars, the same comparison covers none to 15% of the 28,920 residents the county lost to moves.F19
Reasons to doubt a large effect
- The county began losing income to movers in 2016–17, and the loss grew in 2019–20, before the vote.F21
- The number of county tax returns showing $200,000 or more never fell. It rose from 26,910 in 2019 to 37,620 in 2023.F21
- The share of households leaving rose about as much as it did in Seattle’s, Minneapolis’s or Denver’s counties.F21
- The effect is fading: 2.0 points above comparable counties in 2020–21, 1.7 in 2021–22 and 0.9 in 2022–23.F21
Not supported
Ten explanations the records do not support
Each of these is widely believed. For each, the records either point the other way or cannot test the claim. A claim that is not shown may still be true, and each entry gives the strongest evidence on the other side. City business taxes appear both here and among the three open explanations, because the records neither show an effect nor rule one out.
City business taxes
City business taxes are not shown to be the cause of the job loss: office jobs grew elsewhere in the city under the same taxes and nothing broke when the taxes rose in 2018 and 2019. They are not ruled out either.N1
The strongest evidence the other way. The number of professional-services firms in Portland fell 7.6 points against the suburbs from 2019 to 2023, which could be a tax effect and cannot be separated from remote work and downtown conditions. Business applications are mostly from businesses with no employees and rose more in Clark County (91.7%) than in Multnomah. No public count of business tax filers by location exists to test this directly, and the independent check would list this item as not known instead of not shown.
The taxes of 2018 to 2020 started the slide
The idea that the taxes of 2018 to 2020 started the slide is not shown: Multnomah County's share of the region's jobs was already falling every year from 2015, three years before the first of them.N9
The strongest evidence the other way. A slide that began earlier could still have been deepened by the taxes, and effects of taxes can lag by years because of leases. Nothing here separates the two.
The Metro income tax
The Metro income tax, which the Oregon suburbs pay too, shows no effect: the income of top earners in Washington and Clackamas counties fell against Clark County no faster after the tax than before it.N2
The strongest evidence the other way. The number of such returns did fall faster after 2019 (4.6 points a year against 3.3), and a small tax effect inside that cannot be separated from remote work.
The 2017 affordable housing mandate
The 2017 affordable housing mandate is not shown to explain the fall in homebuilding at the city line: new housing shifted out of Multnomah County more sharply than out of any comparison central county, but apartment permits fell as far in Oregon suburbs that have no mandate.N3
The strongest evidence the other way. Portland's share of the four-county area's permitted apartment units dropped from 49.1% in 2019 to 20.0% in 2020, about when projects approved before the mandate ran out. That is the timing the mandate would produce, so a part for the mandate is not ruled out. A separate comparison with other cities (claim F35) finds the mandate may explain part of the fall in apartment approvals.
The cost of housing
Housing cost is not shown to be the cause of the loss after 2020: Multnomah County lost residents to the rest of the country at about the same rate as the central counties of Seattle and Minneapolis-St. Paul.N5
The strongest evidence the other way. This was tested only against people moving, and it does not rule out housing cost as a reason people left before 2020.
School closures
School closures are not shown to be a cause: enrollment fell somewhat more in Portland Public Schools than in the typical neighboring district, but middle-income households did not shift from Portland to the suburbs.N4
The strongest evidence the other way. Portland did lose more students than the typical neighbor, and where families moved was not measured by district. School closures were not tested against jobs.
A damaged reputation
A damaged reputation, as something separate from conditions on the ground, is not shown: arrivals from other states stalled just as much in Washington and Clackamas counties and in Minneapolis's county as in Multnomah.N6
The strongest evidence the other way. People deciding against Portland may not tell Beaverton from the city, so a reputation effect could cover the whole Oregon side. No survey of visitors or movers was available, and the fall in restaurant and hotel jobs fits a visitor effect.
Losing locally owned headquarters
The loss of locally owned headquarters is not shown to be a cause of the job loss: nothing in the evidence shows that outside-owned firms left downtown faster than local ones.N7
The strongest evidence the other way. The downtown office towers in financial trouble in 2023 were mostly owned from out of town, according to reporting at the time. No count of departures by ownership exists, so the comparison rests on a small number of named cases.
The urban growth boundary
The urban growth boundary is not shown to have caused the decline: home prices against incomes in Portland's counties sit among those of comparison counties, though a documented shortage of large industrial sites was not tested against job growth.N8
The strongest evidence the other way. Large industrial sites became scarce, and the effect of that on job growth on the Oregon side of the region was not tested. Clark County, outside Oregon's land use system, has the highest ratio of home value to income of the six.
Policy paid for from outside Oregon
Policy backed by funders from outside Oregon is not shown to be a cause of the job loss: it was not tested against jobs.N10
The strongest evidence the other way. The absence of a test is not evidence of no effect.
The wider record
The nine cities Portland is compared with
The rest of this page is the wider record: how Portland compares with similar cities on crime, homelessness, housing and drug policy, and who paid for the measures that changed them. These charts compare Portland with the same nine cities of similar size and role, and each chart says which places it shows. Five of them are fast-growing cities in the Sun Belt and Mountain West, which makes Portland look worse. So the main results are also shown against the three most similar: Seattle, Denver and Minneapolis–St. Paul.
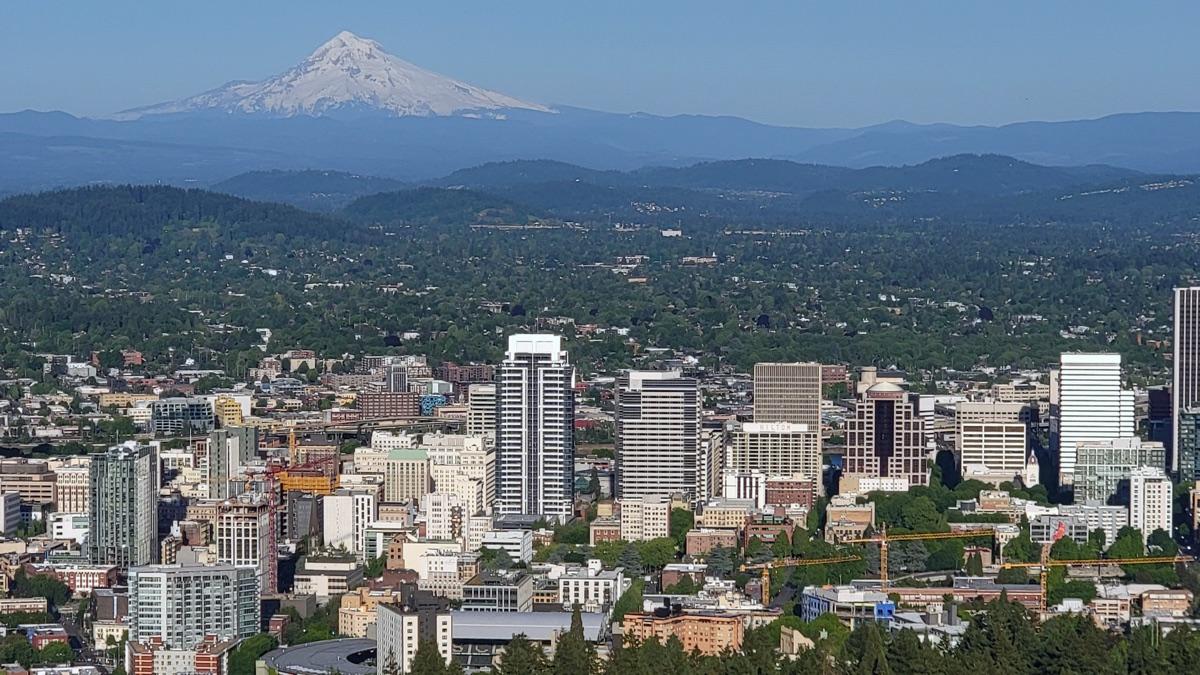 PortlandPortlandMultnomah County
 Most similarSeattleKing County
 Most similarDenverDenver County
 Most similarMinneapolis-St. PaulHennepin and Ramsey counties
 ComparisonColumbusFranklin County
 ComparisonSan DiegoSan Diego County
 ComparisonPhoenixMaricopa County
 ComparisonSalt Lake CitySalt Lake County
 ComparisonAustinTravis County
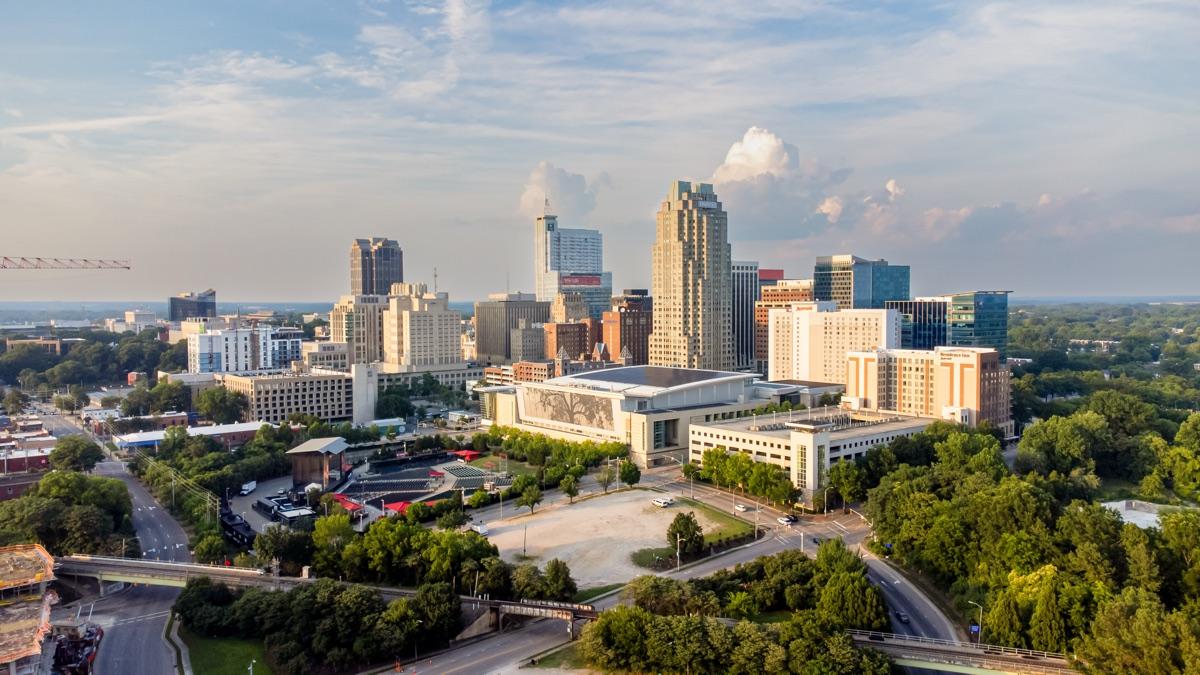 ComparisonRaleighWake County
Where the ten cities are, in the colors used on every chart
Portland is orange. The three most similar cities are blue. The other six are gray. Each label names the central county used for county figures.
What happened
What happened in Portland from 2010 to 2025, in order
The order of events matters to every argument about cause. This is the sequence, with one number for each stretch.
2010–2015
14.0%Job growth in Multnomah County, 2010 to 2015. The typical comparable county grew 13.7%.
Portland grows as fast as similar cities
After the 2008 recession Portland grew about as fast as the cities it resembles. The city approved more homes for its size than the typical comparable city in each year from 2014 to 2018.
These five years were the exception. In 14 of the 18 years from 2002 to 2019, Multnomah County added jobs more slowly than the typical comparable county.
Source notes:F1
Park Avenue West Tower under construction, November 2014. Photo: MojaveNC, 2014. CC BY-SA 3.0. Tilikum Crossing with a MAX train and a bus, September 2015. Photo: Steve Morgan, 2015. CC BY-SA 4.0. 
The Ardea and a neighboring tower in the South Waterfront, May 2014. Photo: M.O. Stevens, 2014. CC BY-SA 3.0. 2015–2016
10.9%The rise in Multnomah County rents in 2016 alone.
Rents jump, and the City declares a housing emergency
The region had fewer empty apartments than almost any comparable region in every year from 2010 to 2017. On October 7, 2015, the City Council declared a housing emergency.
Homelessness did not jump that year. For every 10,000 county residents, about 24 people were sleeping outside in 2015 and about 25 in 2019. Rents did jump.
Source notes:F2
New construction beside a bungalow on North Mississippi Avenue, May 2015. Photo: Tony Webster, 2015. CC BY-SA 2.0. 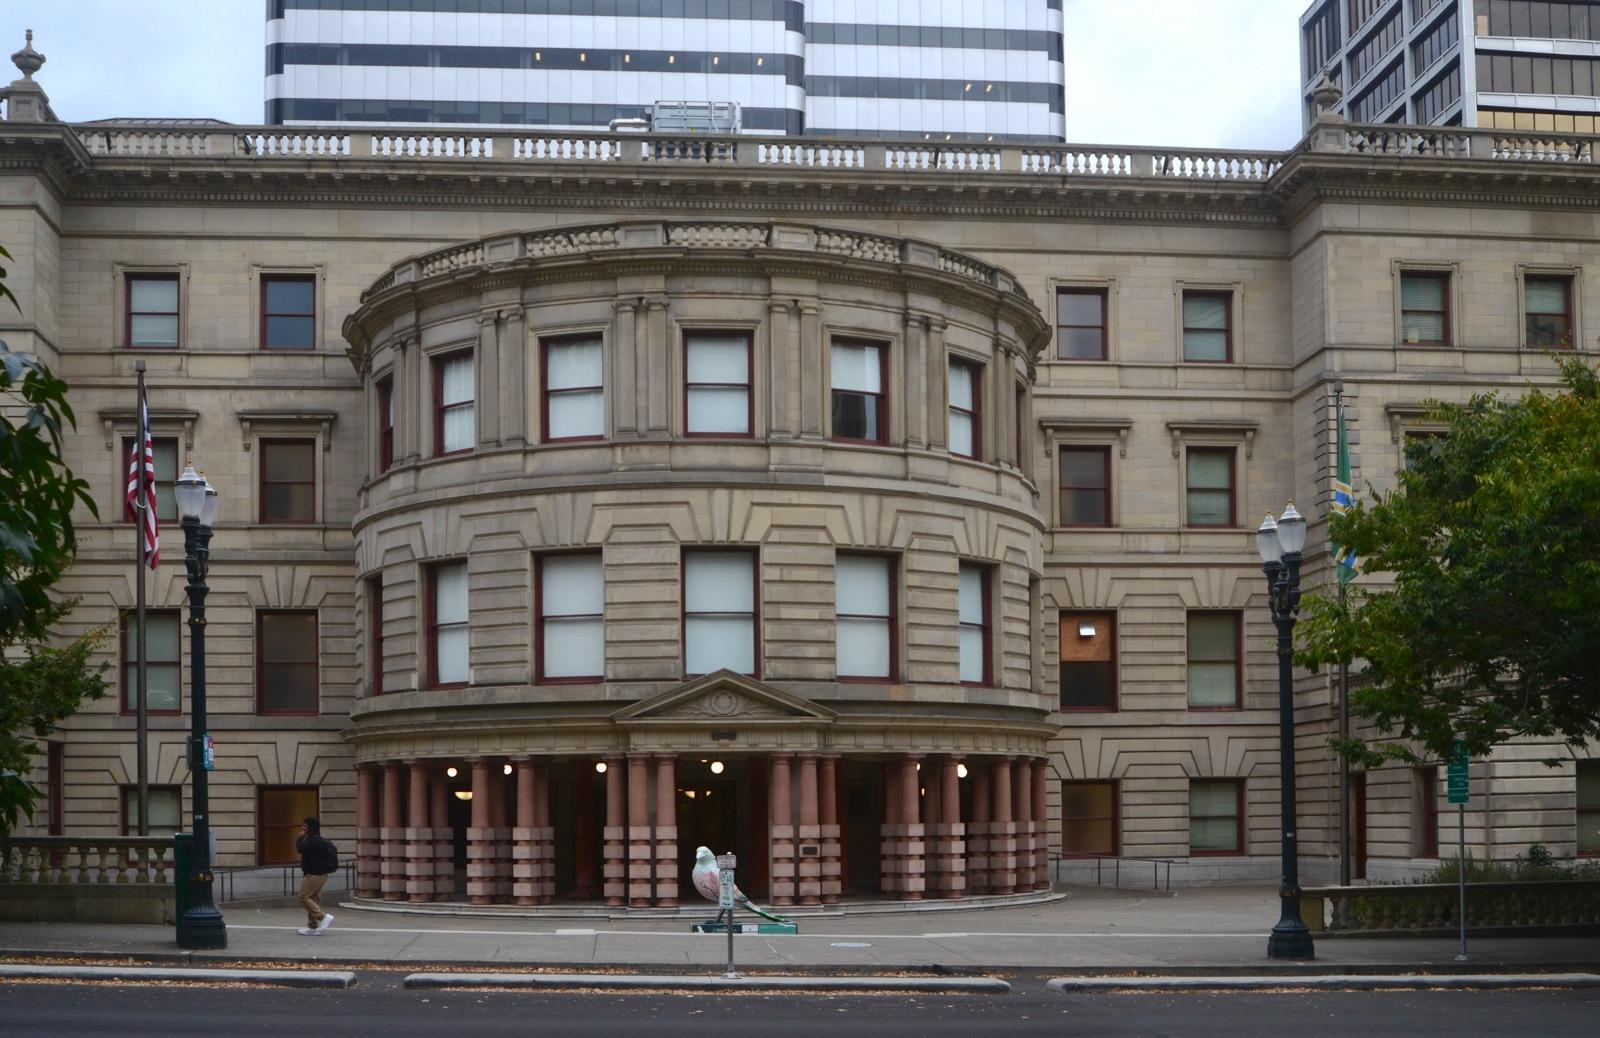
Portland City Hall from SW 4th Avenue, September 2026. Photo: Steve Morgan, 2026. CC BY-SA 4.0. 2016–2019
8.3% against 11.7%Job growth from 2015 to 2019 in Multnomah County and in the typical comparable county.
Jobs, residents and new businesses begin to fall behind
By late 2016 Multnomah County was adding jobs more slowly than comparable counties, and from 2017 more people left the county for other parts of the country than arrived. New business applications rose 1.4% over these years, against 24.6% in the typical comparable county.
The suburbs kept pace. By 2019 the county had about 16,200 fewer jobs than it would have had by matching the typical comparable county. Homicide was the fourth lowest of the ten cities, and incomes kept up.
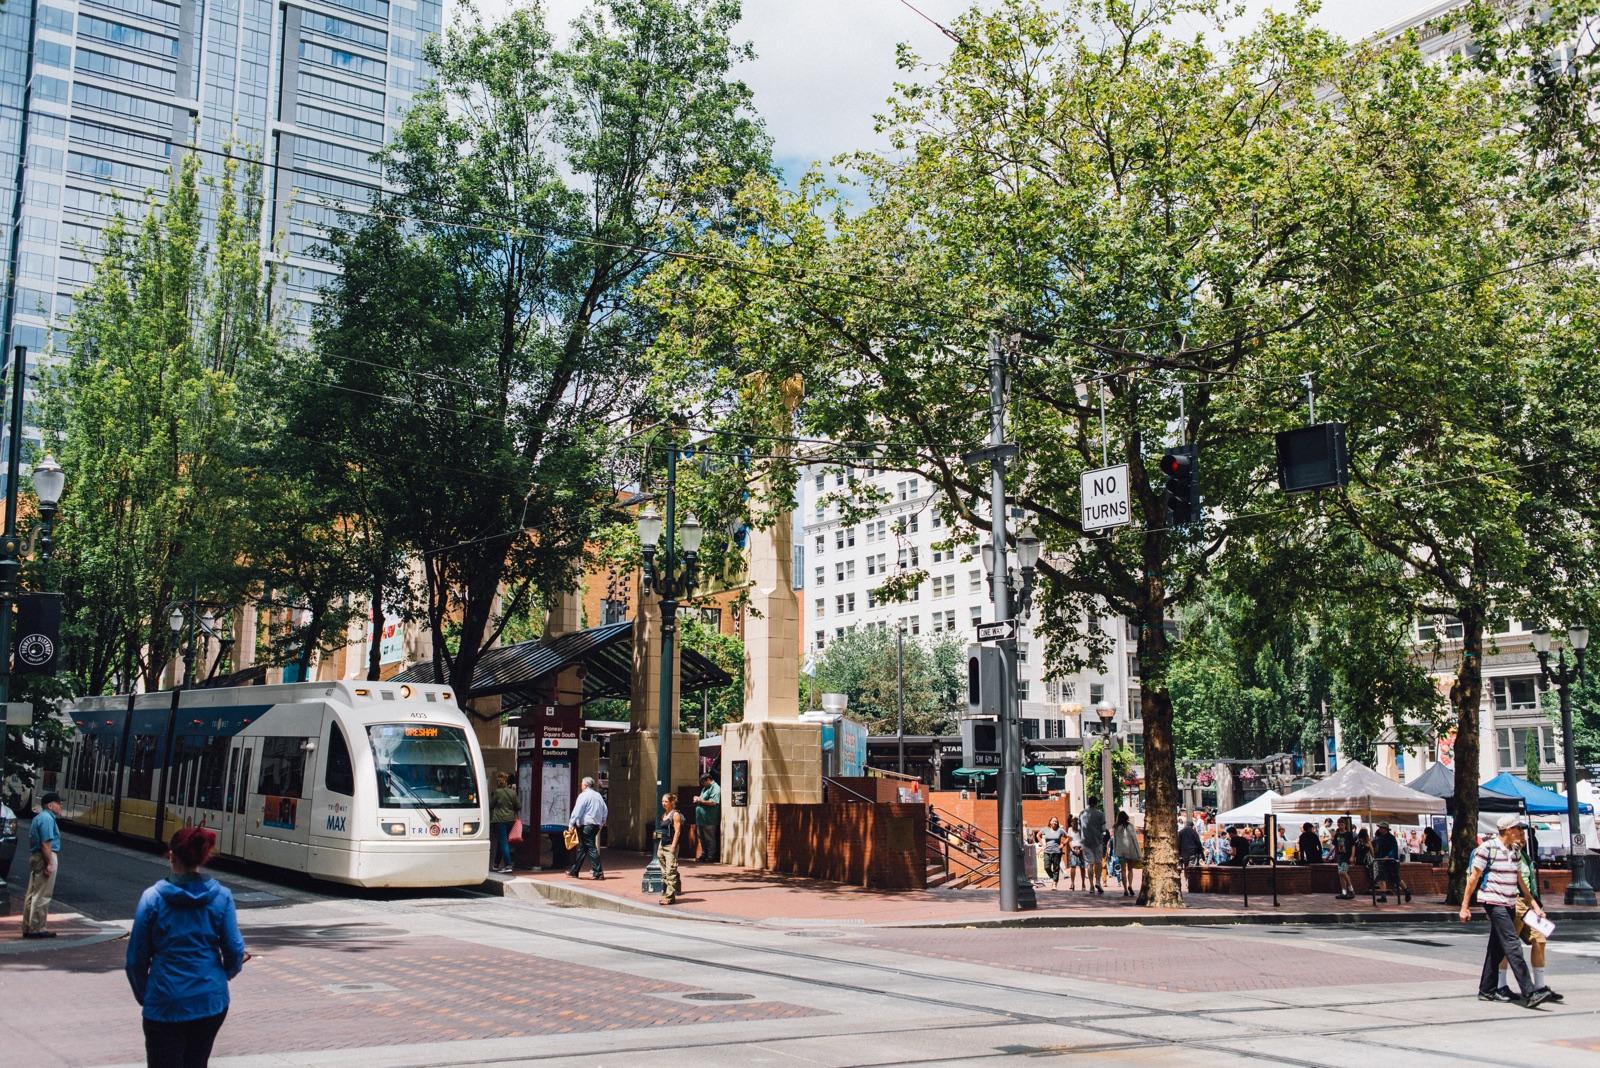
A MAX train at Pioneer Courthouse Square, July 2018. Photo: TriMet, 2018. CC BY 4.0. 
Food carts in downtown Portland, November 2017. Photo: Daderot, 2017. CC0. 
Tents in the Buckman neighborhood, March 2017. Photo: Kingofthedead, 2017. CC BY-SA 4.0. 2020
7.5 → 16.4 minutesPolice response time to urgent calls in May 2020 and in August 2020.
The pandemic empties downtown, and a summer of protest follows
Nightly protests began in late May after the murder of George Floyd in Minneapolis and ran for months. On June 17 the City Council voted 3 to 1 for a budget that eliminated 84 police officer positions, including the Gun Violence Reduction Team. No officer was laid off.
Portland had 49 homicides from June through December, against 14 in the same months of 2019. In November voters approved a county income tax on high earners and a statewide measure removing criminal penalties for drug possession.

Protesters at the federal courthouse fence, July 22, 2020. Photo: Tedder, 2020. CC BY-SA 4.0. An empty SW Broadway, March 27, 2020. Photo: Mattsjc, 2020. CC BY-SA 4.0. 
Boarded storefronts at Pioneer Place, June 3, 2020. Photo: Another Believer, 2020. CC BY-SA 4.0. 2021–2022
$3.1 billionIncome Multnomah County lost over three years, counting what leavers took minus what arrivals brought.
Fentanyl arrives, violence peaks, and high earners leave
Fentanyl became common in Oregon overdose deaths in late 2020, about four years after the rest of the country. The county income tax and Measure 110 both took effect in early 2021. Measured against its own level before 2020, Portland’s homicide rate rose more than in any comparison city.
For the first time in records back to 2012, the average household leaving Multnomah County earned more than the average household staying. The number of people sleeping outside rose more between the 2019 and 2023 counts than in any comparable city.
Source notes:F19 F39 F5 F7 F18 F16
Tents along a street in Old Town, December 27, 2020. Photo: Loren Kerns, 2020. CC BY 2.0. 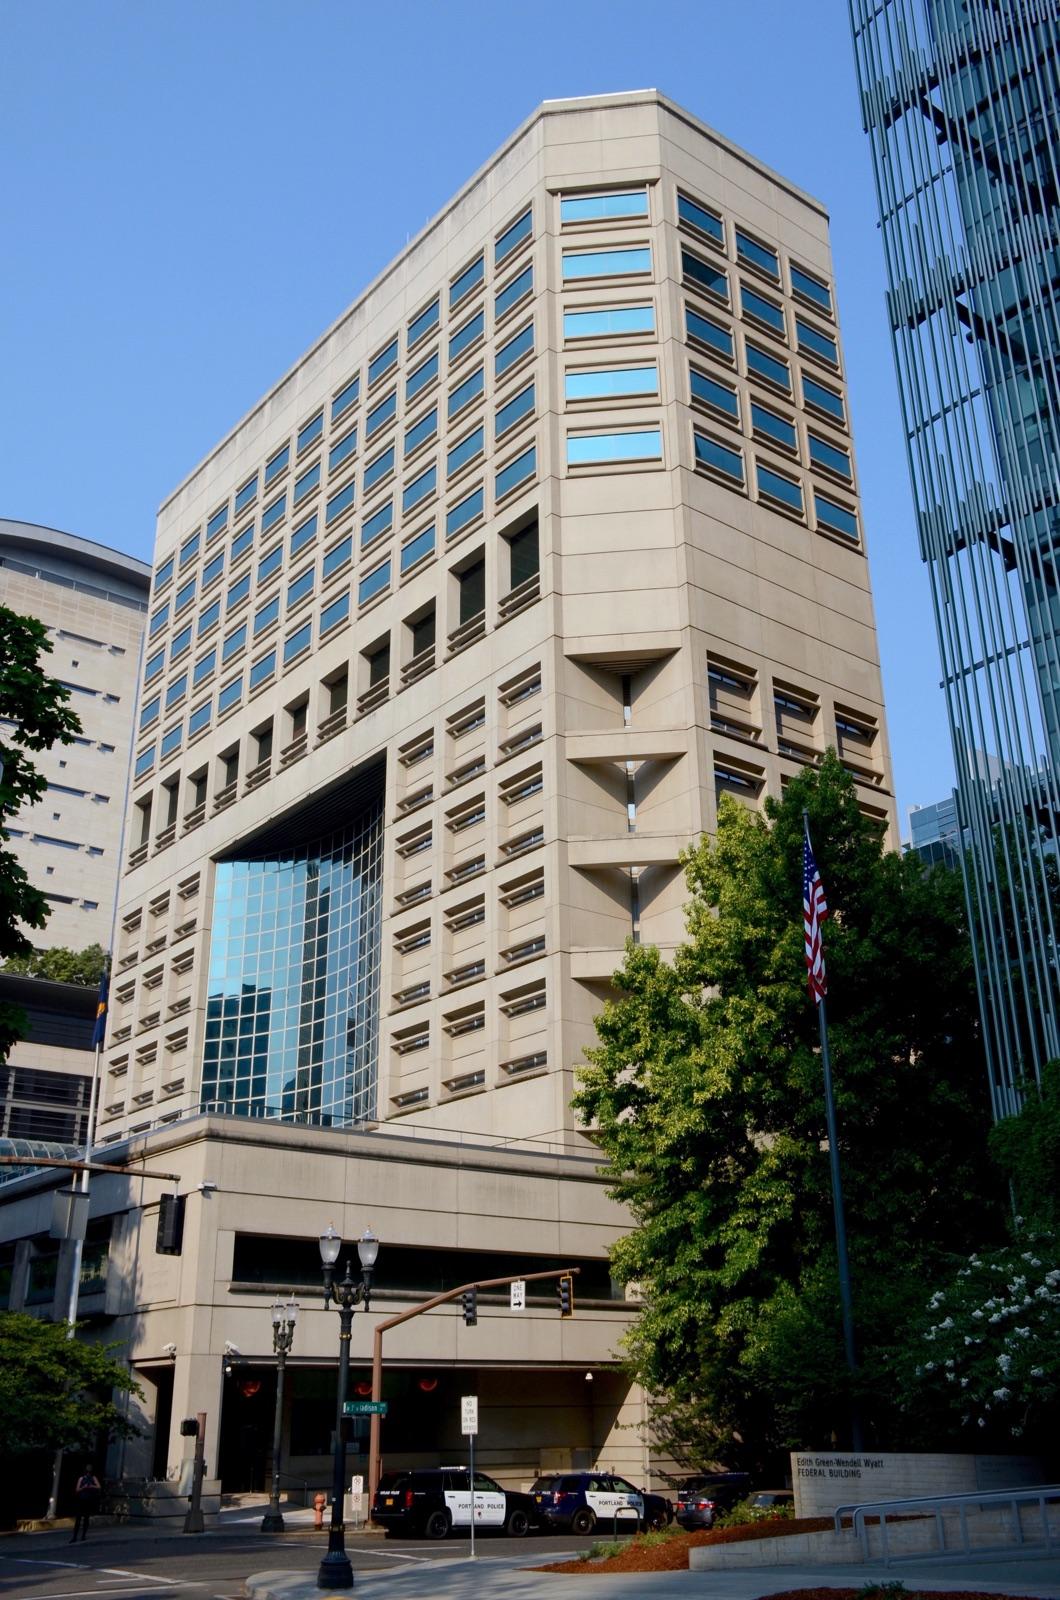
The Multnomah County Justice Center, August 2017. Photo: Steve Morgan, 2017. CC BY-SA 4.0. 2023–2025
−4.9%Change in Multnomah County jobs from 2019 to 2025. The typical comparable county gained 6.0%.
Other cities recover and Portland does not
Phone counts show more people downtown in 2025 than in 2023 or 2024, though no count since spring 2023 compares downtowns against 2019. Criminal penalties for drug possession returned on September 1, 2024.
On jobs, population and the size of its economy, Portland still ranks last among the ten cities for the years since 2019.
SW 2nd Avenue and Pine Street with the U.S. Bancorp Tower behind, January 2025. Photo: Steve Morgan, 2025. CC BY-SA 4.0. 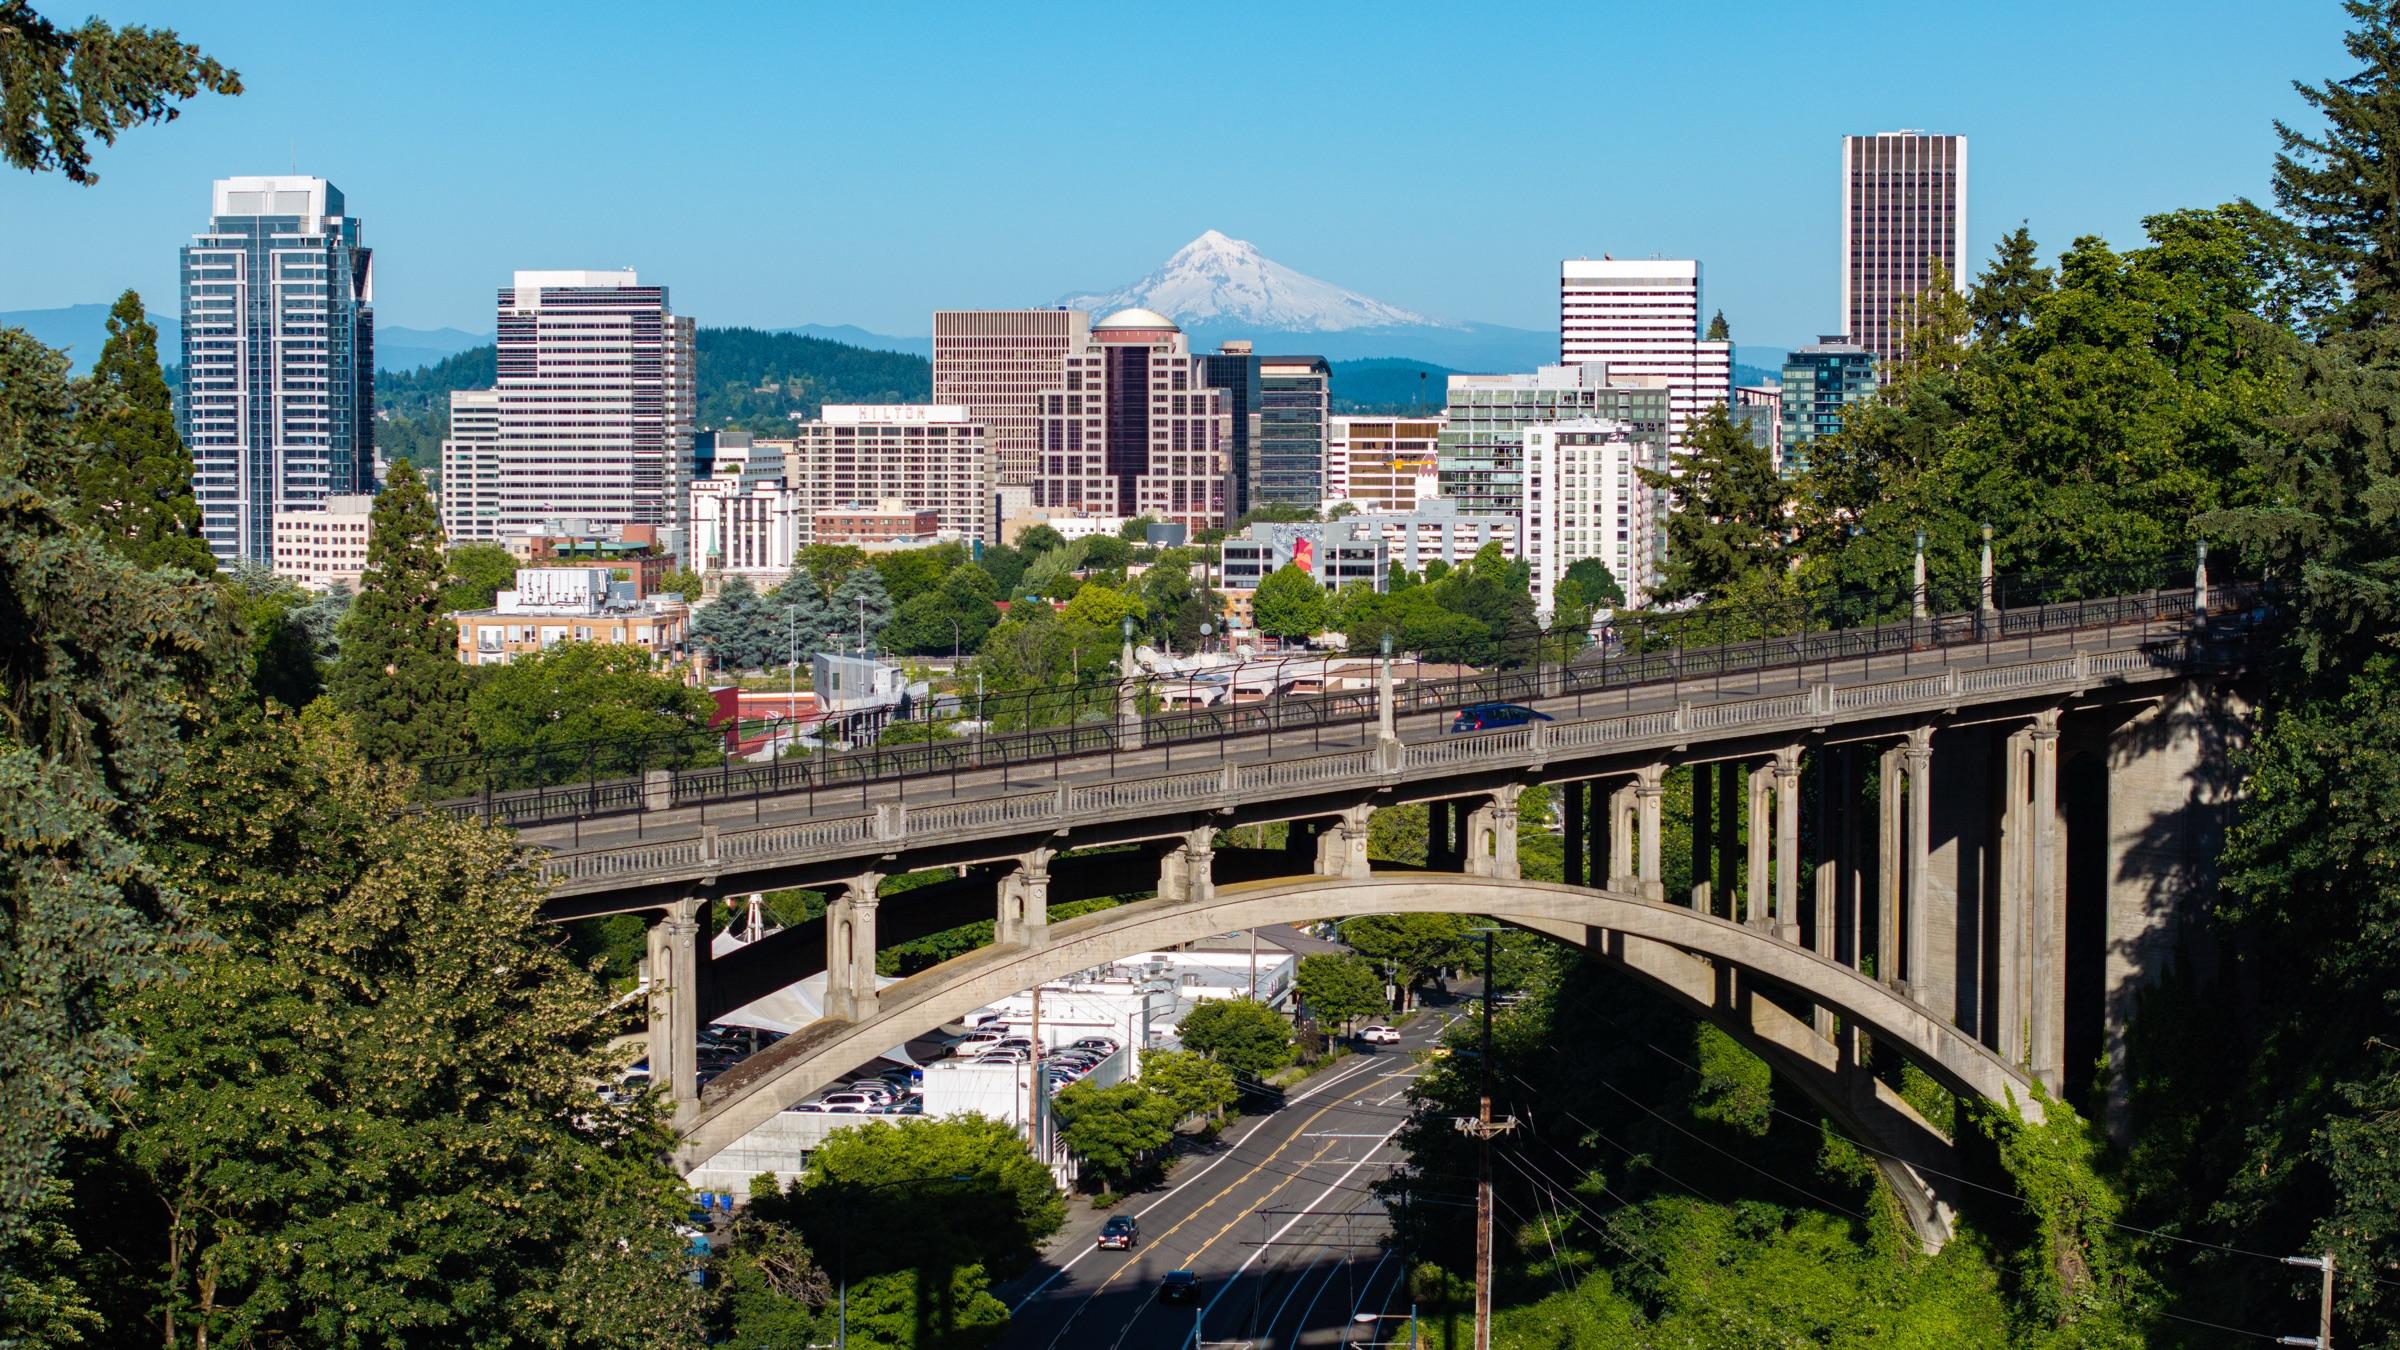
The Vista Bridge, downtown Portland and Mount Hood, June 2024. Photo: Spicypepper999, 2024. CC0.
When it started
Portland’s economy began to trail similar cities about 2015. Homicide and homelessness did not get worse until 2020.
The three charts below show when each measure turned. The shaded band on each chart is the range of the comparison cities, so you can see when Portland leaves it.
New business applications went flat in Multnomah County from 2016 while they kept rising elsewhereF3
Applications to start a business in each central county, with 2015 set to 100. From 2015 to 2019 Multnomah County’s rose 1.4%. The typical comparable county’s rose 24.6%.F3
Compared here: Portland against Seattle, Denver, Minneapolis–St. Paul, Columbus, San Diego, Phoenix, Salt Lake City, Austin and Raleigh. Central counties.
Homicide stayed low until 2020, then more than tripledF7
Homicides for every 100,000 residents, by city police department. Portland’s rate was 4.2 in 2014 and 4.5 in 2019, the fourth lowest of the ten.F7
Compared here: Portland against Seattle, Denver, Minneapolis–St. Paul, Columbus, San Diego, Phoenix, Salt Lake City, Austin and Raleigh. City police departments. Some cities are missing years the FBI marks as incomplete.
Violent crime was rising before 2020, faster than in most comparison cities
Violent offenses for every 100,000 residents. Portland’s rate rose 17% from 2014 to 2019 on the figures drawn here, against about 3% in the typical comparison city. A second set of population figures gives 20% against 6%. Only Denver and Phoenix rose more.F8 Its 2025 rate of 704 is still below Denver’s, Minneapolis’s, Salt Lake City’s and Seattle’s.F8 Car theft rose 107% from 2014 to 2017 and was the highest of the ten cities from 2017 to 2019. Over the same years car thefts rose 52% in the rest of Oregon.F9
Compared here: Portland against Seattle, Denver, Minneapolis–St. Paul, Columbus, San Diego, Phoenix, Salt Lake City, Austin and Raleigh. City police departments.
- Had Portland trailed similar cities before 2015?
- No. Multnomah County added jobs more slowly than the typical comparable county in 14 of the 18 years from 2002 to 2019. The boom of 2010 to 2015 was the exception. After 2015 it fell behind again, and faster than before. Up to 34% of the 2015 to 2019 shortfall is a return to that older pattern.F10
- Did the suburbs fall behind too?
- No. The suburbs kept pace. If Multnomah County had grown as fast as its own suburbs, 91% of its shortfall would not exist. New business applications rose 1.4% in Multnomah County, 7.1% in Clackamas, 19.9% in Washington County and 44.1% in Clark County.F10
- What caused the slide before 2020?
- Mostly we do not know. The business taxes of 2018 to 2020 came too late to start it, because the jobs gap had opened by late 2016.F11 The minimum wage does not explain it: restaurants grew 12.9% in Washington County and 5.4% in Multnomah County under the same wage rules.F11 Housing costs help explain why the county stopped gaining residents from the rest of the country, but Denver, Austin and Seattle saw the same fall and kept adding jobs.F11
- Was 2020 a new shock, or the earlier slide speeding up?
- If Multnomah County had kept falling behind at its 2015 to 2019 pace for six more years, that alone would produce 46% of today’s jobs gap against the nine cities and 68% of the gap against the three most similar.F12 So for the county’s jobs and population the data fits either reading: a slow slide that sped up, or a separate shock in 2020.
How far behind
Since 2019 Portland has done worse than all nine comparison cities on jobs, population and the size of its economy
Each block is one city. Its height is the change from 2019 to 2025. A city that lost ground sinks below the floor. Switch the measure, and switch between all nine cities and the three most similar.
Compared here: Portland against Seattle, Denver, Minneapolis–St. Paul, Columbus, San Diego, Phoenix, Salt Lake City, Austin and Raleigh. Seattle, Denver and Minneapolis–St. Paul are the three most like Portland.
Change in jobs in each city’s central county, 2019 to 2025. Portland is Multnomah County.
The size of the gap depends on the comparison. Against the three most similar, the county’s gap is 27,000 jobs instead of 57,000, and the region’s is 17,000 instead of 74,000.F6 The gap widened in early 2026. In March 2026 the seven-county region had 0.7% fewer jobs than in March 2019, where the full-year 2025 figure was 0.1% more. A separate monthly survey shows the region still losing jobs in September 2026, 7,700 fewer than a year earlier, though the loss has shrunk every month since June.U9
Portland lost residents to the rest of the country somewhat faster than Seattle and Denver did. The larger gap appears to be immigration.
People arriving from other countries minus people leaving for them, for every 1,000 residents, added up over the five years to July 2025. Central counties. Before 2020 Portland was close to typical on this measure.F52
Compared here: Portland against Seattle, Denver, Minneapolis–St. Paul, Columbus, San Diego, Phoenix, Salt Lake City, Austin and Raleigh. Central counties.
Net arrivals from abroad per 1,000 residents, 2021 to 2025
Intel and Nike
Layoffs at Intel and Nike explain a small part of the region’s job gap with all nine regions, and 24% to 37% of its gap with the three most similar
The region trails comparable regions in 20 of 23 industry groups, including restaurants, retail and construction. Against all nine, the gap is too broad for two employers to explain. Whether the broad losses came first or followed the loss of residents and of export-industry jobs cannot be told from this comparison. Against the three most similar regions the gap is smaller, and the two companies’ cuts are 24% to 37% of it.F51
Compared here: The seven-county Portland region against the nine comparison regions (left) and against the Seattle, Denver and Minneapolis–St. Paul regions (right). Jobs, 2019 to 2025.
Against all nine regions, the Portland region is short about
74,000 jobs
- 2,100 jobs explained by Portland’s mix of industries
- 6,200 jobs cut directly by Intel and Nike4,000 to 6,200. The larger figure is drawn.
- 65,700 other jobsNot all of this is broad weakness. After also setting aside the industries tied to Intel and Nike and shifts of jobs within the region, 55% to 80% of the 74,000 is weakness spread across nearly every industry.
Against the three most similar regions, it is short about
17,000 jobs
- 6,200 jobs cut directly by Intel and Nike24% to 37% of the gap.
- 10,800 other jobs
Homelessness
Homelessness rose more in Portland after 2019 than in any comparison city, and the cause is not known
Portland has had the highest or second highest rate of homelessness of the ten cities in every count since 2007. From 2015 to 2019 it changed about as much as elsewhere. The break came between the 2019 and 2022 counts.F28
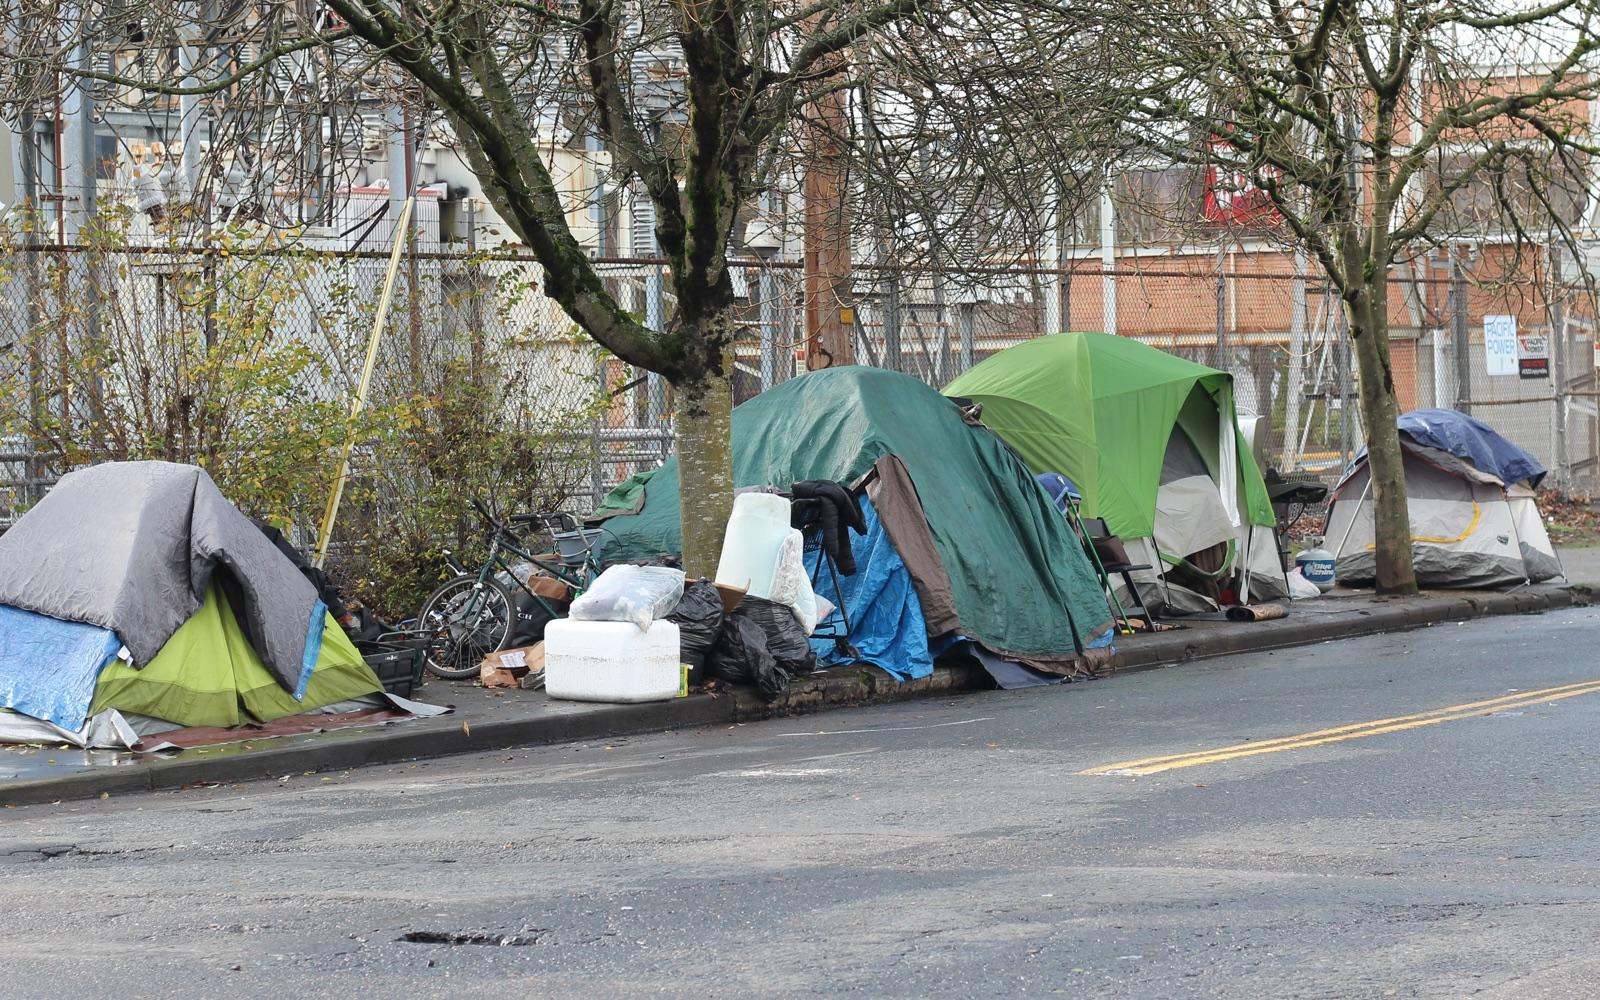
People sleeping outside, for every 10,000 residents
Each point is a year in which the area ran a full street count. Portland’s line is the Portland, Gresham and Multnomah County count. Seattle and King County were higher on the total rate from 2016 to 2020.F28
Compared here: Portland against Seattle, Denver, Minneapolis, Columbus, San Diego, Phoenix, Salt Lake City, Austin and Raleigh. Each is the federal count area that covers the city. That is the county in most cases, but Denver’s covers seven counties and Minneapolis is Hennepin County alone, without St. Paul.
What points at local policy
- The rate rose by 24.6 for every 10,000 residents from 2019 to 2023. In Seattle’s county it rose 10.5, and in Sacramento, the worst of the other West Coast places checked, 16.6.F29
- The joint City and County homeless services office spent 74% of its budget in 2023, its lowest share in six years. In the first year of the Metro homeless services tax it spent $36 million of the $52 million budgeted from that tax.F30
What points away from local policy
- Over the longer stretch from 2015 to 2023, Oakland and Sacramento rose more than Portland.F29
- From 2018 until June 2024, federal court rulings limited how every western city could enforce camping bans.F31
- Unspent money does not prove that spending it would have lowered the count. Rents explain 0% to 20% of Portland’s gap, local policy anywhere from none to 45% of that gap, and no study measures how.F32
Housing
Homebuilding in Multnomah County fell 56% in 2020, two years before interest rates rose
In December 2016 the City Council required new apartment buildings of 20 or more units to include below-market units, starting February 1, 2017. Developers rushed about 19,000 units into the pipeline before the deadline.F33
Homes approved for construction, for every 1,000 residents
Multnomah County approved 7.5 new homes for every 1,000 residents in 2019 and 3.3 in 2020. Comparable counties held steady through 2022, then slowed as interest rates rose. By 2025 Multnomah County was at 2.0 and the typical comparable county at 6.4. Approvals picked up in 2026: 1,476 homes in the first nine months, 30.7% more than in the same months of 2025. Over those nine months that is 1.9 homes for every 1,000 residents, up from 1.4 in the same months of 2025, against 4.0 in the typical comparable county. It is still the lowest of the ten and 65% below the first nine months of 2019. These nine-month rates cannot be set beside the yearly rates in the chart.U19F34
Compared here: Portland against Seattle, Denver, Minneapolis–St. Paul, Columbus, San Diego, Phoenix, Salt Lake City, Austin and Raleigh. Central counties.
For the mandate as a cause
Against
- Seattle set a record for apartment approvals in 2021, two years after its mandate applied citywide.F36
- Portland loosened its rule in January 2024 and waived fees in July 2025. Approvals kept falling through 2025, then rose: the Census count shows 614 apartments approved in the first nine months of 2026, against 282 in the same months of 2025. That is still far below the 2015 to 2019 pace.U20F36
- Rents in Multnomah County rose 29% from 2019 to 2025, against 37% in comparison counties, and its share of empty apartments in 2025, 6.8%, was among the highest of the ten.U27F36 Those fit weak demand, which would hold down building whatever the rules were.
Measure 110
Measure 110 was paid for by donors outside Oregon. Whether it raised overdose deaths is not settled.
Measure 110 passed statewide in November 2020 with 58.5% of the vote. From February 2021 it replaced criminal penalties for possessing small amounts of drugs with a $100 ticket. Criminal penalties returned on September 1, 2024.F37
After fentanyl arrived, overdose deaths rose most in Oregon and WashingtonF39
Fentanyl reached Oregon about four years after the rest of the country, and deaths rise steeply wherever it arrives.F39 To allow for that, each line starts in the month fentanyl became common in that state’s overdose deaths, at 1.0. A line at 2.0 means the death rate had doubled.
Compared here: Oregon against five other western states: Washington, California, Nevada, Colorado and Idaho.
- Oregon
- Washington
- California
- Nevada
- Colorado
- Idaho
- What do studies of Measure 110 find?
- We found three published studies. One estimates 182 extra deaths in 2021, 23% more than the study predicted without the measure.F40 One finds no significant change in the first year.F40 Neither of those allows for the arrival of fentanyl. A third finds a link that disappears once fentanyl’s spread is taken into account. None covers 2023 and 2024, when Oregon was furthest above other states.F40
- What else is known about Measure 110?
- Portland police had nearly stopped making drug arrests before the measure took effect: recorded drug offenses fell from 189 in May 2020 to 20 in June 2020.F41 The measure’s ticket system did not work: of 10,028 tickets written, 7,925 ended with the person not showing up.F41 Oregon’s deaths began falling in spring 2024, about five months before penalties returned. By the 12 months ending August 2025, the latest period with complete reports, they were 26% below the peak by the CDC’s provisional count, against a 29% fall nationally and 10% in Washington.U21 By the same provisional count, overdose deaths among Multnomah County residents fell from 669 in the 12 months to March 2024 to 480 in the 12 months to September 2025. At 60 for every 100,000 residents that was still the highest rate of the ten central counties, where the typical rate was 26.U22F39
Outside money
Donors outside Oregon paid for four statewide measures. Local donors paid for the local taxes.
For the ballot measures that changed policy in Portland and Oregon from 2014 to 2024, campaign records show who paid. Four statewide measures drew 50% or more of their yes-side money from outside Oregon. The Portland-area taxes and the change to city government were mostly funded locally.
Share of each yes campaign’s money traced to donors outside Oregon
Orange bars are statewide measures. Blue bars are Portland, Multnomah County or Metro measures. These are minimums, because donor records are incomplete.F42
- Did outside money increase after 2016?
- The records are too thin to say. Out-of-state money traced to the progressive side of ballot measures averaged $1.93 million a year from 2012 to 2016 and $1.50 million a year from 2017 to 2026. Move 2016 into the later period and the figures become $1.19 million and $1.81 million. Nearly all of the money before 2016 was for one 2014 marijuana measure.F45
- Is Oregon a cheap place to pass a measure?
- Not by the one available yardstick. The typical Oregon measure cost $5.50 per vote, against $2.70 in five other states.F46
- Did money from outside Oregon reach candidates?
- National money showed up in one 2024 race. The national Working Families Party sent $340,000 to its Oregon branch, most of which went to the sitting district attorney’s campaign. National money made up 35% of what he raised, and he lost. His opponent raised more,F47 and how much of that came from outside Oregon was not measured. Money for candidates before 2020 was not counted, so we cannot say whether it has grown.
- Did newcomers take over Portland’s civic groups around 2016?
- Of ten organizations and campaigns we checked, six had a documented internal conflict between 2015 and 2020.F48 The record cannot show that newcomers were behind it. Each year from 2015 to 2017, about 5.3% of Portland adults had arrived from another state in the past year. That was no higher than in 2010 and 2011, though it was up from 4.7% in 2014.F48 Portland had the highest share of residents born in another state of all ten cities in every year from 2010 to 2019,F48 and that share rose from 43.5% in 2010 to 47.1% in 2016.F48
Not known
The public record cannot yet settle six questions
These are the gaps that keep the main question open. Some could be closed with records that exist and have not been published.
How to divide Portland’s own share of the loss among the three causes
The evidence points most to remote and hybrid work, then to safety and street conditions, and least to taxes. What it cannot do is divide the 55% to 90% of the downtown loss that is specific to Portland among them.K1
Which employers lost the jobs
Which employers account for most of the jobs lost on the largest blocks, and why those jobs went, is not known from public records. The job records give counts by block and industry, never by employer.B10
The strongest evidence the other way. This could be settled by records that exist but are not public: building rent rolls, commercial tenant histories, and the worksite reports employers file with the Oregon Employment Department. Until then, any account of why most of these jobs went is a guess.
How much is real and how much is re-reporting
It is not known how much of the recorded loss is real and how much is staff who still have their jobs but are now reported at another address.K2
The strongest evidence the other way. Counted by where people actually work, the number working on site in Portland fell 20.0% from 2019 to 2025, so a large real change in where work is done is not in doubt.
Why the slide began about 2015
It is not known why the slide against the suburbs began about 2015.K4
Why so few people arrive from abroad
It is not known why immigration from abroad to Multnomah County is so much lower than to comparable counties.K5
Whether the changes of 2024 to 2026 are working
It is not known whether the policy changes of 2024 to 2026 are working, because job counts end in 2024 for the city and in March 2026 for the county, where they were still falling.K6
Records that would help.
- Job counts for the City of Portland by quarter and industry, which the Oregon Employment Department holds and publishes only by county.
- The number of businesses paying the City’s business tax each year, by location and size.
- State income tax returns by income group and county, for people who moved during the year.
- Office leases signed and ended downtown since 2019, with where each tenant went.
Evidence
The source for every claim on this page
Each small tag in the text, such as P2 or B6, links to a card here. A card gives the claim, its grade, every figure behind it, how the figure was worked out, the strongest evidence against it and the documents it rests on.
Proven 49 claims: P1, P2, P3, P4, P5, P6, P7, P8, P9, P11, P12, F1, F3, F6, F7, F8, F9, F16, F18, F21, F24, F34, F52, F53, U4, U7, U8, U9, U10, U13, U14, U15, U16, U19, U20, U21, U22, U25, U26, U27, J1, J2, J4, J5, J6, B1, B2, B5, B6
The City of Portland had 477,989 jobs in 2019 and 457,479 in 2024, a loss of 20,510, while the rest of Multnomah County gained 4,103.
4 figures, with sources and method
- 477,989 Jobs located in the City of Portland, 2019. How it was worked out: Jobs in census blocks inside the 2020 Portland city boundary, summed. A job is counted at the address the employer reports. Source: U.S. Census Bureau, LEHD Origin-Destination Employment Statistics (LODES), version 8, Workplace Area Characteristics; U.S. Census Bureau, LODES version 8 geography crosswalk
- 457,479 Jobs located in the City of Portland, 2024. How it was worked out: Jobs in census blocks inside the 2020 Portland city boundary, summed. A job is counted at the address the employer reports. Source: U.S. Census Bureau, LEHD Origin-Destination Employment Statistics (LODES), version 8, Workplace Area Characteristics; U.S. Census Bureau, LODES version 8 geography crosswalk
- -20,510 (-4.3%) Change in jobs in the City of Portland, 2019 to 2024. How it was worked out: The 2024 count less the 2019 count. Source: U.S. Census Bureau, LEHD Origin-Destination Employment Statistics (LODES), version 8, Workplace Area Characteristics; U.S. Census Bureau, LODES version 8 geography crosswalk
- +4,103 Change in jobs in Multnomah County outside Portland, 2019 to 2024. How it was worked out: Jobs in Multnomah County census blocks that are not inside the Portland city boundary, summed; 2024 less 2019. Source: U.S. Census Bureau, LEHD Origin-Destination Employment Statistics (LODES), version 8, Workplace Area Characteristics; U.S. Census Bureau, LODES version 8 geography crosswalk
Strongest evidence against. These records count a job at the address an employer reports, so they cannot tell a closed workplace from one whose staff are now reported somewhere else. 2019 was also a high year: measured from 2017, the city's job count is up 0.3%.
Sources: U.S. Census Bureau, LEHD Origin-Destination Employment Statistics (LODES), version 8, Workplace Area Characteristics; U.S. Census Bureau, LODES version 8 geography crosswalk
The loss is downtown: jobs within 0.75 miles of the center fell by 16,439, 80% of the city's whole loss, and the fall shrinks with distance to under 1% beyond 2 miles.
7 figures, with sources and method
- -16,439 (-15.9%) Change in jobs within 0.75 mile of the downtown center, 2019 to 2024. How it was worked out: Jobs in City of Portland census blocks whose center point is within the stated distance of the downtown point at latitude 45.5189, longitude -122.6793, summed; 2024 less 2019. Source: U.S. Census Bureau, LEHD Origin-Destination Employment Statistics (LODES), version 8, Workplace Area Characteristics; U.S. Census Bureau, LODES version 8 geography crosswalk
- 80% Share of the city's job loss that lies within 0.75 mile of the center. How it was worked out: 16,439 divided by 20,510. Source: U.S. Census Bureau, LEHD Origin-Destination Employment Statistics (LODES), version 8, Workplace Area Characteristics; U.S. Census Bureau, LODES version 8 geography crosswalk
- -17.0% Change in jobs within 0.5 mile of the center, 2019 to 2024. How it was worked out: Jobs in City of Portland census blocks whose center point is within the stated distance of the downtown point at latitude 45.5189, longitude -122.6793, summed; 2024 less 2019. Source: U.S. Census Bureau, LEHD Origin-Destination Employment Statistics (LODES), version 8, Workplace Area Characteristics; U.S. Census Bureau, LODES version 8 geography crosswalk
- -12.5% Change in jobs within 1.25 miles of the center, 2019 to 2024. How it was worked out: Jobs in City of Portland census blocks whose center point is within the stated distance of the downtown point at latitude 45.5189, longitude -122.6793, summed; 2024 less 2019. Source: U.S. Census Bureau, LEHD Origin-Destination Employment Statistics (LODES), version 8, Workplace Area Characteristics; U.S. Census Bureau, LODES version 8 geography crosswalk
- -0.7% Change in jobs in the city beyond 2 miles from the center, 2019 to 2024. How it was worked out: Jobs in City of Portland census blocks whose center point is within the stated distance of the downtown point at latitude 45.5189, longitude -122.6793, summed; 2024 less 2019. Source: U.S. Census Bureau, LEHD Origin-Destination Employment Statistics (LODES), version 8, Workplace Area Characteristics; U.S. Census Bureau, LODES version 8 geography crosswalk
- 54% (8,827 of 16,439 jobs) Share of the downtown loss carried by the ten census blocks that lost the most jobs. How it was worked out: Each block within 0.75 mile ranked by its change in jobs from 2019 to 2024; the ten largest losses added together and divided by the net downtown loss. Source: U.S. Census Bureau, LEHD Origin-Destination Employment Statistics (LODES), version 8, Workplace Area Characteristics; U.S. Census Bureau, LODES version 8 geography crosswalk
- -6.2% Change in jobs within 0.75 mile of the center, 2017 to 2024. How it was worked out: Same blocks; 2024 less 2017. Source: U.S. Census Bureau, LEHD Origin-Destination Employment Statistics (LODES), version 8, Workplace Area Characteristics; U.S. Census Bureau, LODES version 8 geography crosswalk
Strongest evidence against. 54% of the downtown loss sits in ten blocks, so a small number of employers' reports drive the figure, and the records cannot tell a closure from a change in the address an employer reports. 2019 was a peak after a two-year jump downtown, from 92,554 jobs in 2017 to 103,281 in 2019. The 80% is a share of the city's net loss: outside downtown the city lost 7,130 restaurant, hotel and shop jobs and 3,277 in other work and gained 2,255 office jobs and 4,232 in health care and education. The share depends on the end year and the radius: it is 60% for 2019 to 2022 and 86% within 1 mile.
Sources: U.S. Census Bureau, LEHD Origin-Destination Employment Statistics (LODES), version 8, Workplace Area Characteristics; U.S. Census Bureau, LODES version 8 geography crosswalk
Multnomah County lost 4.9% of its jobs from 2019 to 2025, one of the worst records among the central counties of the 50 largest metro areas, and it lost 20.8% of its factory jobs.
6 figures, with sources and method
- 520,002 and 494,307 Jobs in Multnomah County, 2019 and 2025. Source: U.S. Bureau of Labor Statistics, Quarterly Census of Employment and Wages, annual averages by industry
- -4.9% Change in Multnomah County jobs, 2019 to 2025. How it was worked out: The 2025 annual average divided by the 2019 annual average, less one. Source: U.S. Bureau of Labor Statistics, Quarterly Census of Employment and Wages, annual averages by industry
- 48th of 50 Rank of Multnomah County among the central counties of the 50 largest metros, job change 2019 to 2025. How it was worked out: The 50 metro areas with the most residents in 2020. In each, the central county is the county with the most jobs in 2019. Counties ranked by percent change in jobs. Source: U.S. Bureau of Labor Statistics, Quarterly Census of Employment and Wages, annual averages by industry; U.S. Census Bureau, Metropolitan and Micropolitan Statistical Area Population Totals, Vintage 2025
- 4th worst of 50 The same rank when the historic core county is used for Boston, Detroit, San Francisco, St. Louis and Baltimore. How it was worked out: Suffolk, Wayne and San Francisco counties and the cities of St. Louis and Baltimore replace the county with the most jobs in those five metros. Source: U.S. Bureau of Labor Statistics, Quarterly Census of Employment and Wages, annual averages by industry; U.S. Census Bureau, Metropolitan and Micropolitan Statistical Area Population Totals, Vintage 2025
- 6th to 8th worst of 50 (-3.5%) The same rank measured from 2018 instead of 2019. How it was worked out: 6th worst with the county that has the most jobs, 8th worst with the historic core counties. Source: U.S. Bureau of Labor Statistics, Quarterly Census of Employment and Wages, annual averages by industry; U.S. Census Bureau, Metropolitan and Micropolitan Statistical Area Population Totals, Vintage 2025
- Change in private manufacturing jobs in Multnomah County, 2019 to 2025. -7,410 (-20.8%), 45th of 47 central counties with a published figure How it was worked out: Private employment in manufacturing; three central counties have no published figure for one of the two years and are left out of the ranking. Source: U.S. Bureau of Labor Statistics, Quarterly Census of Employment and Wages, annual averages by industry; U.S. Census Bureau, Metropolitan and Micropolitan Statistical Area Population Totals, Vintage 2025
Strongest evidence against. The rank moves between third and eighth worst depending on which county is counted as the center and which year is the starting point. Falling behind the suburbs is also common: the central county grew more slowly than the rest of its metro in 34 of 42 large metros.
Sources: U.S. Bureau of Labor Statistics, Quarterly Census of Employment and Wages, annual averages by industry; U.S. Census Bureau, Metropolitan and Micropolitan Statistical Area Population Totals, Vintage 2025
Portland lost jobs while its suburbs gained them: the city fell 4.3% from 2019 to 2024 while Washington and Clackamas counties and Clark County grew.
4 figures, with sources and method
- -4.3% Change in jobs in the City of Portland, 2019 to 2024. How it was worked out: Jobs in census blocks inside the 2020 Portland city boundary, summed. A job is counted at the address the employer reports. Source: U.S. Census Bureau, LEHD Origin-Destination Employment Statistics (LODES), version 8, Workplace Area Characteristics; U.S. Census Bureau, LODES version 8 geography crosswalk
- +4.7% Change in jobs in Washington and Clackamas counties, 2019 to 2024, from census block counts. How it was worked out: Jobs in census blocks in the two counties, leaving out the small parts of Portland that lie in them, summed. Source: U.S. Census Bureau, LEHD Origin-Destination Employment Statistics (LODES), version 8, Workplace Area Characteristics; U.S. Census Bureau, LODES version 8 geography crosswalk
- +2.2% Change in jobs in Washington and Clackamas counties, 2019 to 2024, from payroll counts. How it was worked out: The two counties' annual average employment added together. Source: U.S. Bureau of Labor Statistics, Quarterly Census of Employment and Wages, annual averages by industry
- +12.3% Change in jobs in Clark County, Washington, 2019 to 2024. How it was worked out: Jobs in Clark County census blocks, summed. Source: U.S. Census Bureau, LEHD Origin-Destination Employment Statistics (LODES), version 8, Workplace Area Characteristics; U.S. Census Bureau, LODES version 8 geography crosswalk
Strongest evidence against. The two sources disagree on how fast the suburbs grew (4.7% against 2.2%). Neither source observes a job or a firm moving, so whether jobs moved or were lost here and created there is not known. The number of business establishments fell less than jobs did against the suburbs, about 5.6 points from 2019 to 2023.
Sources: U.S. Census Bureau, LEHD Origin-Destination Employment Statistics (LODES), version 8, Workplace Area Characteristics; U.S. Census Bureau, LODES version 8 geography crosswalk; U.S. Bureau of Labor Statistics, Quarterly Census of Employment and Wages, annual averages by industry; U.S. Census Bureau, County Business Patterns, ZIP Code Business Patterns
The Oregon side of the region is weak too: the metro area is last of ten comparison metros for job growth since 2019, and most of the growth outside Multnomah County was in Clark County, Washington.
3 figures, with sources and method
- +0.1%, last of ten Change in jobs in the seven-county Portland metro area, 2019 to 2025, and its rank among ten comparison metros. How it was worked out: County employment added up for each metro, using fixed county lists (September 2018 definitions). The other nine are Seattle, Denver, Minneapolis-St. Paul, Columbus, San Diego, Phoenix, Salt Lake City, Austin and Raleigh. Source: U.S. Bureau of Labor Statistics, Quarterly Census of Employment and Wages, annual averages by industry
- +1.6% Change in jobs in the Oregon suburban counties (Washington, Clackamas, Yamhill and Columbia), 2019 to 2025. How it was worked out: The four counties' annual average employment added together. Source: U.S. Bureau of Labor Statistics, Quarterly Census of Employment and Wages, annual averages by industry
- 69% (18,359 of 26,750 jobs) Clark County's share of the job growth outside Multnomah County, 2019 to 2025. How it was worked out: Clark County's gain divided by the gain of the six metro counties other than Multnomah. Source: U.S. Bureau of Labor Statistics, Quarterly Census of Employment and Wages, annual averages by industry
Strongest evidence against. Against the three most similar regions the metro's gap is small: Seattle's grew 1.5% and Minneapolis-St. Paul's 0.5%, though Denver's grew 5.8%. Clark County is part of the same job market, so its gain is also the region's gain.
Multnomah County has been losing its share of the region's jobs since at least 1969, as the central counties of Denver and Minneapolis-St. Paul did, and from 2001 to 2007 the three most similar centers lost as much share as Portland's or more.
4 figures, with sources and method
- 70.2%, 46.2% and 41.9% Multnomah County's share of jobs in Multnomah, Washington, Clackamas and Clark counties, 1969, 2001 and 2022. How it was worked out: Multnomah County total employment divided by the total for the four counties. 1969 is from the older BEA table and 2001 and 2022 from the current one. Source: U.S. Bureau of Economic Analysis, Total full-time and part-time employment by industry, counties, 1969 to 2000 (table CAEMP25S); U.S. Bureau of Economic Analysis, Total full-time and part-time employment by industry, counties, 2001 to 2022 (table CAEMP25N)
- 64.4% and 29.8% Denver County's share of jobs in seven Denver-area counties, 1969 and 2022. How it was worked out: Same calculation. Broomfield County is included from 2001, when it was formed. Source: U.S. Bureau of Economic Analysis, Total full-time and part-time employment by industry, counties, 1969 to 2000 (table CAEMP25S); U.S. Bureau of Economic Analysis, Total full-time and part-time employment by industry, counties, 2001 to 2022 (table CAEMP25N)
- 88.4% and 69.0% Hennepin and Ramsey counties' share of jobs in seven Minneapolis-St. Paul-area counties, 1969 and 2022. How it was worked out: Same calculation. Source: U.S. Bureau of Economic Analysis, Total full-time and part-time employment by industry, counties, 1969 to 2000 (table CAEMP25S); U.S. Bureau of Economic Analysis, Total full-time and part-time employment by industry, counties, 2001 to 2022 (table CAEMP25N)
- -2.60, -2.90, -2.99 and -2.60 percentage points Change in the central county's share of metro payroll jobs, 2001 to 2007: Multnomah, King (Seattle), Denver, and Hennepin and Ramsey. How it was worked out: Central county employment as a percent of the metro's, 2007 less 2001, with fixed county lists. Multnomah's loss is the fifth largest of the ten comparison metros. Source: U.S. Bureau of Labor Statistics, Quarterly Census of Employment and Wages, County High-Level files
Strongest evidence against. This is the national pattern, so the long loss by itself explains nothing particular to Portland. Two different measures are in use: the four-county share above ends in 2022, and the seven-county payroll share, which runs to 2025, went from 43.05% in 2019 to 40.89%.
Sources: U.S. Bureau of Economic Analysis, Total full-time and part-time employment by industry, counties, 1969 to 2000 (table CAEMP25S); U.S. Bureau of Economic Analysis, Total full-time and part-time employment by industry, counties, 2001 to 2022 (table CAEMP25N); U.S. Bureau of Labor Statistics, Quarterly Census of Employment and Wages, County High-Level files; U.S. Bureau of Labor Statistics, Quarterly Census of Employment and Wages, annual averages by industry
In almost every downturn since 1981, Multnomah County lost jobs while the rest of the region grew or lost less: in 1981 to 1983, 1991, 1999, 2002 to 2003 and 2020, but not in 2009.
9 figures, with sources and method
- -2.8% and +0.6% Change in jobs in 1981: Multnomah County, and Washington, Clackamas and Clark counties together. How it was worked out: Total employment in the year, compared with the year before. Source: U.S. Bureau of Economic Analysis, Total full-time and part-time employment by industry, counties, 1969 to 2000 (table CAEMP25S)
- -4.3% and -1.1% The same for 1982. Source: U.S. Bureau of Economic Analysis, Total full-time and part-time employment by industry, counties, 1969 to 2000 (table CAEMP25S)
- -0.7% and +3.7% The same for 1983. Source: U.S. Bureau of Economic Analysis, Total full-time and part-time employment by industry, counties, 1969 to 2000 (table CAEMP25S)
- -0.4% and +3.1% The same for 1991. Source: U.S. Bureau of Economic Analysis, Total full-time and part-time employment by industry, counties, 1969 to 2000 (table CAEMP25S)
- -0.1% and +2.7% The same for 1999. Source: U.S. Bureau of Economic Analysis, Total full-time and part-time employment by industry, counties, 1969 to 2000 (table CAEMP25S)
- -2.6% and -0.5% The same for 2002. Source: U.S. Bureau of Economic Analysis, Total full-time and part-time employment by industry, counties, 2001 to 2022 (table CAEMP25N)
- -0.5% and +0.8% The same for 2003. Source: U.S. Bureau of Economic Analysis, Total full-time and part-time employment by industry, counties, 2001 to 2022 (table CAEMP25N)
- -4.0% and -4.3% The same for 2009, the exception. Source: U.S. Bureau of Economic Analysis, Total full-time and part-time employment by industry, counties, 2001 to 2022 (table CAEMP25N)
- -5.9% and -2.8% The same for 2020. Source: U.S. Bureau of Economic Analysis, Total full-time and part-time employment by industry, counties, 2001 to 2022 (table CAEMP25N)
Strongest evidence against. 2009 hit the suburbs harder, and in 2010 Multnomah County lost only 169 jobs while the other three counties lost 0.4%, so the pattern is not a rule. From 2010 to 2015 the center recovered in full. The comparison cities were not checked year by year.
Sources: U.S. Bureau of Economic Analysis, Total full-time and part-time employment by industry, counties, 1969 to 2000 (table CAEMP25S); U.S. Bureau of Economic Analysis, Total full-time and part-time employment by industry, counties, 2001 to 2022 (table CAEMP25N)
This decline is a different kind from 1979 to 1987 and 1997 to 2003: those were falls in income across the whole region, heaviest in Washington County, while since 2019 income per person in Multnomah County has risen slightly against the national average.
3 figures, with sources and method
- -11.1, -15.0, -7.4 and -5.8 points Change in income per person as a percent of the U.S. figure, 1979 to 1987: Multnomah, Washington, Clackamas and Clark counties. How it was worked out: County per capita personal income divided by the U.S. figure, times 100, in the later year less the earlier year. Source: U.S. Bureau of Economic Analysis, County and metro area personal income summary, 1969 to 2024 (table CAINC1)
- -6.4, -12.4, -9.5 and -8.6 points The same for 1997 to 2003. Source: U.S. Bureau of Economic Analysis, County and metro area personal income summary, 1969 to 2024 (table CAINC1)
- +0.9 points (107.0% to 107.9% of the U.S. figure) The same for Multnomah County, 2019 to 2024. Source: U.S. Bureau of Economic Analysis, County and metro area personal income summary, 1969 to 2024 (table CAINC1)
Strongest evidence against. Income per person can hold up while people with lower incomes leave, because it is an average of those who remain. The figures are not adjusted for differences in the cost of living.
Office jobs grew in the parts of Portland more than 2 miles from downtown, by 21.8% from 2019 to 2024, under the same City taxes that apply downtown.
2 figures, with sources and method
- 29,221 and 35,603 (+21.8%) Office-type jobs in the City of Portland beyond 2 miles from the downtown center, 2019 and 2024. How it was worked out: Jobs in information, finance and insurance, real estate, professional services and management of companies, in City of Portland blocks more than 2 miles from the downtown point, summed. Source: U.S. Census Bureau, LEHD Origin-Destination Employment Statistics (LODES), version 8, Workplace Area Characteristics; U.S. Census Bureau, LODES version 8 geography crosswalk
- 49,680 and 41,416 (-16.6%) Office-type jobs within 0.75 mile of the downtown center, 2019 and 2024. How it was worked out: The same sectors in blocks within 0.75 mile of the downtown point. Source: U.S. Census Bureau, LEHD Origin-Destination Employment Statistics (LODES), version 8, Workplace Area Characteristics; U.S. Census Bureau, LODES version 8 geography crosswalk
Strongest evidence against. Jobs follow the address an employer reports, and staff who now work remotely and are reported at home would look the same in these counts. Outside downtown the city as a whole still lost ground: all jobs beyond 2 miles fell 0.7% while the suburbs grew. Office jobs in the same outer band grew 22.0% in Seattle, 29.0% in Denver and 21.0% in Minneapolis, so Portland's gain there is typical and does not by itself show that taxes had no effect.
Sources: U.S. Census Bureau, LEHD Origin-Destination Employment Statistics (LODES), version 8, Workplace Area Characteristics; U.S. Census Bureau, LODES version 8 geography crosswalk
Oregon outside the Portland area added jobs from 2019 to 2025 about as fast as Colorado outside Denver and faster than Minnesota outside the Twin Cities, though more slowly than Washington outside Seattle.
4 figures, with sources and method
- +5.7% Change in jobs in Oregon outside the Portland area, 2019 to 2025. How it was worked out: Statewide employment less the employment of Multnomah, Washington, Clackamas, Yamhill and Columbia counties. Source: U.S. Bureau of Labor Statistics, Quarterly Census of Employment and Wages, annual averages by industry; U.S. Census Bureau, Metropolitan and Micropolitan Statistical Area Population Totals, Vintage 2025
- +5.6% Change in jobs in Colorado outside the Denver area, 2019 to 2025. How it was worked out: Statewide employment less the ten Denver metro counties. Source: U.S. Bureau of Labor Statistics, Quarterly Census of Employment and Wages, annual averages by industry; U.S. Census Bureau, Metropolitan and Micropolitan Statistical Area Population Totals, Vintage 2025
- +3.6% Change in jobs in Minnesota outside the Twin Cities area, 2019 to 2025. How it was worked out: Statewide employment less the Minnesota counties of the Minneapolis-St. Paul metro area. Source: U.S. Bureau of Labor Statistics, Quarterly Census of Employment and Wages, annual averages by industry; U.S. Census Bureau, Metropolitan and Micropolitan Statistical Area Population Totals, Vintage 2025
- +9.5% Change in jobs in Washington outside the Seattle area, 2019 to 2025. How it was worked out: Statewide employment less King, Snohomish and Pierce counties. Source: U.S. Bureau of Labor Statistics, Quarterly Census of Employment and Wages, annual averages by industry; U.S. Census Bureau, Metropolitan and Micropolitan Statistical Area Population Totals, Vintage 2025
Strongest evidence against. Washington outside Seattle grew almost 4 points faster than Oregon outside Portland. Steady growth outside the metro area also cannot show that state policy has no effect inside it, where high earners and company headquarters are.
Sources: U.S. Bureau of Labor Statistics, Quarterly Census of Employment and Wages, annual averages by industry; U.S. Census Bureau, Metropolitan and Micropolitan Statistical Area Population Totals, Vintage 2025
Within 0.75 miles of the center of downtown, office-type jobs fell by 8,264 from 2019 to 2024 and restaurant, hotel and shop jobs fell by 6,031, while government jobs rose by 394.
4 figures, with sources and method
- 49,680 and 41,416 (-8,264, -16.6%) Office-type jobs within 0.75 mile of the downtown center, 2019 and 2024. How it was worked out: Jobs in information, finance and insurance, real estate, professional services and management of companies, summed over City of Portland census blocks whose center is within 0.75 mile of latitude 45.5189, longitude -122.6793. Source: U.S. Census Bureau, LEHD Origin-Destination Employment Statistics (LODES), version 8, Workplace Area Characteristics; U.S. Census Bureau, LODES version 8 geography crosswalk
- 22,360 and 16,329 (-6,031, -27.0%) Restaurant, hotel and shop jobs in the same area, 2019 and 2024. How it was worked out: Jobs in retail, arts and recreation, accommodation and food services, and other services, on the same blocks. Source: U.S. Census Bureau, LEHD Origin-Destination Employment Statistics (LODES), version 8, Workplace Area Characteristics; U.S. Census Bureau, LODES version 8 geography crosswalk
- 6,108 and 6,502 (+394) Government jobs in the same area, 2019 and 2024. How it was worked out: Public administration jobs on the same blocks. Source: U.S. Census Bureau, LEHD Origin-Destination Employment Statistics (LODES), version 8, Workplace Area Characteristics; U.S. Census Bureau, LODES version 8 geography crosswalk
- -2,015 and -523 Health and education jobs, and all other jobs, in the same area, change 2019 to 2024. How it was worked out: The five groups add to the whole change of -16,439 in claim P2. Source: U.S. Census Bureau, LEHD Origin-Destination Employment Statistics (LODES), version 8, Workplace Area Characteristics; U.S. Census Bureau, LODES version 8 geography crosswalk
Strongest evidence against. The job records place a job at the address an employer reports, so some of the office loss may be staff now reported elsewhere (see K2). 2019 was a peak year downtown.
Sources: U.S. Census Bureau, LEHD Origin-Destination Employment Statistics (LODES), version 8, Workplace Area Characteristics; U.S. Census Bureau, LODES version 8 geography crosswalk
From 2010 to 2015 Multnomah County added jobs as fast as the typical comparable county, which was the exception: in 14 of the 18 years from 2002 to 2019 it grew more slowly.
3 figures, with sources and method
- +14.0% and +13.7% Change in jobs, 2010 to 2015: Multnomah County and the typical comparable county. How it was worked out: Annual average employment in 2015 divided by 2010, less one. The typical comparable county is the middle one of the nine central counties: King, Denver, Hennepin and Ramsey together, Franklin, San Diego, Maricopa, Salt Lake, Travis and Wake. Source: U.S. Bureau of Labor Statistics, Quarterly Census of Employment and Wages, annual averages by industry; U.S. Bureau of Labor Statistics, Quarterly Census of Employment and Wages, County High-Level files
- 14 of 18 Years from 2002 to 2019 in which Multnomah County's jobs grew more slowly than the typical comparable county's. How it was worked out: Each county's yearly percent change in annual average employment; Multnomah compared with the middle value of the nine. Taken from the saved output of the analysis and not recomputed for this page. Source: U.S. Bureau of Labor Statistics, Quarterly Census of Employment and Wages, County High-Level files
- 6.2 and 8.3; 8.1 and 4.8; 8.7 and 8.5; 7.8 and 10.1 Homes approved for every 1,000 residents, City of Portland and the typical comparison city, 2013, 2014, 2018 and 2019. How it was worked out: Units authorized in the year divided by the city's population. Portland was above the middle of the nine cities in each year from 2014 to 2018, and below it in 2013 and 2019. Source: U.S. Census Bureau, Building Permits Survey, annual files; U.S. Census Bureau, City and Town Population Totals, Vintage 2025
Strongest evidence against. Portland's city permits were above the typical comparison city only from 2014 to 2018. In 2013 they were below it. Counted by county, Multnomah was above the middle in 2013 to 2015, 2017 and 2018 and below it in 2016 and 2019.
Sources: U.S. Bureau of Labor Statistics, Quarterly Census of Employment and Wages, annual averages by industry; U.S. Bureau of Labor Statistics, Quarterly Census of Employment and Wages, County High-Level files; U.S. Census Bureau, Building Permits Survey, annual files; U.S. Census Bureau, City and Town Population Totals, Vintage 2025
From 2015 to 2019 Multnomah County fell behind comparable counties on jobs, residents and new businesses, and by 2019 it had about 16,200 fewer jobs than it would have had at the typical county's pace.
6 figures, with sources and method
- +8.3% and +11.7% Change in jobs, 2015 to 2019: Multnomah County and the typical comparable county. How it was worked out: Annual average employment in 2019 divided by 2015, less one. Two of the nine grew more slowly: Hennepin and Ramsey (5.1%) and Franklin (6.1%). Source: U.S. Bureau of Labor Statistics, Quarterly Census of Employment and Wages, annual averages by industry
- 16,179 Jobs Multnomah County was short of the typical comparable county's path by 2019. How it was worked out: Multnomah's 2015 jobs times the middle growth rate of the nine, less its 2019 jobs. Source: U.S. Bureau of Labor Statistics, Quarterly Census of Employment and Wages, annual averages by industry
- +1.4% and +24.6%; last of ten Change in business applications, 2015 to 2019: Multnomah County and the typical comparable county. How it was worked out: Applications in 2019 divided by 2015, less one. From 2014 the figures are +18.9% and +32.8%. Source: U.S. Census Bureau, Business Formation Statistics, annual business applications by county
- Third quarter of 2016 (2.2% against 3.2%, ninth of ten) First quarter in which Multnomah County's yearly job growth fell clearly below the comparison counties'. How it was worked out: Jobs in the quarter compared with the same quarter a year earlier. Taken from the saved output of the analysis and not recomputed for this page. Source: U.S. Bureau of Labor Statistics, Quarterly Census of Employment and Wages, County High-Level files
- +5.6, -1.5 and -3.6 Net moves between Multnomah County and the rest of the United States for every 1,000 residents, 2016, 2017 and 2018. How it was worked out: Net domestic migration in the year to July divided by population, from the Census Bureau's 2010 to 2019 county estimates. The 2018 figure was the lowest of the ten counties. Source: U.S. Census Bureau, County Population Totals and Components of Change, 2010 to 2020
- +3.3% and +4.8% Change in city population, 2015 to 2019: Portland and the typical comparison city. Source: U.S. Census Bureau, City and Town Population Totals, Vintage 2025
Strongest evidence against. On jobs and population Multnomah County stayed inside the range of the nine until 2020. Income per person and the size of the county's economy kept pace through 2019.
Sources: U.S. Bureau of Labor Statistics, Quarterly Census of Employment and Wages, annual averages by industry; U.S. Bureau of Labor Statistics, Quarterly Census of Employment and Wages, County High-Level files; U.S. Census Bureau, Business Formation Statistics, annual business applications by county; U.S. Census Bureau, County Population Totals and Components of Change, 2010 to 2020; U.S. Census Bureau, City and Town Population Totals, Vintage 2025
From 2019 to 2025 Portland ranks last of the ten on jobs, city population and the size of its economy, against all nine cities and against the three most similar.
7 figures, with sources and method
- -4.9%, +6.0% and +0.2% Change in jobs, 2019 to 2025: Multnomah County, the typical comparable county, and the middle of King, Denver, and Hennepin and Ramsey. How it was worked out: The typical comparable county is the middle one of the nine central counties: King, Denver, Hennepin and Ramsey together, Franklin, San Diego, Maricopa, Salt Lake, Travis and Wake. Source: U.S. Bureau of Labor Statistics, Quarterly Census of Employment and Wages, annual averages by industry
- 57,054 and 26,735 Jobs Multnomah County is short of the typical comparable county, and of the middle of the three most similar. How it was worked out: Multnomah's 2019 jobs times the comparison growth rate, less its 2025 jobs. Source: U.S. Bureau of Labor Statistics, Quarterly Census of Employment and Wages, annual averages by industry
- +0.1%, +6.2% and +1.5% Change in jobs, 2019 to 2025: the seven-county Portland region, the typical comparable region, and the middle of the three most similar. How it was worked out: County employment added up for each metro area. Source: U.S. Bureau of Labor Statistics, Quarterly Census of Employment and Wages, annual averages by industry
- 74,092 and 16,928 Jobs the region is short of the typical comparable region, and of the middle of the three most similar. How it was worked out: The region's 2019 jobs times the comparison growth rate, less its 2025 jobs. Source: U.S. Bureau of Labor Statistics, Quarterly Census of Employment and Wages, annual averages by industry
- -2.4% and +4.5% Change in city population, 2019 to 2025: Portland and the typical comparison city. Source: U.S. Census Bureau, City and Town Population Totals, Vintage 2025
- +5.5% and +24.6% Change in the central county's economic output after inflation, 2019 to 2024: Multnomah and the typical comparable county. Source: U.S. Bureau of Economic Analysis, County and metro area gross domestic product summary, 2001 to 2024 (table CAGDP1)
- +3.9% and +4.6% Change in jobs outside the central county, 2019 to 2025: the Portland region and the middle of the three most similar regions. How it was worked out: Metro employment less central county employment. Taken from the saved output of the analysis and not recomputed for this page. Source: U.S. Bureau of Labor Statistics, Quarterly Census of Employment and Wages, annual averages by industry
Strongest evidence against. Five of the nine comparison cities are fast-growing cities in the Sun Belt and Mountain West, which widens every gap. Against the three most similar the jobs gap is 27,000 instead of 57,000 for the county and 17,000 instead of 74,000 for the region.
Sources: U.S. Bureau of Labor Statistics, Quarterly Census of Employment and Wages, annual averages by industry; U.S. Census Bureau, City and Town Population Totals, Vintage 2025; U.S. Bureau of Economic Analysis, County and metro area gross domestic product summary, 2001 to 2024 (table CAGDP1)
Portland's homicide rate stayed low until 2020, was the fourth lowest of the ten cities in 2019, and then more than tripled; only Columbus rose more in homicides for every 100,000 residents.
4 figures, with sources and method
- 4.2, 4.5 and 15.1 Homicides for every 100,000 residents in Portland, 2014, 2019 and 2022. How it was worked out: Offenses divided by the population the police agency covers, times 100,000. These are the figures drawn in the chart. Source: Federal Bureau of Investigation, Crime Data Explorer, summarized offense counts by police agency
- Rank of Portland's 2019 homicide rate among the ten cities. Fourth lowest, after Austin (3.3), San Diego (3.5) and Seattle (3.9) Source: Federal Bureau of Investigation, Crime Data Explorer, summarized offense counts by police agency
- 10.3 and 4.9 for every 100,000 residents Rise in the homicide rate from 2019 to each city's highest year after it: Portland and the typical comparison city. How it was worked out: Rates calculated with Census city population estimates, which give Portland 4.6 in 2019 and 14.9 in 2022. With the population the police agency reports, the chart's figures, the rise is 10.6. Columbus rose 13.5. Source: Federal Bureau of Investigation, Crime Data Explorer, summarized offense counts by police agency; U.S. Census Bureau, City and Town Population Totals, Vintage 2025
- Above every comparison city in every year, 2021 to 2025 Portland's homicide rate against its 2017 to 2019 average, each year from 2021. How it was worked out: Each city's rate divided by its own 2017 to 2019 average. Taken from the saved output of the analysis and not recomputed for this page. Source: Federal Bureau of Investigation, Crime Data Explorer, summarized offense counts by police agency
Strongest evidence against. Portland has never had the highest homicide rate of the ten. Its 2025 rate of 7.9 was below Minneapolis's and Columbus's.
Sources: Federal Bureau of Investigation, Crime Data Explorer, summarized offense counts by police agency; U.S. Census Bureau, City and Town Population Totals, Vintage 2025
Violent crime in Portland was rising before 2020, faster than in most comparison cities, though its rate stayed below several of them.
5 figures, with sources and method
- +17% (473 to 553) and +3% Change in violent offenses for every 100,000 residents, 2014 to 2019: Portland and the typical comparison city, on the figures in the chart. How it was worked out: Offenses divided by the population the police agency covers, times 100,000. The typical city is the middle of the eight with a complete 2014 count; Raleigh is left out. Source: Federal Bureau of Investigation, Crime Data Explorer, summarized offense counts by police agency
- +20% and +6% The same change with Census city population estimates. How it was worked out: Minneapolis and St. Paul counted together. Source: Federal Bureau of Investigation, Crime Data Explorer, summarized offense counts by police agency; U.S. Census Bureau, City and Town Population Totals, Vintage 2025
- Denver and Phoenix only Comparison cities where violent crime rose more from 2014 to 2019. Source: Federal Bureau of Investigation, Crime Data Explorer, summarized offense counts by police agency
- 704, 706, 791, 864 and 882 Violent offenses for every 100,000 residents in 2025: Portland, Seattle, Minneapolis and St. Paul together, Salt Lake City and Denver. How it was worked out: The same series as the chart, which counts the Minneapolis and St. Paul police departments together. Source: Federal Bureau of Investigation, Crime Data Explorer, summarized offense counts by police agency
- 132 and 102, with the earlier average set to 100 Portland's 2025 violent crime rate against its 2017 to 2019 average, and the typical comparison city's. How it was worked out: The 2025 rate divided by the mean of the 2017, 2018 and 2019 rates. Source: Federal Bureau of Investigation, Crime Data Explorer, summarized offense counts by police agency
Strongest evidence against. Portland's 2015 count is incomplete and is left out, so the rise is measured from 2014. In level Portland stayed below the middle of the ten through 2019.
Sources: Federal Bureau of Investigation, Crime Data Explorer, summarized offense counts by police agency; U.S. Census Bureau, City and Town Population Totals, Vintage 2025
Car theft in Portland rose 107% from 2014 to 2017 and was the highest of the ten cities from 2017 to 2019; car thefts in the rest of Oregon rose 52% over the same years.
3 figures, with sources and method
- 545 and 1,131 (+107%) Car thefts for every 100,000 residents in Portland, 2014 and 2017. How it was worked out: Offenses divided by the population the police agency covers, times 100,000. Source: Federal Bureau of Investigation, Crime Data Explorer, summarized offense counts by police agency; U.S. Census Bureau, City and Town Population Totals, Vintage 2025
- Highest each year Rank of Portland's car theft rate among the cities with a complete count, 2017, 2018 and 2019. Source: Federal Bureau of Investigation, Crime Data Explorer, summarized offense counts by police agency; U.S. Census Bureau, City and Town Population Totals, Vintage 2025
- +116% and +52% Change in the number of car thefts, 2014 to 2017: Portland, and Oregon outside Portland. How it was worked out: Counts reported by the Portland Police Bureau, and by all reporting Oregon agencies less Portland. State totals depend on which agencies reported each year. Source: Federal Bureau of Investigation, Crime Data Explorer, summarized offense counts by police agency
Strongest evidence against. The statewide comparison uses counts where the city figures are rates, and the set of agencies reporting changed from year to year.
Sources: Federal Bureau of Investigation, Crime Data Explorer, summarized offense counts by police agency; U.S. Census Bureau, City and Town Population Totals, Vintage 2025
The rate of people sleeping outside rose by 24.6 for every 10,000 residents in Multnomah County from 2019 to 2023, more than in any comparison area; the typical one rose by 1.9.
3 figures, with sources and method
- 25.1 and 49.7 People sleeping outside for every 10,000 residents, Portland, Gresham and Multnomah County, 2019 and 2023. How it was worked out: The unsheltered count divided by county population, times 10,000. Source: U.S. Department of Housing and Urban Development, 2007 to 2025 Point-in-Time Estimates by Continuum of Care; U.S. Census Bureau, County Population Totals and Components of Change, Vintage 2025
- 1.9 and 10.5 Rise in that rate, 2019 to 2023, in the typical comparison area and in the highest, Seattle and King County. How it was worked out: The middle value of the nine count areas. Where an area ran no street count in 2023 the latest earlier count is used. Source: U.S. Department of Housing and Urban Development, 2007 to 2025 Point-in-Time Estimates by Continuum of Care; U.S. Census Bureau, County Population Totals and Components of Change, Vintage 2025
- 8% Share of Portland's rise that was shared. How it was worked out: 1.9 divided by 24.6. Source: U.S. Department of Housing and Urban Development, 2007 to 2025 Point-in-Time Estimates by Continuum of Care; U.S. Census Bureau, County Population Totals and Components of Change, Vintage 2025
Strongest evidence against. The comparison areas are not the same shape: Denver's covers seven counties and Minneapolis's is Hennepin County alone.
Sources: U.S. Department of Housing and Urban Development, 2007 to 2025 Point-in-Time Estimates by Continuum of Care; U.S. Census Bureau, County Population Totals and Components of Change, Vintage 2025
After 2020 the average household leaving Multnomah County earned as much as the average household staying, which did not happen in Washington or Clackamas counties or in any comparison county.
4 figures, with sources and method
- 0.82, 0.98, 1.02 and 0.93 Average income of households that left divided by the average income of those that stayed, Multnomah County, moves of 2018-19, 2020-21, 2021-22 and 2022-23. How it was worked out: Adjusted gross income per return that moved out, divided by income per return that did not move. Series from 2011-12. Source: Internal Revenue Service, Statistics of Income, U.S. Population Migration Data, county-to-county flows
- 0.91 (Washington County, 2020-21) and 0.78 Highest value of that ratio in Washington and Clackamas counties in any year. Source: Internal Revenue Service, Statistics of Income, U.S. Population Migration Data, county-to-county flows
- 0.89 Highest value among the nine comparison counties in 2021-22. Source: Internal Revenue Service, Statistics of Income, U.S. Population Migration Data, county-to-county flows
- Number of very high-income households that could produce the jump. About 500 to 700 a year, each with income about $1 million above a typical leaver's How it was worked out: The rise in the ratio above the comparison counties' rise, times income per staying return, times the number of returns leaving, divided by $1 million. Taken from the saved output of the analysis and not recomputed for this page. Source: Internal Revenue Service, Statistics of Income, U.S. Population Migration Data, county-to-county flows
Strongest evidence against. The IRS publishes averages only, so a small number of very large incomes could produce the whole change. The files miss late filers, who tend to have high incomes.
Four facts weigh against a large tax effect: the loss began before the vote, the number of high-income returns kept rising, no larger share of households left than in comparable counties, and the excess is fading.
4 figures, with sources and method
- +$246 million, -$99 million and -$392 million Net income from moves, Multnomah County, 2015-16, 2016-17 and 2019-20. Source: Internal Revenue Service, Statistics of Income, U.S. Population Migration Data, county-to-county flows
- 26,910 and 37,620 Multnomah County returns with income of $200,000 or more, tax years 2019 and 2023. Source: Internal Revenue Service, Statistics of Income, Individual income tax returns, county data by size of adjusted gross income
- +0.06, -0.25 and +0.01 points Rise in the share of households leaving, over its earlier average, 2020-21 to 2022-23: Multnomah less King, Hennepin and Denver counties. How it was worked out: Returns moving out as a percent of returns, less the 2015-16 to 2018-19 average, for Multnomah and for the three counties together. Source: Internal Revenue Service, Statistics of Income, U.S. Population Migration Data, county-to-county flows
- 2.0, 1.7 and 0.9 points Rise in the share of income leaving Multnomah County, above the typical comparable county's rise, 2020-21, 2021-22 and 2022-23. How it was worked out: Income moving out as a percent of residents' income, less its 2015-16 to 2018-19 average; Multnomah's figure less the middle of the nine counties'. Source: Internal Revenue Service, Statistics of Income, U.S. Population Migration Data, county-to-county flows
Strongest evidence against. The $200,000 line is not adjusted for inflation, and the county's share of all such returns in the country fell 6.8% from 2019 to 2023 while the typical comparable county's rose.
Sources: Internal Revenue Service, Statistics of Income, U.S. Population Migration Data, county-to-county flows; Internal Revenue Service, Statistics of Income, Individual income tax returns, county data by size of adjusted gross income
Portland lost about the same share of its officers from 2019 to 2022 as the typical comparison city, though it started with fewer for its size than most.
4 figures, with sources and method
- -11.0% and -11.2% Change in sworn officers, 2019 to 2022: Portland and the typical comparison city. How it was worked out: The middle of seven: Seattle, Denver, Minneapolis and St. Paul together, San Diego, Phoenix, Salt Lake City and Austin. Source: Federal Bureau of Investigation, Crime Data Explorer, police employee counts by agency
- -23.9% and -22.5% The same change in Seattle, and in Minneapolis and St. Paul together. Source: Federal Bureau of Investigation, Crime Data Explorer, police employee counts by agency
- 1.34, 1.85 and 1.22 Officers for every 1,000 residents in 2019: Portland, the typical comparison city and San Diego. Source: Federal Bureau of Investigation, Crime Data Explorer, police employee counts by agency
- 168 officers, about 18% Portland's loss by the City's own count of filled positions, July 2020 to July 2022. How it was worked out: From the bureau's staffing reports. Taken from the saved output of the analysis and not recomputed for this page. Source: Portland Police Bureau, Police Staffing Numbers, open data
Strongest evidence against. The City's count shows a larger loss than the FBI's, and covers different months.
Sources: Federal Bureau of Investigation, Crime Data Explorer, police employee counts by agency; Portland Police Bureau, Police Staffing Numbers, open data
By the Census count, homes approved in Multnomah County fell 56% in 2020, two years before interest rates rose, and by 2025 the county had the lowest rate of the ten.
3 figures, with sources and method
- 7.5, 3.3 and 2.0 Homes approved for every 1,000 residents in Multnomah County, 2019, 2020 and 2025. How it was worked out: Units authorized in the year divided by county population, times 1,000. Source: U.S. Census Bureau, Building Permits Survey, annual files; U.S. Census Bureau, County Population Totals and Components of Change, Vintage 2025
- 7.0, 9.0, 8.3 and 6.4 The same for the typical comparable county, 2020, 2021, 2022 and 2025. Source: U.S. Census Bureau, Building Permits Survey, annual files; U.S. Census Bureau, County Population Totals and Components of Change, Vintage 2025
- 10,438 and 5,225, a difference of 5,213 Homes permitted in the City of Portland in 2021 and 2022: the City's own count and the Census count. How it was worked out: City count, leaving out accessory units: 5,363 and 5,075. Census count: 3,028 and 2,197. Source: City of Portland, Portland Permitting and Development, Report on Temporary SDC Exemptions for Housing, August 15, 2025 through January 15, 2026; U.S. Census Bureau, Building Permits Survey, annual files
Strongest evidence against. The City's own records put the collapse in 2023, after rates rose, and the two counts have not been reconciled. The difference for 2021 and 2022 is about 5,200 homes.
Sources: U.S. Census Bureau, Building Permits Survey, annual files; U.S. Census Bureau, County Population Totals and Components of Change, Vintage 2025; City of Portland, Portland Permitting and Development, Report on Temporary SDC Exemptions for Housing, August 15, 2025 through January 15, 2026
Over the five years to July 2025 Multnomah County lost residents to the rest of the country somewhat faster than Seattle's and Denver's counties, and gained far fewer from abroad.
3 figures, with sources and method
- 18.2, 57.8, 41.1, 28.2 and 41.1 Net arrivals from abroad for every 1,000 residents: Multnomah, King, Denver, and Hennepin and Ramsey counties, and the typical comparable county. How it was worked out: Each year's net international migration divided by the population the July before, five years added. San Diego County, at 17.6, is the only one lower. Source: U.S. Census Bureau, County Population Totals and Components of Change, Vintage 2025
- 46.1, 42.5, 34.9, 47.7 and 39.6 Net loss to the rest of the United States on the same basis. Source: U.S. Census Bureau, County Population Totals and Components of Change, Vintage 2025
- 13.2 and 15.0 Net arrivals from abroad for every 1,000 residents, 2016 to 2019: Multnomah and the typical comparable county. How it was worked out: From the Census Bureau's 2010 to 2020 estimates, a different edition from the later figures. Source: U.S. Census Bureau, County Population Totals and Components of Change, 2010 to 2020
Strongest evidence against. County figures for migration from abroad are estimates from a model. S6 uses the 2020 population as the base for all five years, which gives slightly different figures (17.8 and 45.5 for Multnomah).
Sources: U.S. Census Bureau, County Population Totals and Components of Change, Vintage 2025; U.S. Census Bureau, County Population Totals and Components of Change, 2010 to 2020
Portland's police response times did not move with its number of officers: from 2021 to 2025 the number of sworn officers rose from 791 to 814 while the average time to reach the most urgent calls rose from 12.2 to 19.5 minutes, and most of the added time was calls waiting for an officer to be assigned.
7 figures, with sources and method
- 908, 889, 791 and 814 Sworn officers on October 31: 2016, 2019, 2021 and 2025. How it was worked out: The FBI's yearly count of sworn officers employed by the Portland Police Bureau. Source: Federal Bureau of Investigation, Crime Data Explorer, police employee counts by agency
- 8.1, 8.3, 12.2 and 19.5 Average minutes to reach high-priority calls: 2016, 2019, 2021 and 2025. How it was worked out: Mean time from call received to arrival, for high-priority dispatched calls with a recorded response time. Source: Portland Police Bureau, Police Dispatched Calls, open data
- 1.9 and 10.8 Of that average, minutes waiting for an officer to be assigned: 2019 and 2025. How it was worked out: Mean time in the dispatch queue. The rise of 8.9 minutes is 79% of the 11.2-minute rise in the average. Source: Portland Police Bureau, Police Dispatched Calls, open data
- 6.4 and 8.6 Of that average, minutes travelling: 2019 and 2025. How it was worked out: Mean time from assignment to arrival. Source: Portland Police Bureau, Police Dispatched Calls, open data
- 6.5 and 9.9 Median minutes to reach high-priority calls: 2019 and 2025. How it was worked out: The middle call. It rose 52% while the average rose 135%, so the longest waits grew most. Source: Portland Police Bureau, Police Dispatched Calls, open data
- 76,877 and 57,733 (-25%) High-priority calls dispatched: 2019 and 2025. How it was worked out: Count of dispatched calls classed as high priority. Source: Portland Police Bureau, Police Dispatched Calls, open data
- -8%, -25% and +135% Change from 2019 to 2025: officers, high-priority calls, and average minutes. How it was worked out: Each 2025 figure divided by its 2019 figure, less one. Source: Federal Bureau of Investigation, Crime Data Explorer, police employee counts by agency; Portland Police Bureau, Police Dispatched Calls, open data
Strongest evidence against. The count covers all sworn officers. Fewer are on patrol and free to take a call. A call waits when no officer is available, so the number assigned to patrol on each shift, how long each call takes and how calls are classed all matter, and none of those is measured here. The officer count did fall 11% from 2019 to 2021, the two years in which response times first rose.
Sources: Federal Bureau of Investigation, Crime Data Explorer, police employee counts by agency; Portland Police Bureau, Police Dispatched Calls, open data
In spring 2023, the last time downtowns were compared against 2019, weekend visits to downtown Portland were at 71% of their 2019 level, against 79% in the typical comparable downtown. Downtown Portland Clean & Safe reports Saturday visits in 2025 at 88.6% of their 2019 number, a count with no comparison to other cities.
1 figure, with sources and method
- The latest published figures. University of Toronto, weekend visits in spring 2023 as a share of spring 2019: downtown Portland 70.6%, typical of the nine comparison downtowns 79.3%. That series has not been updated since October 2023. Downtown Portland Clean & Safe reports Saturday visits to its district in 2025 at 88.6% of 2019 (5,783,911 against 6,528,120). Source: University of Toronto School of Cities, Downtown Recovery: recovery by time of week, spring 2023
Strongest evidence against. The two figures are not comparable: different data provider, different boundary (Clean & Safe's 273 blocks against the university's downtown polygon), Saturdays against all weekend days, a year against a spring.
Sources: University of Toronto School of Cities, Downtown Recovery: recovery by time of week, spring 2023
Multnomah County’s job loss has continued. In March 2026, the latest month published, it had 484,384 jobs by a preliminary count, 6.1% fewer than in March 2019 and 2.2% fewer than in March 2025. On that March-to-March measure it ranks 47th of the central counties of the 50 largest metro areas instead of 48th, only because Washington, D.C. fell below it.
1 figure, with sources and method
- The latest published figures. Jobs, all ownerships, BLS QCEW, March 2019 to March 2026: Multnomah County 515,715 to 484,384, -6.1% (rank 47th of the same 50 central counties; only Cuyahoga County (Cleveland) -6.4%, the District of Columbia -7.5% and Shelby County (Memphis) -7.9% did worse). March 2025 to March 2026: Multnomah 495,143 to 484,384, -2.2%, 48th of 50 for the one-year change (District of Columbia -4.5% and Shelby -2.9% worse). Denver County +6.2%, King County +0.6%, Hennepin County -2.7%. On the first-quarter average instead of March alone: Multnomah -5.7%, also 47th. Source: U.S. Bureau of Labor Statistics, Quarterly Census of Employment and Wages, first quarter 2019, 2025 and 2026
Strongest evidence against. These are preliminary counts for one month. The rank moved from 48th to 47th only because Washington, D.C. fell below Multnomah County.
The gaps between Multnomah County and Hennepin and Ramsey counties on restaurant and factory jobs held into 2026. From March 2019 to March 2026, by preliminary counts, restaurant and hotel jobs were down 12.7% and 8.8%, and factory jobs 22.3% and 3.7%. Office jobs on the broad measure, which includes temporary help and call centers, were down 12.0% and 12.5%. No March 2026 figure was computed on the narrower measure.
1 figure, with sources and method
- The latest published figures. March 2019 to March 2026, private jobs unless noted, BLS QCEW. Office-type (information, financial activities, professional and business services): Multnomah County -12.0% (125,349 to 110,278); Hennepin and Ramsey counties -12.5% (389,097 to 340,541); Denver County +17.0%; King County +17.7%. All jobs, all ownerships: Multnomah -6.1%; Hennepin and Ramsey -2.7%. Leisure and hospitality: Multnomah -12.7% (57,894 to 50,532), last of the 50 central counties; Hennepin and Ramsey -8.8%. Manufacturing: Multnomah -22.3% (35,647 to 27,713), 45th of 47 with a published figure; Hennepin and Ramsey -3.7%. Source: U.S. Bureau of Labor Statistics, Quarterly Census of Employment and Wages, first quarter 2019 and 2026, supersector slices
Strongest evidence against. These are preliminary counts for one month against the same month of 2019. Yearly averages may differ. The office figure is the broad measure, on which the two places have matched since 2025. The gap on restaurant and hotel jobs is narrower on this basis (12.7% against 8.8%) than on yearly averages (12.2% against 5.7%).
The Portland region’s gap with comparison regions widened in early 2026. In March 2026 the seven-county region had 0.7% fewer jobs than in March 2019, where the full-year 2025 figure was 0.1% more. A separate monthly survey shows the region still losing jobs in September 2026, 7,700 fewer than a year earlier, though the loss has shrunk every month since June.
1 figure, with sources and method
- The latest published figures. QCEW, March 2019 to March 2026: Multnomah County -6.1%, typical of the nine central counties +6.2% (range -2.7% Hennepin and Ramsey to +21.0% Travis); seven-county Portland region -0.7% (1,196,819 to 1,188,937), typical of the nine regions +7.5% (range -0.2% Minneapolis-St. Paul to +24.8% Austin); Portland last of ten on both. Different series, BLS Current Employment Statistics, metro area, not seasonally adjusted, September 2026 (preliminary): Portland metro 1,222,100 jobs, 0.7% below September 2019 and 7,700 below September 2025; Seattle +15,000, Denver +4,100 and Minneapolis-St. Paul +22,500 over the same year. Portland's loss from a year earlier was 35,400 in April 2026 and has narrowed each month since June. Source: U.S. Bureau of Labor Statistics, Quarterly Census of Employment and Wages, first quarter 2019 and 2026; State and Area Employment (CES), series SMU41389000000000001
Strongest evidence against. The March figures are preliminary counts for one month and are not comparable with the full-year gaps. The September 2026 figure is from a survey and is preliminary.
County payroll counts run to March 2026 and show Multnomah County still losing jobs, 2.2% in the year to March 2026.
1 figure, with sources and method
- The latest published figures. County payroll counts now run to March 2026 (Multnomah County -2.2% from March 2025). Block-level counts still end in 2024: the Census Bureau's LODES directory for Oregon lists 2024 as the last year. Source: U.S. Bureau of Labor Statistics; U.S. Census Bureau, QCEW first quarter 2026; LODES8 Oregon workplace files directory
Strongest evidence against. The March 2026 county counts are preliminary. Block-level counts still end in 2024.
The average time for Portland police to reach the most urgent calls rose 135% from 2019 to 2025 and has barely moved since: in the first ten months of 2026 it was 18.9 minutes, against 19.1 in the same months of 2025 and 8.3 in the same months of 2019.
1 figure, with sources and method
- The latest published figures. Portland Police Bureau dispatched calls, high priority, January to October of each year: average minutes from call to arrival 8.3 (2019), 19.7 (2023), 20.1 (2024), 19.1 (2025), 18.9 (2026). Median minutes 6.5, 9.6, 10.2, 9.9, 9.8. Of the 2026 average, 10.5 minutes waiting for an officer to be assigned and 8.3 travelling (2025: 10.5 and 8.6). High-priority calls dispatched January to October: 64,445 (2019), 48,316 (2025), 48,802 (2026). Monthly averages in 2026 ran from 16.7 minutes in March to 22.8 in August; October was 18.7. Source: Portland Police Bureau, Dispatched Calls for Service open data, 2026 (updated after the 5th of each month)
Strongest evidence against. Partial year. Summer months are slower, so ten months including summer compare fairly only with the same ten months. The 2026 file will keep changing until the year closes.
The Portland Police Bureau reported 815 sworn members on November 5, 2026, of whom 305 officers are assigned to patrol, and it estimates that 55 are working across the city at a given time.
1 figure, with sources and method
- The latest published figures. Portland Police Bureau staffing page, data current as of November 5, 2026: 815 sworn members of all ranks against 877 authorized (62 vacancies); 567 at the rank of officer; 305 officers assigned to patrol; an estimated 55 patrol officers working citywide at a given time. Source: Portland Police Bureau, Police Staffing Numbers (PPB Sworn Staffing Report)
Strongest evidence against. The Bureau's count and the FBI's count are taken on different dates and may define sworn staff differently; they agree to within one officer for late 2025 and late 2026.
Sources: Portland Police Bureau, Police Staffing Numbers (PPB Sworn Staffing Report)
By 2025 Portland had 8.4% fewer sworn police officers than in 2019, a smaller loss than in the typical comparison city (15.0%). Seattle was 24.9% below and Minneapolis and St. Paul together 21.6%.
1 figure, with sources and method
- The latest published figures. Change in sworn officers, 2019 to 2025, FBI count: Portland -8.4% (889 to 814); Seattle -24.9%; Minneapolis and St. Paul together -21.6%; Austin -17.5%; Phoenix -15.0%; San Diego -0.4%; Denver +0.7%; Salt Lake City +17.1%. Typical of the seven: -15.0%. Source: Federal Bureau of Investigation, Crime Data Explorer, police employee counts
Strongest evidence against. The count is of all sworn officers, and Columbus and Raleigh are left out because their counts are not reliable.
Sources: Federal Bureau of Investigation, Crime Data Explorer, police employee counts
Partial figures for 2026 show homicides in Portland still falling. The Portland Police Bureau recorded 24 homicide offenses from January through October 2026, against 39 in the same months of 2025, 80 in 2022 and 26 in 2019. Violent offenses of all kinds were 3,716 in those months, 2.0% fewer than in 2025 and 19.5% more than in 2019, because aggravated assaults (2,636) remain well above their 2019 number (1,907). These are the Bureau's own counts for ten months. The chart uses the FBI's yearly figures.
1 figure, with sources and method
- The latest published figures. Portland Police Bureau reported offenses, by month of report, January to October of each year. Homicide offenses (murder and non-negligent manslaughter): 26 (2019), 44 (2020), 72 (2021), 80 (2022), 59 (2023), 62 (2024), 39 (2025), 24 (2026). Violent offenses (homicide, rape, robbery, aggravated assault): 3,110 (2019), 3,450 (2020), 4,427 (2021), 4,414 (2022), 3,979 (2023), 3,913 (2024), 3,793 (2025), 3,716 (2026). In 2026: aggravated assault 2,636 (2025: 2,621; 2019: 1,907), robbery 772 (842; 818), rape 284 (291; 359). Source: Portland Police Bureau, Reported crime open data, offense file for 2026
Strongest evidence against. Partial year, counted by the month a report was filed, which can be later than the month of the crime. The Bureau's offense counts are not the FBI's homicide counts in the chart and are not rates, so they cannot be added to the chart line.
Sources: Portland Police Bureau, Reported crime open data, offense file for 2026
Multnomah County approved 1,476 homes in the first nine months of 2026, 30.7% more than in the same months of 2025. Over those nine months that is 1.9 homes for every 1,000 residents against 4.0 in the typical comparable county, the lowest of the ten, and 65% below the first nine months of 2019.
1 figure, with sources and method
- The latest published figures. Census Building Permits Survey, homes approved January to September. Multnomah County: 1,476 in 2026 (614 of them in buildings of five or more units) against 1,129 in 2025 (282), up 30.7%; 1,368 in 2024; 2,392 in 2022; 4,239 in 2019. For every 1,000 residents over those nine months: Multnomah 1.86 in 2026 (1.42 in 2025; 5.33 in 2019), the lowest of the ten; typical comparable county 4.01 (range 2.08 Hennepin and Ramsey to 9.42 Wake). Change from the same months of 2025: Denver +52.4%, King +47.9%, Multnomah +30.7%, Hennepin and Ramsey +16.2%, Wake +5.5%, Salt Lake -3.4%, Travis -4.1%, Maricopa -12.9%, San Diego -14.2%, Franklin -23.5%. Source: U.S. Census Bureau, Building Permits Survey, county year-to-date files, September 2019, 2022, 2024, 2025 and 2026
Strongest evidence against. These are nine-month figures, so the rates for every 1,000 residents cannot be compared with the yearly rates in the chart. Monthly figures are revised when the yearly file is published.
Portland loosened its affordable housing mandate in January 2024 and waived development fees in July 2025. Approvals kept falling through 2025, then rose: the Census count shows 614 apartments approved in the first nine months of 2026, against 282 in the same months of 2025. That is still far below the 2015 to 2019 pace.
1 figure, with sources and method
- The latest published figures. City of Portland, Census Building Permits Survey, homes approved January to September: 1,250 in 2026, of which 614 in buildings of five or more units, against 857 and 282 in the same months of 2025. Source: U.S. Census Bureau, Building Permits Survey, place year-to-date files, West Region, September 2024, 2025 and 2026
Strongest evidence against. A rise after the fee waiver is what the mandate-and-cost explanation would predict, though one partial year proves little and King and Denver counties rose more over the same months without such a change. The City's own permit count for 2026 was not checked.
Oregon’s overdose deaths began falling in spring 2024, about five months before criminal penalties for drug possession returned. By the 12 months ending August 2025, the latest period with complete reports, they were 26% below the peak by the CDC’s provisional count, against a 29% fall nationally and 10% in Washington.
1 figure, with sources and method
- The latest published figures. CDC provisional counts, deaths in the 12 months ending in each month, adjusted by CDC for reporting delay. Oregon: 1,912 in the 12 months to March 2024 (44.8 for every 100,000 residents, the peak), 1,534 to December 2024, 1,418 to August 2025 (33.2), which is 26% below the peak. Washington: 3,553 to March 2024, 3,183 to August 2025, 10% lower. United States: 103,192 and 72,889, 29% lower. Oregon's later months are incomplete: for the 12 months to June 2026 the file shows 535 deaths reported and 758 predicted, with 2.7% of records still under investigation. Source: Centers for Disease Control and Prevention, National Center for Health Statistics, VSRR Provisional Drug Overdose Death Counts (state)
Strongest evidence against. These are provisional counts. Figures for periods ending after August 2025 are incomplete: the share of Oregon deaths still under investigation rises from 0.1% to 2.7%, and the CDC marks the 2026 months as underreported.
By the CDC’s provisional count, overdose deaths among Multnomah County residents fell from 669 in the 12 months to March 2024 to 480 in the 12 months to September 2025. At 60 for every 100,000 residents that was still the highest rate of the ten central counties, where the typical rate was 26.
1 figure, with sources and method
- The latest published figures. CDC provisional county counts, deaths of residents in 12 months. Multnomah County: 669 in the 12 months to March 2024 (84.2 for every 100,000 residents), 535 to December 2024 (67.3), 480 to September 2025 (60.3), which is 28% below March 2024. Typical of the nine comparison counties in the 12 months to September 2025: 25.7 (range 11.9 Wake to 50.0 Denver); Multnomah is the highest of the ten. King 39.4, Denver 50.0, Hennepin and Ramsey 28.0, Maricopa 40.3. The file shows 315 for Multnomah in the 12 months to March 2026 (39.6), with 3.5% of records pending, which is incomplete. Source: Centers for Disease Control and Prevention, National Center for Health Statistics, VSRR Provisional County-Level Drug Overdose Death Counts
Strongest evidence against. These are provisional counts.
After 2019 applications to start a business rose everywhere. From 2019 to 2025 Multnomah County’s rose 65.9% and the typical comparable county’s 74.4%, so the county is no longer unusual on this measure: it ranks 7th of the ten.
1 figure, with sources and method
- The latest published figures. Census Business Formation Statistics, county file, applications to start a business. 2019 to 2025: Multnomah +65.9% (to 16,110), typical of the nine +74.4% (range +39.2% Salt Lake to +133.8% Travis), 7th of ten. 2024 to 2025: Multnomah +22.9%, typical +13.5%, 3rd of ten. No county figures exist for 2026. Oregon statewide, January to October, not seasonally adjusted: 56,862 in 2026 against 54,241 in 2025 (+4.8%) and 33,888 in 2019; United States +10.9% on 2025; Washington -18.5%. Source: U.S. Census Bureau, Business Formation Statistics: county annual applications; monthly applications by state
Strongest evidence against. No county figures exist for 2026. The national surge in applications after 2020 includes many filings that never become employers. The later figures weigh mildly against reading weak business formation as a continuing Portland problem.
In 2025 felony cases filed in Multnomah County were 6% above their 2019 level, and cases for minor offenses were 35% below it after rising from 2,540 in 2022 to 5,710.
1 figure, with sources and method
- The latest published figures. Oregon Judicial Department, cases filed in circuit court, 2019 = 100. Felonies: Multnomah 107.1 in 2023, 99.6 in 2024, 106.2 in 2025 (3,625 cases against 3,413 in 2019); Washington 80.8, 89.8, 81.9; Clackamas 73.6, 74.4, 67.5. Misdemeanors: Multnomah 28.8 in 2022, 48.8 in 2023, 64.4 in 2024, 64.7 in 2025 (5,710 against 8,824 in 2019); Washington 85.9, 87.7, 111.5, 128.9; Clackamas 83.2, 83.8, 102.3, 110.4. Source: Oregon Judicial Department, State Trial Courts, Cases Filed, 2024 and 2025
Strongest evidence against. A new district attorney took office in January 2025, so the 2025 figures do not describe the same office-holder as 2020 to 2024. These are counts of cases filed, read from the court’s yearly tables.
Sources: Oregon Judicial Department, State Trial Courts, Cases Filed, 2024 and 2025
Rents in Multnomah County rose 29% from 2019 to 2025, against 37% in comparison counties, and 6.8% of its apartments were empty in 2025, among the highest shares of the ten.
1 figure, with sources and method
- The latest published figures. Median gross rent, 2019 to 2025: Multnomah County +29.3% ($1,312 to $1,696); typical of the nine comparison counties +37.4% (range +27.0% King to +54.3% Maricopa). Share of rental homes empty in 2025: Multnomah County 6.8%, the highest of the ten (Salt Lake 6.3%, Maricopa 6.2%, Denver 6.0%; typical of the nine 5.6%). Source: U.S. Census Bureau, American Community Survey 1-year estimates, 2025, tables B25064, B25003 and B25004
Strongest evidence against. These are survey estimates with margins of error, and the four highest vacancy shares in 2025 are within those margins of each other. Hennepin County alone stands for Minneapolis-St. Paul in the vacancy comparison.
Downtown added 18,361 jobs from 2010 to 2019, and 39% of that gain was in professional and technical services. The Census files cannot say how much of it was software.
4 figures, with sources and method
- 84,920 and 103,281 Jobs within 0.75 miles of the downtown center in 2010 and 2019. How it was worked out: Jobs in City of Portland census blocks whose center point is within the stated distance of the downtown point at latitude 45.5189, longitude -122.6793, summed; 2019 less 2010. Source: U.S. Census Bureau, LEHD Origin-Destination Employment Statistics (LODES), version 8, Workplace Area Characteristics; U.S. Census Bureau, LODES version 8 geography crosswalk
- +7,171, 39% Gain in professional, scientific and technical services, 2010 to 2019, and its share of the whole gain. How it was worked out: LODES sector CNS12 in the same blocks. The share is of the net gain of 18,361. Sectors that grew added 20,695 jobs between them. Source: U.S. Census Bureau, LEHD Origin-Destination Employment Statistics (LODES), version 8, Workplace Area Characteristics; U.S. Census Bureau, LODES version 8 geography crosswalk
- +1,123 Gain in information, 2010 to 2019. How it was worked out: LODES sector CNS09 in the same blocks. Source: U.S. Census Bureau, LEHD Origin-Destination Employment Statistics (LODES), version 8, Workplace Area Characteristics; U.S. Census Bureau, LODES version 8 geography crosswalk
- +2,680 Gain in company head offices, 2010 to 2019. How it was worked out: LODES sector CNS13 (management of companies) in the same blocks. Source: U.S. Census Bureau, LEHD Origin-Destination Employment Statistics (LODES), version 8, Workplace Area Characteristics; U.S. Census Bureau, LODES version 8 geography crosswalk
Strongest evidence against. The Census files report 20 industry groups. Software publishers are inside information, with telecom, broadcasting and publishing. Custom software firms are inside professional and technical services, with law, engineering, accounting, advertising and consulting. No software figure can be taken from these files.
Sources: U.S. Census Bureau, LEHD Origin-Destination Employment Statistics (LODES), version 8, Workplace Area Characteristics; U.S. Census Bureau, LODES version 8 geography crosswalk
Since 2019 downtown has lost the most jobs in hotels and restaurants (3,673), finance and insurance (3,301) and professional and technical services (2,919). No industry added more than about 400 jobs.
6 figures, with sources and method
- −3,673, −32.1% Change in hotel and restaurant jobs within 0.75 miles of the center, 2019 to 2024. How it was worked out: LODES sector CNS18 (accommodation and food services). Jobs in City of Portland census blocks whose center point is within the stated distance of the downtown point at latitude 45.5189, longitude -122.6793, summed; 2024 less 2019. Source: U.S. Census Bureau, LEHD Origin-Destination Employment Statistics (LODES), version 8, Workplace Area Characteristics; U.S. Census Bureau, LODES version 8 geography crosswalk
- −3,301, −26.6% Change in finance and insurance jobs, 2019 to 2024. How it was worked out: LODES sector CNS10 in the same blocks. Source: U.S. Census Bureau, LEHD Origin-Destination Employment Statistics (LODES), version 8, Workplace Area Characteristics; U.S. Census Bureau, LODES version 8 geography crosswalk
- −2,527 Finance and insurance jobs lost on the two blocks with the largest losses. How it was worked out: The blocks whose center points are at 45.5159, -122.6797 and 45.5223, -122.6762. They went from 1,695 to 356 jobs and from 1,410 to 222. Without them finance and insurance fell 8.3%. Source: U.S. Census Bureau, LEHD Origin-Destination Employment Statistics (LODES), version 8, Workplace Area Characteristics; U.S. Census Bureau, LODES version 8 geography crosswalk
- −2,919, −12.9% Change in professional and technical services jobs, 2019 to 2024. How it was worked out: LODES sector CNS12 in the same blocks. 148 blocks lost jobs in this sector, and the largest single block is 17.6% of the net loss. Source: U.S. Census Bureau, LEHD Origin-Destination Employment Statistics (LODES), version 8, Workplace Area Characteristics; U.S. Census Bureau, LODES version 8 geography crosswalk
- 24% Information and professional and technical services together, as a share of the downtown loss. How it was worked out: A loss of 991 in information and 2,919 in professional and technical services, divided by the whole downtown loss of 16,439. Source: U.S. Census Bureau, LEHD Origin-Destination Employment Statistics (LODES), version 8, Workplace Area Characteristics; U.S. Census Bureau, LODES version 8 geography crosswalk
- +394 Change in government office jobs, the largest gain. How it was worked out: LODES sector CNS20 (public administration) in the same blocks. Source: U.S. Census Bureau, LEHD Origin-Destination Employment Statistics (LODES), version 8, Workplace Area Characteristics; U.S. Census Bureau, LODES version 8 geography crosswalk
Strongest evidence against. The largest-gain statement holds at 0.75 miles. Within 0.5 miles utilities and real estate gained more, and within 1.25 miles construction and the arts did. About 70% of the education loss of 1,233 is one block, and a count for one block can change when an employer changes the address it reports.
Sources: U.S. Census Bureau, LEHD Origin-Destination Employment Statistics (LODES), version 8, Workplace Area Characteristics; U.S. Census Bureau, LODES version 8 geography crosswalk
Of 26 detailed industries, Multnomah County had the largest fall or the smallest gain of ten central counties in 12 from 2019 to 2025, and it was below the middle of the other nine in 24. From 2015 to 2019 it was last in 2 and below the middle in 17.
6 figures, with sources and method
- 12 Industries, of 26, where Multnomah County ranked last of the ten central counties, 2019 to 2025. How it was worked out: Percent change in annual average jobs, private employers, for each industry in each central county. Minneapolis-St. Paul is Hennepin and Ramsey counties added together. The 12 are computer systems design, architecture and engineering, advertising and public relations, banks and lenders, securities and investment firms, company head offices, manufacturing, wholesale, retail, restaurants and bars, hotels, and doctors’ offices and clinics. The industry list was fixed before the counts were read. Source: U.S. Bureau of Labor Statistics, Quarterly Census of Employment and Wages, annual averages by county and detailed industry
- 24 of 26 Industries where Multnomah County was below the middle of the other nine. How it was worked out: Multnomah County’s percent change compared with the median of the nine other places that have a figure. Source: U.S. Bureau of Labor Statistics, Quarterly Census of Employment and Wages, annual averages by county and detailed industry
- 16 of 26 Industries with fewer jobs in Multnomah County in 2025 than in 2019. Source: U.S. Bureau of Labor Statistics, Quarterly Census of Employment and Wages, annual averages by county and detailed industry
- 62% Manufacturing, restaurants and bars, and retail as a share of the county’s net loss of private jobs. How it was worked out: Losses of 7,410, 6,294 and 5,817 jobs divided by the net loss of 31,408 private jobs. Computer systems design, a loss of 1,368, is 4%. Source: U.S. Bureau of Labor Statistics, Quarterly Census of Employment and Wages, annual averages by county and detailed industry
- 2 and 17 of 26 The same counts for 2015 to 2019: last of ten, and below the middle of the other nine. Source: U.S. Bureau of Labor Statistics, Quarterly Census of Employment and Wages, annual averages by county and detailed industry
- 10 to 12 How the count of 12 changes with other start and end years. How it was worked out: Recomputed by an independent check for 2019 to 2024, 2018 to 2025 and 2018 to 2024, on a list that also held one industry since dropped. By the same method King County was last in 1, Hennepin and Ramsey in 3, Franklin in 3 and San Diego in 5. Source: U.S. Bureau of Labor Statistics, Quarterly Census of Employment and Wages, annual averages by county and detailed industry
Strongest evidence against. In retail, wholesale and doctors’ offices Multnomah County is last by about 1 percentage point. The list leaves out social assistance, which gained 5,346 jobs, the county’s largest gain. Five cells are left out as not comparable: retail and head offices in King County, head offices and manufacturing in Travis County, and computer manufacturing in Wake County. These are counts of jobs by employer industry and reported worksite. They do not show occupations, where workers live, or where a lost job went.
Computer systems design and custom software firms cut 19.7% of their jobs in Multnomah County from 2019 to 2025, the largest fall of ten central counties. Software publishers held level. Together the two fell 11.2%, close to San Diego County and to Hennepin and Ramsey counties.
4 figures, with sources and method
- 6,950 and 5,582, −19.7% Jobs in computer systems design and related services in Multnomah County, 2019 and 2025. How it was worked out: Industry 5415, private employers, annual averages. Denver County grew 43.3%, Travis County 43.2% and King County 9.8%. The median of the nine is +9.8%. Source: U.S. Bureau of Labor Statistics, Quarterly Census of Employment and Wages, annual averages by county and detailed industry
- +1.4% Change in jobs at software publishers in Multnomah County, 2019 to 2025. How it was worked out: Industry 5112 through 2021 and 5132 from 2022, the same group renumbered. 4,656 jobs in 2019 and 4,723 in 2025. The median of the nine is +38.1% and the median of King, Denver, and Hennepin and Ramsey is −3.3%. Source: U.S. Bureau of Labor Statistics, Quarterly Census of Employment and Wages, annual averages by county and detailed industry
- 11,606 to 10,305, −11.2% The two industries together in Multnomah County, 2019 to 2025. How it was worked out: The two rows added. San Diego County fell 12.3%, Hennepin and Ramsey 10.9% and Franklin 8.3%. Travis and Denver counties each grew about 50%. Source: U.S. Bureau of Labor Statistics, Quarterly Census of Employment and Wages, annual averages by county and detailed industry
- 8 Central counties, of ten, where the two together fell from 2022 to 2025. How it was worked out: All but Travis (+0.6%) and Wake (+7.3%). Multnomah County fell 16.7%, King 14.6% and San Diego 17.2%. Source: U.S. Bureau of Labor Statistics, Quarterly Census of Employment and Wages, annual averages by county and detailed industry
Strongest evidence against. A software employer can register remote workers as separate worksites. The number of software publisher worksites in Multnomah County rose from 682 to 1,301 while jobs stayed level, so some jobs counted here may be held by people who work from home. Maricopa County’s 124.5% growth in software publishers is 4,357 jobs.
The industries fell at different times in Multnomah County. Head offices fell from 2020 and banks from 2021. Computer systems design held its 2019 level through 2022 and then lost 20%. Private colleges lost 16% of their jobs in 2020 and 31% by 2025.
4 figures, with sources and method
- 100.8 and 80.3 Jobs in computer systems design in 2022 and 2025, with 2019 = 100. How it was worked out: Each year’s annual average divided by the 2019 average, private employers. Source: U.S. Bureau of Labor Statistics, Quarterly Census of Employment and Wages, annual averages by county and detailed industry
- 100.6, 83.1, 64.9 and 68.5 Jobs at banks and lenders in 2020, 2022, 2024 and 2025, with 2019 = 100. How it was worked out: Industry 522. The loss is in deposit-taking banks, which fell 39.0% from 2019 to 2025 in two steps. Source: U.S. Bureau of Labor Statistics, Quarterly Census of Employment and Wages, annual averages by county and detailed industry
- 94.0 and 80.8 Jobs at company head offices in 2020 and 2025, with 2019 = 100. How it was worked out: Industry 551: 19,284 jobs in 2019 and 15,591 in 2025. Source: U.S. Bureau of Labor Statistics, Quarterly Census of Employment and Wages, annual averages by county and detailed industry
- 84.0 and 69.1 Jobs at private colleges and universities in 2020 and 2025, with 2019 = 100. How it was worked out: Industry 6113, private employers: 5,032 jobs in 2019 and 3,479 in 2025. The jobs did not move to public ownership. Source: U.S. Bureau of Labor Statistics, Quarterly Census of Employment and Wages, annual averages by county and detailed industry
Strongest evidence against. The 2025 averages can still be revised. The insurance loss of 21.1% is almost all in agencies, brokerages and claims offices, which fell 39.9%. Insurance carriers fell 3.5%.
The ten census blocks that lost the most jobs within 0.75 miles of the downtown center lost 8,827 jobs from 2019 to 2024. That is 53.7% of downtown's net change of 16,439 jobs, and 32.4% of the 27,265 jobs lost on the 260 blocks that fell.
13 figures, with sources and method
- 103,281 and 86,842 Jobs within 0.75 mile of the downtown center, 2019 and 2024. How it was worked out: Jobs in City of Portland census blocks whose internal point is within 0.75 mile of latitude 45.5189, longitude -122.6793, summed. All jobs, counted at the address the employer reports. Source: U.S. Census Bureau, LEHD Origin-Destination Employment Statistics (LODES), version 8, Workplace Area Characteristics; U.S. Census Bureau, LODES version 8 geography crosswalk
- -16,439 (-15.9%) Net change in jobs within 0.75 mile, 2019 to 2024. How it was worked out: The 2024 sum less the 2019 sum. Source: U.S. Census Bureau, LEHD Origin-Destination Employment Statistics (LODES), version 8, Workplace Area Characteristics; U.S. Census Bureau, LODES version 8 geography crosswalk
- 27,265 on 260 blocks Jobs lost on the blocks within 0.75 mile that had fewer jobs in 2024 than in 2019 (the gross loss). How it was worked out: The change on every block that fell, added together. Source: U.S. Census Bureau, LEHD Origin-Destination Employment Statistics (LODES), version 8, Workplace Area Characteristics; U.S. Census Bureau, LODES version 8 geography crosswalk
- 10,826 on 139 blocks Jobs gained on the blocks within 0.75 mile that had more jobs in 2024 (the gross gain). How it was worked out: The change on every block that rose, added together. The gross gain less the gross loss is the net change. Source: U.S. Census Bureau, LEHD Origin-Destination Employment Statistics (LODES), version 8, Workplace Area Characteristics; U.S. Census Bureau, LODES version 8 geography crosswalk
- 8,827 Jobs lost on the ten blocks with the largest losses. How it was worked out: Each block ranked by its change in jobs from 2019 to 2024; the largest losses added together. Source: U.S. Census Bureau, LEHD Origin-Destination Employment Statistics (LODES), version 8, Workplace Area Characteristics; U.S. Census Bureau, LODES version 8 geography crosswalk
- 53.7% The ten blocks as a share of the net change within 0.75 mile. How it was worked out: 8,827 divided by 16,439. Source: U.S. Census Bureau, LEHD Origin-Destination Employment Statistics (LODES), version 8, Workplace Area Characteristics; U.S. Census Bureau, LODES version 8 geography crosswalk
- 32.4% The ten blocks as a share of the gross loss within 0.75 mile. How it was worked out: 8,827 divided by 27,265. Source: U.S. Census Bureau, LEHD Origin-Destination Employment Statistics (LODES), version 8, Workplace Area Characteristics; U.S. Census Bureau, LODES version 8 geography crosswalk
- 43.0% The ten blocks as a share of the City of Portland's net change of 20,510 jobs. How it was worked out: 8,827 divided by 20,510. Source: U.S. Census Bureau, LEHD Origin-Destination Employment Statistics (LODES), version 8, Workplace Area Characteristics; U.S. Census Bureau, LODES version 8 geography crosswalk
- 19.3% The ten blocks' share of the jobs within 0.75 mile in 2019. How it was worked out: Their 2019 jobs divided by the 2019 total for the ring. Source: U.S. Census Bureau, LEHD Origin-Destination Employment Statistics (LODES), version 8, Workplace Area Characteristics; U.S. Census Bureau, LODES version 8 geography crosswalk
- 44.4% against 15.9% Share of their own 2019 jobs that the ten blocks lost, beside the loss for the whole ring. Source: U.S. Census Bureau, LEHD Origin-Destination Employment Statistics (LODES), version 8, Workplace Area Characteristics; U.S. Census Bureau, LODES version 8 geography crosswalk
- 24.2% Share of 2019 jobs within 0.75 mile held by the ten blocks with the most jobs. How it was worked out: Blocks ranked by 2019 jobs, not by loss. Source: U.S. Census Bureau, LEHD Origin-Destination Employment Statistics (LODES), version 8, Workplace Area Characteristics; U.S. Census Bureau, LODES version 8 geography crosswalk
- -18,640; 48.8% and 24.3% Within 1.25 miles: net change, and the ten largest losing blocks as a share of the net change and of the gross loss. How it was worked out: The same sum for blocks within 1.25 miles of the same point. Each block ranked by its change in jobs from 2019 to 2024; the largest losses added together. Source: U.S. Census Bureau, LEHD Origin-Destination Employment Statistics (LODES), version 8, Workplace Area Characteristics; U.S. Census Bureau, LODES version 8 geography crosswalk
- 82.2% and 40.9% Within 1.25 miles: the 25 largest losing blocks as a share of the net change and of the gross loss. How it was worked out: The same sum for blocks within 1.25 miles of the same point. Each block ranked by its change in jobs from 2019 to 2024; the largest losses added together. Source: U.S. Census Bureau, LEHD Origin-Destination Employment Statistics (LODES), version 8, Workplace Area Characteristics; U.S. Census Bureau, LODES version 8 geography crosswalk
Strongest evidence against. The 54% figure is a share of the net change, which is small because gains on other blocks offset losses. Measured against everything that was lost, the ten blocks carry 32.4%, and 250 other blocks carry the rest. Downtown jobs sit in towers, so some concentration is expected: the ten blocks with the most jobs held 24.2% of the 2019 total. A different center point or radius would change the shares.
Sources: U.S. Census Bureau, LEHD Origin-Destination Employment Statistics (LODES), version 8, Workplace Area Characteristics; U.S. Census Bureau, LODES version 8 geography crosswalk
Each of the fifteen blocks that lost the most jobs within 1.25 miles of the center can be matched to buildings on the ground. Six are single office towers and the rest hold two or more buildings. Among them are a bank tower, two insurers' buildings, a utility headquarters, the old county courthouse, a transit agency office and a university office building.
16 figures, with sources and method
- -2,569 (5,441 to 2,872) Change in jobs, 2019 to 2024: U.S. Bancorp Tower, 111 SW 5th Ave. How it was worked out: All jobs on the census block. The building is named from the tax lots that fall inside the block outline. Source: U.S. Census Bureau, LEHD Origin-Destination Employment Statistics (LODES), version 8, Workplace Area Characteristics; U.S. Census Bureau, LODES version 8 geography crosswalk; City of Portland, PortlandMaps public tax lot map service; U.S. Census Bureau, TIGERweb, 2020 census block outlines
- -1,260 (1,777 to 517) Change in jobs, 2019 to 2024: Standard Plaza, 1100 SW 6th Ave. Source: U.S. Census Bureau, LEHD Origin-Destination Employment Statistics (LODES), version 8, Workplace Area Characteristics; U.S. Census Bureau, LODES version 8 geography crosswalk; City of Portland, PortlandMaps public tax lot map service; U.S. Census Bureau, TIGERweb, 2020 census block outlines
- -810 (1,879 to 1,069) Change in jobs, 2019 to 2024: Liberty Centre, 650 NE Holladay St. Source: U.S. Census Bureau, LEHD Origin-Destination Employment Statistics (LODES), version 8, Workplace Area Characteristics; U.S. Census Bureau, LODES version 8 geography crosswalk; City of Portland, PortlandMaps public tax lot map service; U.S. Census Bureau, TIGERweb, 2020 census block outlines
- -741 (1,368 to 627) Change in jobs, 2019 to 2024: Harrison Square, 1800 SW 1st Ave, and 1618 SW 1st Ave. Source: U.S. Census Bureau, LEHD Origin-Destination Employment Statistics (LODES), version 8, Workplace Area Characteristics; U.S. Census Bureau, LODES version 8 geography crosswalk; City of Portland, PortlandMaps public tax lot map service; U.S. Census Bureau, TIGERweb, 2020 census block outlines
- -655 (1,332 to 677) Change in jobs, 2019 to 2024: Congress Center, 1050 SW 6th Ave. Source: U.S. Census Bureau, LEHD Origin-Destination Employment Statistics (LODES), version 8, Workplace Area Characteristics; U.S. Census Bureau, LODES version 8 geography crosswalk; City of Portland, PortlandMaps public tax lot map service; U.S. Census Bureau, TIGERweb, 2020 census block outlines
- -640 (1,236 to 596) Change in jobs, 2019 to 2024: Pioneer Tower and Pioneer Place, 888 and 700 SW 5th Ave. Source: U.S. Census Bureau, LEHD Origin-Destination Employment Statistics (LODES), version 8, Workplace Area Characteristics; U.S. Census Bureau, LODES version 8 geography crosswalk; City of Portland, PortlandMaps public tax lot map service; U.S. Census Bureau, TIGERweb, 2020 census block outlines
- -628 (950 to 322) Change in jobs, 2019 to 2024: Cascade and Wilcox buildings and Hotel Monaco, SW 6th Ave at SW Washington St. Source: U.S. Census Bureau, LEHD Origin-Destination Employment Statistics (LODES), version 8, Workplace Area Characteristics; U.S. Census Bureau, LODES version 8 geography crosswalk; City of Portland, PortlandMaps public tax lot map service; U.S. Census Bureau, TIGERweb, 2020 census block outlines
- -605 (724 to 119) Change in jobs, 2019 to 2024: One Pacific Square, 220 NW 2nd Ave. Source: U.S. Census Bureau, LEHD Origin-Destination Employment Statistics (LODES), version 8, Workplace Area Characteristics; U.S. Census Bureau, LODES version 8 geography crosswalk; City of Portland, PortlandMaps public tax lot map service; U.S. Census Bureau, TIGERweb, 2020 census block outlines
- -604 (1,967 to 1,363) Change in jobs, 2019 to 2024: KOIN Tower, 222 SW Columbia St. Source: U.S. Census Bureau, LEHD Origin-Destination Employment Statistics (LODES), version 8, Workplace Area Characteristics; U.S. Census Bureau, LODES version 8 geography crosswalk; City of Portland, PortlandMaps public tax lot map service; U.S. Census Bureau, TIGERweb, 2020 census block outlines
- -591 (4,482 to 3,891) Change in jobs, 2019 to 2024: Portland State University offices, 1600 SW 4th Ave. Source: U.S. Census Bureau, LEHD Origin-Destination Employment Statistics (LODES), version 8, Workplace Area Characteristics; U.S. Census Bureau, LODES version 8 geography crosswalk; City of Portland, PortlandMaps public tax lot map service; U.S. Census Bureau, TIGERweb, 2020 census block outlines
- -588 (979 to 391) Change in jobs, 2019 to 2024: 2525 and 2501 SW 1st Ave. Source: U.S. Census Bureau, LEHD Origin-Destination Employment Statistics (LODES), version 8, Workplace Area Characteristics; U.S. Census Bureau, LODES version 8 geography crosswalk; City of Portland, PortlandMaps public tax lot map service; U.S. Census Bureau, TIGERweb, 2020 census block outlines
- -534 (620 to 86) Change in jobs, 2019 to 2024: SE Yamhill St at SE Water Ave (61 to 115 SE Yamhill St). Source: U.S. Census Bureau, LEHD Origin-Destination Employment Statistics (LODES), version 8, Workplace Area Characteristics; U.S. Census Bureau, LODES version 8 geography crosswalk; City of Portland, PortlandMaps public tax lot map service; U.S. Census Bureau, TIGERweb, 2020 census block outlines
- -494 (497 to 3) Change in jobs, 2019 to 2024: Old Multnomah County Courthouse, 1021 SW 4th Ave. Source: U.S. Census Bureau, LEHD Origin-Destination Employment Statistics (LODES), version 8, Workplace Area Characteristics; U.S. Census Bureau, LODES version 8 geography crosswalk; City of Portland, PortlandMaps public tax lot map service; U.S. Census Bureau, TIGERweb, 2020 census block outlines
- -474 (513 to 39) Change in jobs, 2019 to 2024: Graphic Arts Building, 120 NW 9th Ave, and 165 NW Park Ave. Source: U.S. Census Bureau, LEHD Origin-Destination Employment Statistics (LODES), version 8, Workplace Area Characteristics; U.S. Census Bureau, LODES version 8 geography crosswalk; City of Portland, PortlandMaps public tax lot map service; U.S. Census Bureau, TIGERweb, 2020 census block outlines
- -422 (1,042 to 620) Change in jobs, 2019 to 2024: Commonwealth Building, 421 SW 6th Ave; Hotel Lucia; Hotel Vintage. Source: U.S. Census Bureau, LEHD Origin-Destination Employment Statistics (LODES), version 8, Workplace Area Characteristics; U.S. Census Bureau, LODES version 8 geography crosswalk; City of Portland, PortlandMaps public tax lot map service; U.S. Census Bureau, TIGERweb, 2020 census block outlines
- -11,615, 62.3% of 18,640 The fifteen blocks together, and their share of the net change within 1.25 miles. How it was worked out: The same sum for blocks within 1.25 miles of the same point. Each block ranked by its change in jobs from 2019 to 2024; the largest losses added together. Source: U.S. Census Bureau, LEHD Origin-Destination Employment Statistics (LODES), version 8, Workplace Area Characteristics; U.S. Census Bureau, LODES version 8 geography crosswalk
Strongest evidence against. Tax lots show who owns a building. They do not show who rents space in it. Which tenant lost the jobs is known from a source for only part of each block. Two of the fifteen are groups of smaller buildings identified by address, and several blocks hold more than one building.
Sources: U.S. Census Bureau, LEHD Origin-Destination Employment Statistics (LODES), version 8, Workplace Area Characteristics; U.S. Census Bureau, LODES version 8 geography crosswalk; City of Portland, PortlandMaps public tax lot map service; U.S. Census Bureau, TIGERweb, 2020 census block outlines
About 1,300 of the jobs lost on the largest losing blocks never left downtown. Three employers moved a few blocks, and the records show the same kind of jobs arriving at the new address: NW Natural, the county courts and TriMet.
7 figures, with sources and method
- 596 and 0; 0, 583 and 765 NW Natural: utilities jobs at One Pacific Square, 2019 and 2020, and at 250 SW Taylor St, 2019, 2020 and 2024. How it was worked out: LODES utilities jobs (CNS03) on the two blocks. The lease at the new address began in March 2020. Source: U.S. Census Bureau, LEHD Origin-Destination Employment Statistics (LODES), version 8, Workplace Area Characteristics; U.S. Census Bureau, LODES version 8 geography crosswalk; Northwest Natural Holding Company, Form 10-K for fiscal year 2020; Portland Tribune, NW Natural to move downtown
- 484 and 1; 0 and 639 County courts: public administration jobs at the old courthouse, 2019 and 2024, and at the new courthouse. How it was worked out: LODES public administration jobs (CNS20) on the two blocks. The courts moved in October 2020; the records show 360 jobs still at the old block in 2022 and 7 in 2023. Source: U.S. Census Bureau, LEHD Origin-Destination Employment Statistics (LODES), version 8, Workplace Area Characteristics; U.S. Census Bureau, LODES version 8 geography crosswalk; Wikipedia, Multnomah County Courthouse; Multnomah County, County board approves $28 million sale of Central Courthouse to NBP Capital
- 247 and 0; 0 and 407 TriMet: administrative and support jobs at Harrison Square, 2019 and 2024, and at One Main Place. How it was worked out: LODES administrative and support jobs (CNS14) on the two blocks. Staff began working at One Main Place in June 2023. Source: U.S. Census Bureau, LEHD Origin-Destination Employment Statistics (LODES), version 8, Workplace Area Characteristics; U.S. Census Bureau, LODES version 8 geography crosswalk; TriMet Board of Directors, Resolution No. 22-01-02, authorizing a lease for administrative office space at 101 SW Main Street; TriMet Board of Directors, Resolution No. 24-09-53, authorizing an amendment to the lease at One Main Place
- 1,326 Jobs that left the three old blocks in those sectors. How it was worked out: 596 plus 483 plus 247. Source: U.S. Census Bureau, LEHD Origin-Destination Employment Statistics (LODES), version 8, Workplace Area Characteristics; U.S. Census Bureau, LODES version 8 geography crosswalk
- 10.3% That total as a share of the jobs lost, sector by sector, on the fifteen largest losing blocks. How it was worked out: 1,326 divided by 12,890. A cell is one sector on one block. For each of the fifteen blocks, every sector whose job count fell from 2019 to 2024 is counted, and the falls are added. A cell is assigned to a named employer only where a dated source names the employer and what it did; everything else is counted as not identified. Source: U.S. Census Bureau, LEHD Origin-Destination Employment Statistics (LODES), version 8, Workplace Area Characteristics; U.S. Census Bureau, LODES version 8 geography crosswalk
- 7.1% That total as a share of the net loss within 1.25 miles. How it was worked out: 1,326 divided by 18,640. Source: U.S. Census Bureau, LEHD Origin-Destination Employment Statistics (LODES), version 8, Workplace Area Characteristics; U.S. Census Bureau, LODES version 8 geography crosswalk
- All three are among the ten largest gains Rank of the three new blocks among gaining blocks within 0.75 mile. How it was worked out: Blocks within 0.75 mile ranked by gain in jobs, 2019 to 2024. Source: U.S. Census Bureau, LEHD Origin-Destination Employment Statistics (LODES), version 8, Workplace Area Characteristics; U.S. Census Bureau, LODES version 8 geography crosswalk
Strongest evidence against. No evidence was found against the three moves. The match of the Harrison Square jobs to TriMet rests on the counts of local government jobs at the two blocks. No record names the agency. The courthouse shows that the records can lag a real move by two to three years, which weakens any reading of the year in which a block's jobs fell.
Sources: U.S. Census Bureau, LEHD Origin-Destination Employment Statistics (LODES), version 8, Workplace Area Characteristics; U.S. Census Bureau, LODES version 8 geography crosswalk; Northwest Natural Holding Company, Form 10-K for fiscal year 2020; Portland Tribune, NW Natural to move downtown; Wikipedia, Multnomah County Courthouse; Multnomah County, County board approves $28 million sale of Central Courthouse to NBP Capital; TriMet Board of Directors, Resolution No. 22-01-02, authorizing a lease for administrative office space at 101 SW Main Street; TriMet Board of Directors, Resolution No. 24-09-53, authorizing an amendment to the lease at One Main Place
For about 72% of the jobs lost on the fifteen largest losing blocks, the public record does not say which employer lost them or where they went. Of 12,890 jobs lost, 9,273 are not identified, 1,326 moved inside downtown, 455 moved to a suburb, 497 belong to employers that shrank or closed, and 1,339 are an insurer's jobs that we infer are now worked from elsewhere.
12 figures, with sources and method
- 12,890 Jobs lost on the fifteen largest losing blocks, counted sector by sector. How it was worked out: A cell is one sector on one block. For each of the fifteen blocks, every sector whose job count fell from 2019 to 2024 is counted, and the falls are added. A cell is assigned to a named employer only where a dated source names the employer and what it did; everything else is counted as not identified. The total is larger than the blocks' net change of 11,615 because sectors that grew on the same blocks are not netted out. Source: U.S. Census Bureau, LEHD Origin-Destination Employment Statistics (LODES), version 8, Workplace Area Characteristics; U.S. Census Bureau, LODES version 8 geography crosswalk
- 9,273 (71.9%) No employer or destination identified. Source: U.S. Census Bureau, LEHD Origin-Destination Employment Statistics (LODES), version 8, Workplace Area Characteristics; U.S. Census Bureau, LODES version 8 geography crosswalk
- 1,339 (10.4%) Kept the building, staff work elsewhere. How it was worked out: Finance and insurance jobs at Standard Plaza. Inferred: the company owns the building, said in 2020 it would not return to all staff in the office, and calls itself remote-first. Source: U.S. Census Bureau, LEHD Origin-Destination Employment Statistics (LODES), version 8, Workplace Area Characteristics; U.S. Census Bureau, LODES version 8 geography crosswalk; Oregon Business, Future of Work: 'I Would Like to Have the Option to Return to Downtown Portland'; The Standard, Get to know The Standard (company About page)
- 1,326 (10.3%) Moved to another address inside downtown. How it was worked out: NW Natural, the county courts and TriMet; see B5. Source: U.S. Census Bureau, LEHD Origin-Destination Employment Statistics (LODES), version 8, Workplace Area Characteristics; U.S. Census Bureau, LODES version 8 geography crosswalk
- 497 (3.9%) Shrank or closed. How it was worked out: Portland State University 231, the fall in its staff count from fall 2019 to fall 2023; hotels and restaurants on two blocks 266 (127 and 139). Source: U.S. Census Bureau, LEHD Origin-Destination Employment Statistics (LODES), version 8, Workplace Area Characteristics; U.S. Census Bureau, LODES version 8 geography crosswalk; Oregon Higher Education Coordinating Commission, 2025 Employees at Public Institutions (report under ORS 350.360); WARNTracker.com, Kimpton Hotel Monaco Portland layoff, Portland, Oregon, March 2020; Willamette Week, Imperial, a Cornerstone of Chef Vitaly Paley's Hotel Restaurant Empire, Has Permanently Closed; LaborCurrent, Kimpton Hotel Vintage Portland layoffs and WARN notices
- 455 (3.5%) Moved to a suburb. How it was worked out: Finance and insurance jobs at Liberty Centre, which Liberty Mutual said it would leave for a smaller office in Lake Oswego. Source: U.S. Census Bureau, LEHD Origin-Destination Employment Statistics (LODES), version 8, Workplace Area Characteristics; U.S. Census Bureau, LODES version 8 geography crosswalk; Willamette Week, Liberty Mutual Insurance to End Lease in Lloyd District Building That Bears Its Name and Move to Lake Oswego
- 0 and 0 Moved out of the region, or changed in reporting only with no real change. How it was worked out: None was found or proven. Some may have occurred without leaving a public record. Source: U.S. Census Bureau, LEHD Origin-Destination Employment Statistics (LODES), version 8, Workplace Area Characteristics; U.S. Census Bureau, LODES version 8 geography crosswalk
- 8,381, 78.6% not identified Office employers: jobs lost, and the share not identified. How it was worked out: Sectors grouped by type of employer; see the first figure. Source: U.S. Census Bureau, LEHD Origin-Destination Employment Statistics (LODES), version 8, Workplace Area Characteristics; U.S. Census Bureau, LODES version 8 geography crosswalk
- 821, 67.6% not identified Restaurants, hotels and shops: jobs lost, and the share not identified. How it was worked out: Sectors grouped by type of employer; see the first figure. Source: U.S. Census Bureau, LEHD Origin-Destination Employment Statistics (LODES), version 8, Workplace Area Characteristics; U.S. Census Bureau, LODES version 8 geography crosswalk
- 1,876, 48.8% not identified Government: jobs lost, and the share not identified. How it was worked out: Sectors grouped by type of employer; see the first figure. Source: U.S. Census Bureau, LEHD Origin-Destination Employment Statistics (LODES), version 8, Workplace Area Characteristics; U.S. Census Bureau, LODES version 8 geography crosswalk
- 1,812, 67.1% not identified Other employers: jobs lost, and the share not identified. How it was worked out: Sectors grouped by type of employer; see the first figure. Source: U.S. Census Bureau, LEHD Origin-Destination Employment Statistics (LODES), version 8, Workplace Area Characteristics; U.S. Census Bureau, LODES version 8 geography crosswalk
- 1,188 (1,410 to 222) The largest group not identified: finance and insurance jobs at the U.S. Bancorp Tower. How it was worked out: U.S. Bank is the named tenant, but the jobs fell to 609 by 2023, before the bank's September 2024 announcement, and no layoff or lease change was found for those years. Source: U.S. Census Bureau, LEHD Origin-Destination Employment Statistics (LODES), version 8, Workplace Area Characteristics; U.S. Census Bureau, LODES version 8 geography crosswalk; Portland Tribune, U.S. Bank to leave iconic, pink Portland high-rise named after it
Strongest evidence against. A fuller history of who rented space in each building could move much of the unidentified share into the other groups, so the shares of the identified part should not be scaled up to the whole. The 1,339 jobs at Standard Plaza are assigned by inference. Liberty Mutual's 455 are counted as a move to a suburb although the company said 380 of its 500 staff were working from home.
Sources: U.S. Census Bureau, LEHD Origin-Destination Employment Statistics (LODES), version 8, Workplace Area Characteristics; U.S. Census Bureau, LODES version 8 geography crosswalk; Oregon Business, Future of Work: 'I Would Like to Have the Option to Return to Downtown Portland'; The Standard, Get to know The Standard (company About page); Oregon Higher Education Coordinating Commission, 2025 Employees at Public Institutions (report under ORS 350.360); WARNTracker.com, Kimpton Hotel Monaco Portland layoff, Portland, Oregon, March 2020; Willamette Week, Imperial, a Cornerstone of Chef Vitaly Paley's Hotel Restaurant Empire, Has Permanently Closed; LaborCurrent, Kimpton Hotel Vintage Portland layoffs and WARN notices; Willamette Week, Liberty Mutual Insurance to End Lease in Lloyd District Building That Bears Its Name and Move to Lake Oswego; Portland Tribune, U.S. Bank to leave iconic, pink Portland high-rise named after it
Strongly supported 38 claims: P10, S2, S3, S4, S5, S6, S7, S8, F2, F4, F5, F10, F12, F17, F20, F22, F23, F26, F28, F29, F30, F31, F33, F36, F37, F38, F41, F42, F43, F47, F50, M8, J3, J7, B3, B4, B7, B8
More households left Multnomah County after 2020, at about the same rate as in comparable counties, but the people leaving had unusually high incomes and arrivals from other states did not rise as they did elsewhere.
6 figures, with sources and method
- +16.1% (15,341 to 17,815 a year) Change in tax returns leaving Multnomah County for other states, 2021-22 and 2022-23 against 2017-18 and 2018-19. How it was worked out: The yearly average number of returns in the two later filing-year pairs divided by the average in the two earlier pairs. Source: Internal Revenue Service, Statistics of Income, U.S. Population Migration Data, county-to-county flows
- +16.5% The same change in nine comparison counties (median). How it was worked out: The same calculation for King, Denver, Hennepin, Franklin, San Diego, Maricopa, Salt Lake, Travis and Wake counties; the middle value of the nine. Source: Internal Revenue Service, Statistics of Income, U.S. Population Migration Data, county-to-county flows
- 18,080 and 18,268 (+1.0%) Tax returns arriving in Multnomah County from other states, yearly average, before and after. How it was worked out: Same periods as above. Source: Internal Revenue Service, Statistics of Income, U.S. Population Migration Data, county-to-county flows
- +9.5% Change in arrivals from other states in the nine comparison counties (median). How it was worked out: Same periods and counties as above. Source: Internal Revenue Service, Statistics of Income, U.S. Population Migration Data, county-to-county flows
- 81% and 98% Average income of households leaving Multnomah County as a percent of the average income of those who stayed, before and after. How it was worked out: Adjusted gross income per departing return divided by income per return that did not move, for returns leaving to anywhere in the United States, same periods. Source: Internal Revenue Service, Statistics of Income, U.S. Population Migration Data, county-to-county flows
- Largest of ten (+16.9 points; next is King County at +9.9) Rank of that rise among Multnomah and the nine comparison counties. How it was worked out: Each period is pooled: total income of departing returns over total departing returns, divided by the same for returns that stayed. Averaging the yearly ratios instead gives +16.6 and +9.7, and the same rank. Source: Internal Revenue Service, Statistics of Income, U.S. Population Migration Data, county-to-county flows
Strongest evidence against. The departures comparison depends on the years chosen: with 2019-20 and 2020-21 as the later period, Multnomah's rise (16.7%) is above the comparison median (11.3%). Arrivals did not fall; they were flat while other counties' rose. The files count tax returns and miss late filers and people who do not file. The independent check lowered this from proven to strongly supported.
On a broad measure that includes temporary help and call centers, office-type jobs fell 10.5% in Multnomah County from 2019 to 2025 and by the same share in Minneapolis-St. Paul's central counties, while they rose about 16% in Denver's. On the narrower measure used for downtown, Multnomah County's fell 11.8%, the most of ten comparison counties, Minneapolis-St. Paul's fell 8.2% and Denver's rose about 21%.
10 figures, with sources and method
- -10.5% (127,209 to 113,893) Change in private office-type jobs in Multnomah County, 2019 to 2025. How it was worked out: Private employment in information, financial activities, and professional and business services, added together. Source: U.S. Bureau of Labor Statistics, Quarterly Census of Employment and Wages, annual averages by industry
- -10.5% The same change in Hennepin and Ramsey counties together. How it was worked out: Same three industry groups, the two counties added. Source: U.S. Bureau of Labor Statistics, Quarterly Census of Employment and Wages, annual averages by industry
- +15.9% The same change in Denver County. How it was worked out: Same three industry groups. Source: U.S. Bureau of Labor Statistics, Quarterly Census of Employment and Wages, annual averages by industry
- -11.8% (102,296 to 90,192) Change in Multnomah County office jobs on the narrower measure, 2019 to 2025. How it was worked out: Private employment in information, finance and insurance, real estate, professional services and company management, added together. Temporary help, call centers and other administrative support are left out. Source: U.S. Bureau of Labor Statistics, Quarterly Census of Employment and Wages, annual averages by industry
- -8.2% The same change in Hennepin and Ramsey counties together, narrower measure. How it was worked out: Same five industries, the two counties added. Source: U.S. Bureau of Labor Statistics, Quarterly Census of Employment and Wages, annual averages by industry
- +20.7% The same change in Denver County, narrower measure. How it was worked out: Same five industries. Source: U.S. Bureau of Labor Statistics, Quarterly Census of Employment and Wages, annual averages by industry
- Largest fall of ten Multnomah County's rank among the ten comparison counties on the narrower measure. How it was worked out: The ten counties' percent changes from 2019 to 2025, put in order. The typical change among the other nine was a gain of 16.3%. Source: U.S. Bureau of Labor Statistics, Quarterly Census of Employment and Wages, annual averages by industry
- About 50,000 (49,982) Fall in King County (Seattle) trade, transportation and utilities jobs between 2021 and 2022, the size of the recoding. How it was worked out: Private employment in that industry group, 2022 less 2021. In the same year King County's office-type jobs rose by 88,856, which is why its series is not used. Source: U.S. Bureau of Labor Statistics, Quarterly Census of Employment and Wages, annual averages by industry
- 88% Share of Multnomah County's office-type job loss that came after 2022. How it was worked out: The 2025 count less the 2022 count, divided by the 2025 count less the 2019 count. Source: U.S. Bureau of Labor Statistics, Quarterly Census of Employment and Wages, annual averages by industry
- 10,721 of 13,316 Multnomah County office-type jobs lost in 2024 and 2025. How it was worked out: The 2025 count less the 2023 count, beside the 2025 count less the 2019 count. Source: U.S. Bureau of Labor Statistics, Quarterly Census of Employment and Wages, annual averages by industry
Strongest evidence against. Since 2022 office-type jobs have fallen in all four central counties, Denver's included (Multnomah -9.4%, King -7.2%, Hennepin and Ramsey -6.7%, Denver -1.0%). The group is built from three broad industry groups and includes some work that is not done in offices. Staff reported at a home address outside the county lower its count without any office closing.
The losses came in an order: consumer-facing jobs broke in 2020, office jobs slipped against the suburbs every year from 2021, with the county's largest yearly loss in 2024, and the number of business establishments slipped in 2021 and fell faster in 2022.
4 figures, with sources and method
- -13.7 points Change in consumer-facing jobs in the City of Portland against Washington and Clackamas counties, 2020. How it was worked out: Jobs in retail, arts and recreation, accommodation and food, and other services. Growth on the Portland side less growth on the other side, measured as the change in the natural logarithm of the count, times 100. For small changes this is close to a difference in percentage points. Source: U.S. Census Bureau, LEHD Origin-Destination Employment Statistics (LODES), version 8, Workplace Area Characteristics; U.S. Census Bureau, LODES version 8 geography crosswalk
- -2.6, -3.9, -2.5 and -3.2 points Yearly change in office-type jobs in the City of Portland against Washington and Clackamas counties, 2021 to 2024. How it was worked out: Jobs in information, finance and insurance, real estate, professional services and management of companies. Growth on the Portland side less growth on the other side, measured as the change in the natural logarithm of the count, times 100. For small changes this is close to a difference in percentage points. Source: U.S. Census Bureau, LEHD Origin-Destination Employment Statistics (LODES), version 8, Workplace Area Characteristics; U.S. Census Bureau, LODES version 8 geography crosswalk
- -7,197 and -3,524 Yearly change in Multnomah County private office-type jobs, 2024 and 2025. How it was worked out: Private employment in information, financial activities, and professional and business services; each year less the year before. Source: U.S. Bureau of Labor Statistics, Quarterly Census of Employment and Wages, annual averages by industry
- -1.4 and -3.1 points Yearly change in business establishments in Portland ZIP codes against Washington and Clackamas county ZIP codes, 2021 and 2022. How it was worked out: Establishments in 26 Portland ZIP codes against 24 suburban ZIP codes. Growth on the Portland side less growth on the other side, measured as the change in the natural logarithm of the count, times 100. For small changes this is close to a difference in percentage points. Source: U.S. Census Bureau, County Business Patterns, ZIP Code Business Patterns
Strongest evidence against. The county's own count of office-type jobs rose in 2021 and 2022 before falling, so the fall from 2021 is measured against the suburbs. The county's own count did not fall until later. The establishment series ends in 2023 and the block-level job series in 2024, so the order cannot be followed into 2025 at the city level.
Sources: U.S. Census Bureau, LEHD Origin-Destination Employment Statistics (LODES), version 8, Workplace Area Characteristics; U.S. Census Bureau, LODES version 8 geography crosswalk; U.S. Bureau of Labor Statistics, Quarterly Census of Employment and Wages, annual averages by industry; U.S. Census Bureau, County Business Patterns, ZIP Code Business Patterns
Downtown was planned as the region's office district in the 1972 Downtown Plan and the 1988 Central City Plan, and by 2012 it held 49% of the region's multi-tenant office space against an average of 27% in comparison cities.
3 figures, with sources and method
- 49% Downtown Portland's share of the region's multi-tenant office space, as reported in 2012. Source: City of Portland, Bureau of Planning and Sustainability, Economic Opportunities Analysis, Section 4, Alternative Choices, proposed draft, March 2012
- 27% Average share for eight comparison cities in the same report. Source: City of Portland, Bureau of Planning and Sustainability, Economic Opportunities Analysis, Section 4, Alternative Choices, proposed draft, March 2012
- At least 50,000 Additional Central City jobs the 1988 plan aimed for by the year 2010. Source: City of Portland, Bureau of Planning, Central City Plan, adopted by the Portland City Council March 24, 1988
Strongest evidence against. Other cities planned their downtowns the same way, and the office-space figures come from one 2012 report written for the City. The planning history explains why the loss landed downtown. It leaves open why Portland's loss was larger than other cities'. The independent check graded the planning history strongly supported and its role in the loss only likely.
Sources: City of Portland, Planning Guidelines, Portland Downtown Plan, as adopted by City Council, December 1972; City of Portland, Bureau of Planning, Central City Plan, adopted by the Portland City Council March 24, 1988; City of Portland, Bureau of Planning and Sustainability, Economic Opportunities Analysis, Section 4, Alternative Choices, proposed draft, March 2012
The region around Portland was not growing, so a falling share meant fewer jobs: Columbus's and Austin's central counties lost nearly as much share of their regions' jobs as Multnomah County did, but those regions grew, so their centers still added jobs.
3 figures, with sources and method
- -2.16, -1.91 and -1.84 percentage points Change in the central county's share of metro jobs, 2019 to 2025: Multnomah, Franklin (Columbus) and Travis (Austin). How it was worked out: Central county employment as a percent of the metro's, 2025 less 2019, with fixed county lists. Source: U.S. Bureau of Labor Statistics, Quarterly Census of Employment and Wages, annual averages by industry
- -4.9%, +3.4% and +19.9% Change in jobs in those central counties, 2019 to 2025. Source: U.S. Bureau of Labor Statistics, Quarterly Census of Employment and Wages, annual averages by industry
- +0.1%, +6.2% and +23.0% Change in jobs in the three metro areas, 2019 to 2025. How it was worked out: County employment added up for each metro. Source: U.S. Bureau of Labor Statistics, Quarterly Census of Employment and Wages, annual averages by industry
Strongest evidence against. The region's flat total is partly the center's own loss, since Multnomah County held 43% of the metro's jobs in 2019: the rest of the metro grew 3.9%. So a flat region is as much a result of the center's fall as a cause of it.
Multnomah County's population gap to the central counties of Seattle, Denver and Minneapolis-St. Paul since 2020 is mostly lower immigration from abroad (58%) and fewer births relative to deaths (35%). People moving away to other parts of the country account for 7%.
3 figures, with sources and method
- 58% (a gap of 23.6 per 1,000 residents) Share of the population gap that is immigration from abroad. How it was worked out: Net international migration from July 2020 to July 2025 per 1,000 residents in 2020, Multnomah (17.8) less the median of King, Denver, and Hennepin and Ramsey together; divided by the sum of the three gaps. Source: U.S. Census Bureau, County Population Totals and Components of Change, Vintage 2025
- 35% (a gap of 14.3 per 1,000) Share of the gap that is births less deaths. How it was worked out: Same calculation with natural change. Multnomah's figure is 2.5 per 1,000. Source: U.S. Census Bureau, County Population Totals and Components of Change, Vintage 2025
- 7% (a gap of 3.0 per 1,000) Share of the gap that is moves within the United States. How it was worked out: Same calculation with net domestic migration. Multnomah's figure is -45.5 per 1,000; King -42.5, Denver -35.3, Hennepin and Ramsey -47.2. Source: U.S. Census Bureau, County Population Totals and Components of Change, Vintage 2025
Strongest evidence against. County immigration figures come from a Census Bureau model. The split is of the gap to other cities: of the county's own change, moves to the rest of the country (45.5 per 1,000 over five years) are the only part that is negative. The arithmetic does not say why immigrants went elsewhere.
Sources: U.S. Census Bureau, County Population Totals and Components of Change, Vintage 2025
State policy does not explain a loss concentrated in one county: if Oregon had added jobs at Washington's rate it would have about 58,000 more, and Multnomah County alone accounts for 87% of that.
3 figures, with sources and method
- 58,040 Jobs Oregon would have gained from 2019 to 2025 at Washington's statewide rate, beyond what it did gain. How it was worked out: Oregon's 2019 employment times Washington's 2019 to 2025 growth, less Oregon's 2025 employment. Source: U.S. Bureau of Labor Statistics, Quarterly Census of Employment and Wages, annual averages by industry
- 50,266 (87%) Multnomah County's part of that shortfall. How it was worked out: The same calculation for Multnomah County alone, divided by the Oregon figure. Source: U.S. Bureau of Labor Statistics, Quarterly Census of Employment and Wages, annual averages by industry
- +9.5% and +5.7% Job growth outside the main metro, 2019 to 2025: Washington and Oregon. Source: U.S. Bureau of Labor Statistics, Quarterly Census of Employment and Wages, annual averages by industry; U.S. Census Bureau, Metropolitan and Micropolitan Statistical Area Population Totals, Vintage 2025
Strongest evidence against. Washington outside Seattle did grow faster than Oregon outside Portland. Growth outside the metro cannot prove that state taxes have no effect inside it, and the Oregon suburbs were weak as well as the center.
Sources: U.S. Bureau of Labor Statistics, Quarterly Census of Employment and Wages, annual averages by industry; U.S. Census Bureau, Metropolitan and Micropolitan Statistical Area Population Totals, Vintage 2025
High-income filers were moving to Clark County, Washington before Portland's decline, and from the suburbs as much as from Portland: from 2019 to 2023 Clark County, Washington gained high-income tax filers against both Portland and the Oregon suburbs at similar rates.
3 figures, with sources and method
- -21.1 points Change in tax returns with income of $200,000 or more in Portland ZIP codes against Clark County, tax years 2019 to 2023. How it was worked out: Returns in the top income class in 26 Portland ZIP codes against all Clark County ZIP codes used. Growth on the Portland side less growth on the other side, measured as the change in the natural logarithm of the count, times 100. For small changes this is close to a difference in percentage points. Source: Internal Revenue Service, Statistics of Income, Individual Income Tax Statistics, ZIP Code Data
- -18.6 points The same change for Washington and Clackamas county ZIP codes against Clark County. How it was worked out: Returns in the top income class in 24 Washington and Clackamas county ZIP codes. Growth on the Portland side less growth on the other side, measured as the change in the natural logarithm of the count, times 100. For small changes this is close to a difference in percentage points. Source: Internal Revenue Service, Statistics of Income, Individual Income Tax Statistics, ZIP Code Data
- -3.3 and -4.6 points a year Yearly rate at which the Oregon suburbs fell against Clark County on the same measure, 2015 to 2019 and 2019 to 2023. How it was worked out: The change over each four-year span divided by four. Source: Internal Revenue Service, Statistics of Income, Individual Income Tax Statistics, ZIP Code Data
Strongest evidence against. Clark County also has more land to build on and kept building housing while the Oregon side did not, so the tax difference at the state line is not separated from housing supply. The $200,000 line is not adjusted for inflation, and ZIP codes only approximate city limits.
Sources: Internal Revenue Service, Statistics of Income, Individual Income Tax Statistics, ZIP Code Data
Rents jumped in 2015 and 2016 and the City declared a housing emergency on October 7, 2015, but the rate of people sleeping outside was about the same in 2019 as in 2015.
4 figures, with sources and method
- 10.9% Rise in median rent in Multnomah County, 2015 to 2016. How it was worked out: Median gross rent in 2016 divided by 2015, less one. Source: U.S. Census Bureau, American Community Survey 1-year estimates, tables B25064 (median gross rent) and B25004 (vacancy status)
- Lowest or second lowest every year (2.2% to 5.5%) Rank of the Portland region's share of empty rental homes among the ten regions, each year 2010 to 2017. How it was worked out: Vacant-for-rent units divided by occupied and vacant rental units, by metro area. Source: U.S. Census Bureau, American Community Survey 1-year estimates, tables B25064 (median gross rent) and B25004 (vacancy status)
- October 7, 2015 (Ordinance 187370) Date the City Council declared a housing emergency. Source: City of Portland, FIN 1.74, FY 2015-16 Revised Budget, Housing Emergency
- 23.9 and 25.1 People sleeping outside for every 10,000 Multnomah County residents, 2015 and 2019. How it was worked out: The unsheltered count divided by the county's population, times 10,000. Source: U.S. Department of Housing and Urban Development, 2007 to 2025 Point-in-Time Estimates by Continuum of Care; U.S. Census Bureau, County Population Totals and Components of Change, Vintage 2025
Strongest evidence against. The rent figures are survey estimates. Every second yearly homelessness figure is carried forward from the count before, because the full street count was done every two years.
Sources: U.S. Census Bureau, American Community Survey 1-year estimates, tables B25064 (median gross rent) and B25004 (vacancy status); City of Portland, FIN 1.74, FY 2015-16 Revised Budget, Housing Emergency; U.S. Department of Housing and Urban Development, 2007 to 2025 Point-in-Time Estimates by Continuum of Care; U.S. Census Bureau, County Population Totals and Components of Change, Vintage 2025
Nightly protests began on May 28, 2020; on June 17 the City Council voted 3 to 1 for a budget that eliminated 84 police officer positions without layoffs; police response slowed that month; and Portland had 49 homicides from June to December against 14 a year earlier.
6 figures, with sources and method
- Start of the protests. May 28, 2020, three days after the murder of George Floyd in Minneapolis Source: City of Portland; Independent Monitor LLC, The Handling of the 2020 Protests and Riots in Portland, Oregon: An Independent Review
- 3 in favor, 1 against (Ordinance 190005) Council vote on the budget ordinance, June 17, 2020. Source: City of Portland, Auditor, Official Minutes, Portland City Council, June 17 and 18, 2020
- Sworn police positions eliminated in that budget. 84: 38 with the Gun Violence Reduction Team, 14 school officers, 24 transit officers and 8 on the tactical team How it was worked out: The four reductions listed in the adopted budget, added together. Source: City of Portland, City Budget Office, Adopted Budget, Fiscal Year 2020-21, Volume One
- None Layoffs of police staff in that budget. Source: The Oregonian, republished by Gov1, Portland, Oregon rejects bid to cut $18M more from police
- 7.5, 12.2 and 16.4 Average minutes for police to reach the most urgent calls, May, June and August 2020. How it was worked out: The mean time from a high-priority call being received to an officer arriving, by month. Source: Portland Police Bureau, Police Dispatched Calls, open data
- 14 and 49 Homicides in Portland, June through December, 2019 and 2020. How it was worked out: Monthly counts reported by the Portland Police Bureau, added. January through May had 16 in 2019 and 4 in 2020. Source: Federal Bureau of Investigation, Crime Data Explorer, summarized offense counts by police agency
Strongest evidence against. The same months brought the pandemic, and homicide rose in every comparison city in 2020. The timing alone does not show that the budget vote caused either change.
Sources: City of Portland; Independent Monitor LLC, The Handling of the 2020 Protests and Riots in Portland, Oregon: An Independent Review; City of Portland, Auditor, Official Minutes, Portland City Council, June 17 and 18, 2020; City of Portland, City Budget Office, Adopted Budget, Fiscal Year 2020-21, Volume One; The Oregonian, republished by Gov1, Portland, Oregon rejects bid to cut $18M more from police; Portland Police Bureau, Police Dispatched Calls, open data; Federal Bureau of Investigation, Crime Data Explorer, summarized offense counts by police agency
Voters approved the county income tax on high earners and Measure 110 in November 2020; both took effect in early 2021, and criminal penalties for drug possession returned on September 1, 2024.
5 figures, with sources and method
- 64.09% yes Vote for Multnomah County Measure 26-214, Preschool for All, November 3, 2020. Source: Ballotpedia, Multnomah County, Oregon, Measure 26-214, Income Tax to Fund Tuition-Free Preschool Program (November 2020)
- January 1, 2021 First day the county income tax applied. Source: Multnomah County Elections, Multnomah County Voters' Pamphlet, General Election, November 3, 2020
- 58.46% yes Vote for Oregon Measure 110, November 3, 2020. Source: Ballotpedia, Oregon Measure 110, Drug Decriminalization and Addiction Treatment Initiative (2020)
- February 1, 2021 First day offenses fell under Measure 110. Source: Oregon Judicial Department, Measure 110 Class E Violations, through August 31, 2024
- September 1, 2024 Date possession became a crime again. Source: Oregon Legislative Assembly, House Bill 4002, 2024 Regular Session (Oregon Laws 2024, chapter 70)
Sources: Ballotpedia, Multnomah County, Oregon, Measure 26-214, Income Tax to Fund Tuition-Free Preschool Program (November 2020); Multnomah County Elections, Multnomah County Voters' Pamphlet, General Election, November 3, 2020; Ballotpedia, Oregon Measure 110, Drug Decriminalization and Addiction Treatment Initiative (2020); Oregon Judicial Department, Measure 110 Class E Violations, through August 31, 2024; Oregon Legislative Assembly, House Bill 4002, 2024 Regular Session (Oregon Laws 2024, chapter 70)
The early slide was a return to an older pattern and was confined to the central county: the suburbs kept pace.
4 figures, with sources and method
- -0.29 and -0.78 points a year Multnomah County's yearly job growth less the typical comparable county's, 2001 to 2015 and 2015 to 2019. How it was worked out: Taken from the saved output of the analysis and not recomputed for this page. Source: U.S. Bureau of Labor Statistics, Quarterly Census of Employment and Wages, County High-Level files
- Up to 34% (5,523 of 16,179 jobs) Share of the 2015 to 2019 shortfall that a return to the 2001 to 2015 pattern would account for. How it was worked out: 0.29 points a year carried through four years. The low end is zero, if the parity of 2010 to 2015 was the new normal. Source: U.S. Bureau of Labor Statistics, Quarterly Census of Employment and Wages, County High-Level files
- 91% (14,751 of 16,179 jobs) Share of the shortfall that would not exist if Multnomah County had grown as fast as the rest of its region. How it was worked out: The rest of the metro area grew 11.4% from 2015 to 2019. Taken from the saved output of the analysis and not recomputed for this page. Source: U.S. Bureau of Labor Statistics, Quarterly Census of Employment and Wages, annual averages by industry
- +1.4%, +7.1%, +19.9% and +44.1% Change in business applications, 2015 to 2019: Multnomah, Clackamas, Washington and Clark counties. Source: U.S. Census Bureau, Business Formation Statistics, annual business applications by county
Strongest evidence against. Where the gap sits does not say what caused it.
Sources: U.S. Bureau of Labor Statistics, Quarterly Census of Employment and Wages, annual averages by industry; U.S. Bureau of Labor Statistics, Quarterly Census of Employment and Wages, County High-Level files; U.S. Census Bureau, Business Formation Statistics, annual business applications by county
Between 23.5% and 30.9% of today's jobs gap had opened by 2019, and the earlier pace carried on for six more years would produce 46% of it.
2 figures, with sources and method
- 23.5% measured from 2015, 30.9% from 2010 Share of Multnomah County's 2025 jobs gap with the typical comparable county that had opened by 2019. How it was worked out: The gap in 2019 divided by the gap in 2025, each measured as Multnomah's base-year jobs times the middle growth of the nine, less its actual jobs. Source: U.S. Bureau of Labor Statistics, Quarterly Census of Employment and Wages, annual averages by industry; U.S. Bureau of Labor Statistics, Quarterly Census of Employment and Wages, County High-Level files
- 46% and 68% Share of the 2019 to 2025 gap that the 2015 to 2019 rate of falling behind would produce if it had continued: against all nine, and against the three most similar. How it was worked out: The gap opened from 2015 to 2019 in points a year (0.84 and 0.58), divided by the gap opened from 2019 to 2025 in points a year (1.83 and 0.86). Taken from the saved output of the analysis and not recomputed for this page. Source: U.S. Bureau of Labor Statistics, Quarterly Census of Employment and Wages, annual averages by industry
Strongest evidence against. The second figure assumes the earlier trend would have continued, which cannot be tested. The data fits a slow slide that sped up and a separate shock in 2020 equally well.
Sources: U.S. Bureau of Labor Statistics, Quarterly Census of Employment and Wages, annual averages by industry; U.S. Bureau of Labor Statistics, Quarterly Census of Employment and Wages, County High-Level files
Four new or higher local taxes were adopted from 2018 to 2020: the City's business tax rise, the surcharge on large retailers, the Metro homeless services taxes and the county income tax on high earners.
4 figures, with sources and method
- June 13, 2018 (Ordinance 189017) Date the City Council passed the business tax increase to 2.6%. Source: City of Portland, Ordinance 189017, amending the Business License Law rate (City Code 7.02.500)
- 65.21% yes Vote for the 1% surcharge on large retailers, Measure 26-201, November 6, 2018. Source: City of Portland, Auditor, Certification of the November 6, 2018 election results; City of Portland, Revenue Division, Clean Energy Surcharge
- 58% yes Vote for the Metro homeless services taxes, Measure 26-210, May 19, 2020. Source: Multnomah County Elections, May 19, 2020 Primary Election, Metro results summary; Ballotpedia, Portland Metro, Oregon, Measure 26-210, Income and Business Taxes for Homeless Services (May 2020)
- 64.09% yes Vote for the county income tax on high earners, Measure 26-214, November 3, 2020. Source: Ballotpedia, Multnomah County, Oregon, Measure 26-214, Income Tax to Fund Tuition-Free Preschool Program (November 2020)
Sources: City of Portland, Ordinance 189017, amending the Business License Law rate (City Code 7.02.500); City of Portland, Auditor, Certification of the November 6, 2018 election results; City of Portland, Revenue Division, Clean Energy Surcharge; Multnomah County Elections, May 19, 2020 Primary Election, Metro results summary; Ballotpedia, Portland Metro, Oregon, Measure 26-210, Income and Business Taxes for Homeless Services (May 2020); Ballotpedia, Multnomah County, Oregon, Measure 26-214, Income Tax to Fund Tuition-Free Preschool Program (November 2020); Multnomah County Elections, Multnomah County Voters' Pamphlet, General Election, November 3, 2020
Most of the extra income that left Multnomah County went beyond the three neighboring counties, and 19% went to Clark County, Washington.
2 figures, with sources and method
- Extra income leaving Multnomah County, 2020-21 to 2022-23 against the 2015-16 to 2018-19 pattern, by destination: Clark, Clackamas and Washington counties, and everywhere else. $332 million (19%), $133 million (8%), none (-$34 million) and $1,305 million (75%) How it was worked out: Income moving from Multnomah to each destination in the three later years, less three times the yearly average of the four earlier years; each divided by the total of $1,736 million. Source: Internal Revenue Service, Statistics of Income, U.S. Population Migration Data, county-to-county flows
- 8% and 15% Share of the $3.1 billion that is the steady flow to Clark County at its earlier pace, and the extra flow there since 2020. How it was worked out: Net income moving to Clark County: $86 million a year before, $729 million over the three later years. Source: Internal Revenue Service, Statistics of Income, U.S. Population Migration Data, county-to-county flows
Strongest evidence against. In total, more of the lost income went to Clackamas County (31%) than to Clark County (24%). The records do not show why anyone moved.
The police budget fell once, by 3.6%, in the budget adopted in June 2020, and was above its earlier level two years later.
1 figure, with sources and method
- $238.2 million, $229.5 million and $249.1 million Adopted Police Bureau budget, fiscal years 2019-20, 2020-21 and 2022-23. How it was worked out: All funds, not adjusted for inflation; the fall is 229.5 divided by 238.2, less one. Source: City of Portland, City Budget Office, Adopted Budget, Fiscal Year 2020-21, Volume One; City of Portland, City Budget Office, Adopted Budget, Fiscal Year 2022-23, Volume One
Strongest evidence against. Prices rose over the same years, so the budget bought less in 2022-23 than the same sum in 2019-20.
Sources: City of Portland, City Budget Office, Adopted Budget, Fiscal Year 2020-21, Volume One; City of Portland, City Budget Office, Adopted Budget, Fiscal Year 2022-23, Volume One
Police response to the most urgent calls slowed in June 2020 and kept slowing: the yearly average rose 135% from 2019 to 2025.
1 figure, with sources and method
- 8.3 and 19.5 (+135%) Average minutes to reach the most urgent calls, Portland, 2019 and 2025. How it was worked out: Mean response time to high-priority calls in the year. Source: Portland Police Bureau, Police Dispatched Calls, open data
Strongest evidence against. Comparable monthly figures are not published for most of the nine comparison cities, so this is Portland against its own past.
Sources: Portland Police Bureau, Police Dispatched Calls, open data
Three facts weigh against police cuts as the main cause: violent crime rose less in Portland than in the typical comparison city in 2020 itself, three of five neighboring police forces saw the same rise in serious assaults, and traffic stops had already fallen 67% without a rise in violence.
3 figures, with sources and method
- 108 and 115, with the earlier average set to 100 Violent crime rate in 2020 against the 2017 to 2019 average: Portland and the typical comparison city. Source: Federal Bureau of Investigation, Crime Data Explorer, summarized offense counts by police agency
- 161, 156, 158, 161, 136 and 94 Serious assault rate in 2025 against the 2017 to 2019 average: Portland, Beaverton, Vancouver, the county sheriff, Hillsboro and Gresham. How it was worked out: Aggravated assaults for every 100,000 residents, each force's own earlier average set to 100. Source: Federal Bureau of Investigation, Crime Data Explorer, summarized offense counts by police agency
- 67,792 and 22,488 (-67%) Driver stops by Portland police, 2012 and 2017. Source: Portland Police Bureau, Strategic Services Division, Stops Data Collection: 2022 Annual Report
Strongest evidence against. Homicide did not follow the neighbors' pattern: Portland's tripled while Vancouver's rose by about 75%.
Sources: Federal Bureau of Investigation, Crime Data Explorer, summarized offense counts by police agency; Portland Police Bureau, Strategic Services Division, Stops Data Collection: 2022 Annual Report
Portland has had the highest or second highest rate of homelessness of the ten areas in every count since 2007, and from 2015 to 2019 its rate of people sleeping outside changed about as much as elsewhere.
3 figures, with sources and method
- Rank of Multnomah County's total homelessness rate among the ten areas, 2007 to 2025. First or second every year; 56.1 for every 10,000 residents in 2007 against 24.6 in the typical area Source: U.S. Department of Housing and Urban Development, 2007 to 2025 Point-in-Time Estimates by Continuum of Care; U.S. Census Bureau, County Population Totals and Components of Change, Vintage 2025
- 2016 to 2020 Years in which Seattle and King County had a higher total rate. Source: U.S. Department of Housing and Urban Development, 2007 to 2025 Point-in-Time Estimates by Continuum of Care; U.S. Census Bureau, County Population Totals and Components of Change, Vintage 2025
- +1.2 and +1.3 Change in people sleeping outside for every 10,000 residents, 2015 to 2019: Multnomah County and the typical comparison area. Source: U.S. Department of Housing and Urban Development, 2007 to 2025 Point-in-Time Estimates by Continuum of Care; U.S. Census Bureau, County Population Totals and Components of Change, Vintage 2025
Strongest evidence against. Counts are of one night in January and methods differ between areas and years.
Sources: U.S. Department of Housing and Urban Development, 2007 to 2025 Point-in-Time Estimates by Continuum of Care; U.S. Census Bureau, County Population Totals and Components of Change, Vintage 2025
The rise after 2019 was larger than in any West Coast area checked, though over 2015 to 2023 Oakland and Sacramento rose more.
3 figures, with sources and method
- 24.6, 16.6 and 10.5 Rise in people sleeping outside for every 10,000 residents, 2019 to 2023: Multnomah County, Sacramento, and Seattle and King County. Source: U.S. Department of Housing and Urban Development, 2007 to 2025 Point-in-Time Estimates by Continuum of Care; U.S. Census Bureau, County Population Totals and Components of Change, Vintage 2025
- 25.8, 29.0 and 35.4 The same rise over 2015 to 2023: Multnomah County, Oakland and Alameda County, and Sacramento. Source: U.S. Department of Housing and Urban Development, 2007 to 2025 Point-in-Time Estimates by Continuum of Care; U.S. Census Bureau, County Population Totals and Components of Change, Vintage 2025
- 5,090 of 10,526 People added to Multnomah County's 2025 count from a list of people known to service providers. How it was worked out: The reason the 2025 count is left out of the comparison. Source: Multnomah County Homeless Services Department, 2025 Tri-County Point-in-Time Count Report, November 4, 2025
Strongest evidence against. Sacramento and Oakland ran no street count in 2023, so their figures use the 2022 count.
Sources: U.S. Department of Housing and Urban Development, 2007 to 2025 Point-in-Time Estimates by Continuum of Care; U.S. Census Bureau, County Population Totals and Components of Change, Vintage 2025; Multnomah County Homeless Services Department, 2025 Tri-County Point-in-Time Count Report, November 4, 2025
The joint City and County homeless services office left money unspent: it spent 74% of its budget in fiscal 2023, its lowest share in six years, and $36 million of the $52 million budgeted from the Metro tax in that tax's first year.
2 figures, with sources and method
- 109%, 115%, 94%, 74%, 103% and 89% Spending as a share of the adopted budget, fiscal years 2020 to 2025. Source: Multnomah County, Homeless Services Department, FY 2027 Adopted Budget
- $52 million and $36 million Metro homeless services tax money budgeted and spent by the office, year to June 30, 2022. Source: Willamette Week, Multnomah County Spent Less and Differently Than Planned on Homeless Services Last Year
Strongest evidence against. Unspent money does not show that spending it would have lowered the count.
Sources: Multnomah County, Homeless Services Department, FY 2027 Adopted Budget; Willamette Week, Multnomah County Spent Less and Differently Than Planned on Homeless Services Last Year
From September 2018 until June 2024, federal court rulings limited how cities in the western states could enforce bans on camping.
2 figures, with sources and method
- September 4, 2018 (Martin v. Boise) Date of the appeals court ruling. Source: U.S. Court of Appeals for the Ninth Circuit, Martin v. City of Boise, No. 15-35845
- June 28, 2024 (City of Grants Pass v. Johnson) Date the Supreme Court ended those limits. Source: Supreme Court of the United States, City of Grants Pass, Oregon v. Johnson, No. 23-175
Strongest evidence against. The rulings applied across nine western states, so they cannot explain why Portland's rise was larger than Seattle's or San Diego's.
Sources: U.S. Court of Appeals for the Ninth Circuit, Martin v. City of Boise, No. 15-35845; Supreme Court of the United States, City of Grants Pass, Oregon v. Johnson, No. 23-175
The City Council adopted the affordable housing mandate in December 2016 for buildings of 20 or more homes, effective February 1, 2017, and developers put about 19,000 homes into the pipeline before the deadline.
2 figures, with sources and method
- February 1, 2017; 20 or more homes Date the mandate took effect, and the size of building it covers. Source: City of Portland, Ordinance 188163, Inclusionary Housing, with the amendment record of December 13 and 14, 2016
- About 19,000 Homes vested between March 5, 2016 and February 1, 2017. Source: Portland Housing Bureau, 18-Month Review of the Inclusionary Housing Program
Strongest evidence against. The 19,000 is the Housing Bureau's estimate.
Sources: City of Portland, Ordinance 188163, Inclusionary Housing, with the amendment record of December 13 and 14, 2016; Portland Housing Bureau, 18-Month Review of the Inclusionary Housing Program
Three facts weigh against the mandate as the main cause. Seattle set a record for apartment approvals under its mandate. Portland's approvals kept falling through 2025 after it loosened the rule in January 2024, and rose only in the first nine months of 2026 (see U20). Rents and the share of empty apartments point to weak demand.
5 figures, with sources and method
- 10,552 Apartments approved in Seattle in 2021, the most in any year since 1990. How it was worked out: Units in buildings of five or more. Seattle's requirement applied citywide from 2019. Source: U.S. Census Bureau, Building Permits Survey, annual files; City of Seattle, Office of Housing, Mandatory Housing Affordability and Incentive Zoning, 2024 annual report
- January 31, 2024, and July 2025 Date the Council eased Portland's rule, and date it waived fees on new homes. Source: City of Portland, Office of Commissioner Carmen Rubio, Commissioner Rubio Passes Policy Reforms to Advance Housing Production; City of Portland, Office of the Mayor, Portland City Council Approves a Temporary SDC Exemption to Jumpstart Housing Development
- 893 and 705; 820 and 486 Apartments permitted in Portland, 2024 and 2025: the City's count and the Census count. Source: City of Portland, Portland Permitting and Development, Report on Temporary SDC Exemptions for Housing, August 15, 2025 through January 15, 2026; U.S. Census Bureau, Building Permits Survey, annual files
- 26% and 33% Rise in median rent, 2019 to 2024: Multnomah County and the typical comparable county. Source: U.S. Census Bureau, American Community Survey 1-year estimates, tables B25064 (median gross rent) and B25004 (vacancy status)
- 6.3%, second highest after Maricopa Share of rental homes empty in Multnomah County in 2024, and its rank among the ten counties. Source: U.S. Census Bureau, American Community Survey 1-year estimates, tables B25064 (median gross rent) and B25004 (vacancy status)
Strongest evidence against. The fee waiver took effect in August 2025, so 2025 is too early to judge it.
Sources: U.S. Census Bureau, Building Permits Survey, annual files; City of Seattle, Office of Housing, Mandatory Housing Affordability and Incentive Zoning, 2024 annual report; City of Portland, Office of Commissioner Carmen Rubio, Commissioner Rubio Passes Policy Reforms to Advance Housing Production; City of Portland, Office of the Mayor, Portland City Council Approves a Temporary SDC Exemption to Jumpstart Housing Development; City of Portland, Portland Permitting and Development, Report on Temporary SDC Exemptions for Housing, August 15, 2025 through January 15, 2026; U.S. Census Bureau, American Community Survey 1-year estimates, tables B25064 (median gross rent) and B25004 (vacancy status)
Measure 110 passed with 58.5% in November 2020, replaced criminal penalties for possessing small amounts of drugs with a violation carrying a fine of up to $100 from February 1, 2021, and was reversed from September 1, 2024.
3 figures, with sources and method
- 58.46% yes Vote for Measure 110. Source: Ballotpedia, Oregon Measure 110, Drug Decriminalization and Addiction Treatment Initiative (2020)
- A violation with a maximum fine of $100 Penalty under the measure. Source: Ballotpedia, Oregon Measure 110, Drug Decriminalization and Addiction Treatment Initiative (2020)
- February 1, 2021 to August 31, 2024 Dates in force. Source: Oregon Judicial Department, Measure 110 Class E Violations, through August 31, 2024; Oregon Legislative Assembly, House Bill 4002, 2024 Regular Session (Oregon Laws 2024, chapter 70)
Sources: Ballotpedia, Oregon Measure 110, Drug Decriminalization and Addiction Treatment Initiative (2020); Oregon Judicial Department, Measure 110 Class E Violations, through August 31, 2024; Oregon Legislative Assembly, House Bill 4002, 2024 Regular Session (Oregon Laws 2024, chapter 70)
The campaign for Measure 110 was about 99% paid for by four national donors.
4 figures, with sources and method
- $6,029,291 Raised in support. Source: Ballotpedia, Oregon Measure 110, Drug Decriminalization and Addiction Treatment Initiative (2020)
- $5,054,753 Given by Drug Policy Action. Source: Ballotpedia, Oregon Measure 110, Drug Decriminalization and Addiction Treatment Initiative (2020)
- 98.8% Share from four donors based outside Oregon. How it was worked out: $5,054,753, $500,000, $250,000 and $150,000 added and divided by the total. Source: Ballotpedia, Oregon Measure 110, Drug Decriminalization and Addiction Treatment Initiative (2020)
- $167,740 Raised in opposition. Source: Ballotpedia, Oregon Measure 110, Drug Decriminalization and Addiction Treatment Initiative (2020)
Strongest evidence against. The share is a minimum: only donors that could be placed outside Oregon are counted.
Sources: Ballotpedia, Oregon Measure 110, Drug Decriminalization and Addiction Treatment Initiative (2020)
Portland police had nearly stopped recording drug offenses eight months before Measure 110 took effect, and most of the measure's tickets ended with the person not appearing.
2 figures, with sources and method
- 189 and 20 Drug offenses recorded by Portland police, May 2020 and June 2020. How it was worked out: Offenses in the drug category, counted by month. Source: Portland Police Bureau, Reported Crime Data, open data
- 10,028 and 7,925 Measure 110 violation cases, and those that ended in a failure to appear. Source: Oregon Judicial Department, Measure 110 Class E Violations, through August 31, 2024
Sources: Portland Police Bureau, Reported Crime Data, open data; Oregon Judicial Department, Measure 110 Class E Violations, through August 31, 2024
Four statewide measures adopted since 2014 drew 50% or more of their yes-side money from outside Oregon; the Portland-area taxes and the charter change were mostly funded locally.
8 figures, with sources and method
- 58.5% and 98.8% Yes vote, and share of yes-side money from outside Oregon: Measure 110 (2020). How it was worked out: Contributions from donors based outside Oregon divided by all contributions to the yes side. Source: Ballotpedia, Oregon Measure 110, Drug Decriminalization and Addiction Treatment Initiative (2020)
- 55.8% and 68.8% ($3,675,000 of $5,341,127) The same for Measure 109 (2020). How it was worked out: Contributions from donors based outside Oregon divided by all contributions to the yes side. Source: Ballotpedia, Oregon Measure 109, Psilocybin Mushroom Services Program Initiative (2020)
- 50.7% and 60.0% ($1,905,679 of $3,174,984) The same for Measure 114 (2022). How it was worked out: Contributions from donors based outside Oregon divided by all contributions to the yes side. Source: Ballotpedia, Oregon Measure 114, Changes to Firearm Ownership and Purchase Requirements Initiative (2022)
- 56.1% and 50.5% ($4,665,000 of $9,246,174) The same for Measure 91 (2014). How it was worked out: Contributions from donors based outside Oregon divided by all contributions to the yes side. Source: Ballotpedia, Oregon Legalized Marijuana Initiative, Measure 91 (2014)
- 65% and 22% to 31%; opponents 24.9% The same for Portland Measure 26-201 (2018), and the share on the opposing side. How it was worked out: $168,624 to $235,803 of $757,702. Source: City of Portland, Auditor, Certification of the November 6, 2018 election results; Ballotpedia, Portland, Oregon, Measure 26-201, Renewable Energy Initiative (November 2018)
- 58% and 13.7% ($137,164 of $999,000) The same for Portland Measure 26-228 (2022). How it was worked out: Contributions from donors based outside Oregon divided by all contributions to the yes side. Source: Ballotpedia, Portland, Oregon, Measure 26-228, Changes to City Governance and Ranked-Choice Voting Measure (November 2022); KOIN 6 News, Opponents say out-of-state, big-money donors are influencing Portland charter vote
- 64% and 2.4% ($10,000 of $422,918) The same for Multnomah County Measure 26-214 (2020). How it was worked out: Contributions from donors based outside Oregon divided by all contributions to the yes side. Source: Ballotpedia, Multnomah County, Oregon, Measure 26-214, Income Tax to Fund Tuition-Free Preschool Program (November 2020)
- 58% and 2.3% ($30,000 of $1,289,091) The same for Metro Measure 26-210 (2020). How it was worked out: Contributions from donors based outside Oregon divided by all contributions to the yes side. Source: Multnomah County Elections, May 19, 2020 Primary Election, Metro results summary; Ballotpedia, Portland Metro, Oregon, Measure 26-210, Income and Business Taxes for Homeless Services (May 2020)
Strongest evidence against. All shares are minimums, built by placing each named donor by its headquarters; the state campaign finance system was not searched. For the four local measures the donor lists come from news reports and Ballotpedia and are incomplete.
Sources: Ballotpedia, Oregon Measure 110, Drug Decriminalization and Addiction Treatment Initiative (2020); Ballotpedia, Oregon Measure 109, Psilocybin Mushroom Services Program Initiative (2020); Ballotpedia, Oregon Measure 114, Changes to Firearm Ownership and Purchase Requirements Initiative (2022); Ballotpedia, Oregon Legalized Marijuana Initiative, Measure 91 (2014); Ballotpedia, Portland, Oregon, Measure 26-201, Renewable Energy Initiative (November 2018); Ballotpedia, Portland, Oregon, Measure 26-228, Changes to City Governance and Ranked-Choice Voting Measure (November 2022); Ballotpedia, Multnomah County, Oregon, Measure 26-214, Income Tax to Fund Tuition-Free Preschool Program (November 2020); Ballotpedia, Portland Metro, Oregon, Measure 26-210, Income and Business Taxes for Homeless Services (May 2020); City of Portland, Auditor, Certification of the November 6, 2018 election results; KOIN 6 News, Opponents say out-of-state, big-money donors are influencing Portland charter vote; Multnomah County Elections, May 19, 2020 Primary Election, Metro results summary
Two more statewide measures drew most of their yes-side money from outside Oregon and failed.
2 figures, with sources and method
- 42.7% and 83.4% ($6,817,898 of $8,176,516) Measure 103 (2018), a ban on grocery taxes: yes vote and share of yes-side money from outside Oregon. Source: Ballotpedia, Oregon Measure 103, Ban Tax on Groceries Initiative (2018)
- 31.8% and 56.5% ($5,169,505 of $9,144,517) Measure 90 (2014), a top-two primary: the same. Source: Ballotpedia, Oregon Open Primary Initiative, Measure 90 (2014)
Sources: Ballotpedia, Oregon Measure 103, Ban Tax on Groceries Initiative (2018); Ballotpedia, Oregon Open Primary Initiative, Measure 90 (2014)
National money reached one 2024 candidate race: the national Working Families Party sent $340,000 to its Oregon branch, most of which went to the sitting district attorney, who lost.
5 figures, with sources and method
- $340,000 Sent by the national party's committee to the Oregon party, April 20, 2024. Source: Willamette Week, A Virtually Invisible Political Party Reels in a Whopper of a Donation
- $294,937 Given by the Oregon party to the district attorney's campaign by May 10, 2024. Source: Willamette Week, Schmidt Continues to Collect Big Campaign Donations, Gaining Ground on Vasquez
- 35% National money as a share of what he had raised. How it was worked out: $294,937 plus $63,000 from a national drug policy group, divided by $1.026 million. Source: Willamette Week, Schmidt Continues to Collect Big Campaign Donations, Gaining Ground on Vasquez
- $1.123 million Raised by his opponent by the same date. Source: Willamette Week, Schmidt Continues to Collect Big Campaign Donations, Gaining Ground on Vasquez
- He lost the May 2024 election Result. Source: Portland Mercury, DA Mike Schmidt Concedes in Primary Election Marked by Big Spending, Progressive Upsets
Strongest evidence against. How much of his opponent's money came from outside Oregon was not measured, and money for candidates before 2020 was not counted.
Sources: Willamette Week, A Virtually Invisible Political Party Reels in a Whopper of a Donation; Willamette Week, Schmidt Continues to Collect Big Campaign Donations, Gaining Ground on Vasquez; Portland Mercury, DA Mike Schmidt Concedes in Primary Election Marked by Big Spending, Progressive Upsets
Downtown Portland had about as many residents for each job as comparable downtowns, and the Central City beat the housing goal of its 1988 plan.
4 figures, with sources and method
- 29 and 18; 37 and 36; 48 and 53 Residents for every 100 jobs within 0.75, 1.25 and 2 miles of the center: Portland and the typical comparable downtown. How it was worked out: 2020 census residents divided by 2019 jobs in census tracts within each distance. Taken from the saved output of the analysis and not recomputed for this page. Source: U.S. Census Bureau, LEHD Origin-Destination Employment Statistics (LODES), version 8, Workplace Area Characteristics; U.S. Census Bureau, LODES version 8 geography crosswalk
- At least 5,000 New homes the 1988 plan called for in the Central City by 2010. Source: City of Portland, Bureau of Planning, Central City Plan, adopted by the Portland City Council March 24, 1988
- 8,155 Homes in the River District in 2008. Source: Portland Development Commission, Central City Housing Inventory, 2008
- 1,900 and 47,700 Households and jobs in the Downtown subdistrict in 2010. Source: City of Portland, Bureau of Planning and Sustainability, Central City 2035 Plan
Strongest evidence against. Within two miles Portland has somewhat fewer residents per job than the typical comparable downtown.
Sources: U.S. Census Bureau, LEHD Origin-Destination Employment Statistics (LODES), version 8, Workplace Area Characteristics; U.S. Census Bureau, LODES version 8 geography crosswalk; City of Portland, Bureau of Planning, Central City Plan, adopted by the Portland City Council March 24, 1988; Portland Development Commission, Central City Housing Inventory, 2008; City of Portland, Bureau of Planning and Sustainability, Central City 2035 Plan
The county’s loss is broad. Factories, retail and wholesale lost 15,800 jobs, equal to 61% of the net loss, and Multnomah had the largest fall of ten comparison counties in manufacturing, wholesale, banking and insurance, office work, and restaurants and hotels alike. Why the county lost 20.8% of its factory jobs is not established. None of the explanations for downtown reaches those jobs.
3 figures, with sources and method
- Not a cause, so it has no range Share of the loss this can account for. How it was worked out: Each end of a range comes from a separate calculation on Census block job counts, federal payroll counts by county or Census counts of businesses by ZIP code. The ranges overlap and cannot be added together. Source: U.S. Census Bureau, LEHD Origin-Destination Employment Statistics (LODES), version 8, Workplace Area Characteristics; U.S. Census Bureau, LODES version 8 geography crosswalk; U.S. Bureau of Labor Statistics, Quarterly Census of Employment and Wages, annual averages by industry; U.S. Census Bureau, County Business Patterns, ZIP Code Business Patterns
- What decides it. Manufacturing lost 7,410 jobs (20.8%), retail 5,817 (13.6%) and wholesale 2,573 (11.0%): together 15,800, equal to 61% of the county’s net loss. Office jobs are 47% and restaurants, hotels, entertainment and personal services 41%. Source: U.S. Census Bureau, LEHD Origin-Destination Employment Statistics (LODES), version 8, Workplace Area Characteristics; U.S. Census Bureau, LODES version 8 geography crosswalk; U.S. Bureau of Labor Statistics, Quarterly Census of Employment and Wages, annual averages by industry; U.S. Census Bureau, County Business Patterns, ZIP Code Business Patterns
- What decides it. These shares overlap and add to more than 100% because hospitals, warehouses and government added about 17,100 jobs. Source: U.S. Census Bureau, LEHD Origin-Destination Employment Statistics (LODES), version 8, Workplace Area Characteristics; U.S. Census Bureau, LODES version 8 geography crosswalk; U.S. Bureau of Labor Statistics, Quarterly Census of Employment and Wages, annual averages by industry; U.S. Census Bureau, County Business Patterns, ZIP Code Business Patterns
Strongest evidence against. A count by industry shows where the loss is and cannot show why. King County’s retail figures are distorted by a 2022 reclassification of about 50,000 jobs, so the comparison with Seattle cannot be used for retail.
Sources: U.S. Census Bureau, LEHD Origin-Destination Employment Statistics (LODES), version 8, Workplace Area Characteristics; U.S. Census Bureau, LODES version 8 geography crosswalk; U.S. Bureau of Labor Statistics, Quarterly Census of Employment and Wages, annual averages by industry; U.S. Census Bureau, County Business Patterns, ZIP Code Business Patterns
Portland’s mix of industries does not explain why its downtown lost more. Restaurants, hotels and head offices shrank in downtown Seattle, Denver and Minneapolis too. Those downtowns did not have Portland’s loss in finance, professional services and information.
5 figures, with sources and method
- −32%, −24%, −18%, −12% Change in hotel and restaurant jobs within 0.75 miles of the center, 2019 to 2024: Portland, Seattle, Denver, Minneapolis. How it was worked out: LODES sector CNS18. Each downtown is the blocks within 0.75 miles of its center point. The comparison downtowns use the center points of the cross-city analysis, which for Portland is 0.1 miles from the point used elsewhere on this page. Source: U.S. Census Bureau, LEHD Origin-Destination Employment Statistics (LODES), version 8, Workplace Area Characteristics; U.S. Census Bureau, LODES version 8 geography crosswalk
- −13%, +0.1%, −0.3% Change in professional and technical services jobs: Portland, Seattle, Minneapolis. How it was worked out: LODES sector CNS12, same areas. The sector rose in five of the other seven comparison downtowns. Phoenix’s fall of 46% is one block. Source: U.S. Census Bureau, LEHD Origin-Destination Employment Statistics (LODES), version 8, Workplace Area Characteristics; U.S. Census Bureau, LODES version 8 geography crosswalk
- 5 rose, 4 fell Comparison downtowns where information jobs rose and where they fell. How it was worked out: LODES sector CNS09. Seattle’s figure is not used on its own because two blocks with reporting changes move it from −5.6% to +2.9%. Source: U.S. Census Bureau, LEHD Origin-Destination Employment Statistics (LODES), version 8, Workplace Area Characteristics; U.S. Census Bureau, LODES version 8 geography crosswalk
- 0 to −3,000 jobs Downtown Portland’s change if each industry had moved at downtown Seattle’s rate. How it was worked out: Each Portland sector’s 2019 jobs times the percent change of the same sector in downtown Seattle, added up. The range covers the 0.5 and 0.75 mile areas, end years 2023 and 2024, and leaving out blocks where 1,000 or more jobs in a sector appear or vanish in one year. Source: U.S. Census Bureau, LEHD Origin-Destination Employment Statistics (LODES), version 8, Workplace Area Characteristics; U.S. Census Bureau, LODES version 8 geography crosswalk
- −3,000 to −7,500 jobs The same at downtown Minneapolis rates. How it was worked out: Same calculation with downtown Minneapolis rates. Source: U.S. Census Bureau, LEHD Origin-Destination Employment Statistics (LODES), version 8, Workplace Area Characteristics; U.S. Census Bureau, LODES version 8 geography crosswalk
Strongest evidence against. Single-industry figures for other downtowns include reporting changes. Denver’s education count gained 12,386 jobs on one block in 2024, and a Denver government block is missing in 2023. The comparison is steadier across all industries than for any one. In every version tested, Portland’s loss was at least 2 times the figure at Minneapolis rates and 4 times the figure at Seattle rates.
Sources: U.S. Census Bureau, LEHD Origin-Destination Employment Statistics (LODES), version 8, Workplace Area Characteristics; U.S. Census Bureau, LODES version 8 geography crosswalk
The loss is concentrated in Multnomah County. Across all seven counties of the Portland area, private jobs fell 0.8% from 2019 to 2025, still the weakest of ten areas, while private jobs outside Multnomah County rose 3.8%.
6 figures, with sources and method
- 42% Multnomah County’s share of the Portland area’s private jobs in 2019. How it was worked out: 447,067 private jobs in Multnomah County divided by 1,061,722 in the metropolitan area. Maricopa, Salt Lake and San Diego counties hold 98% to 100% of their areas, King County 71% and Denver County 35%. Source: U.S. Bureau of Labor Statistics, Quarterly Census of Employment and Wages, annual averages by area; U.S. Bureau of Labor Statistics, Quarterly Census of Employment and Wages, annual averages by county and detailed industry
- −7.0%, −0.8%, +3.8% Change in private jobs, 2019 to 2025: Multnomah County, the whole area, and the area outside Multnomah County. How it was worked out: County annual averages added up for the counties of each metro area. Source: U.S. Bureau of Labor Statistics, Quarterly Census of Employment and Wages, annual averages by area; U.S. Bureau of Labor Statistics, Quarterly Census of Employment and Wages, annual averages by county and detailed industry
- about 4 Industries, of 26, where the whole Portland area ranks last of ten areas. How it was worked out: The same ranking as for the central counties, with every county in each area added together. A county whose figure is withheld in either year is left out of both, so the area sums are approximate. The four are architecture and engineering, advertising, transportation, and restaurants and bars. The San Diego area is last in 7 and Minneapolis-St. Paul in 5. Source: U.S. Bureau of Labor Statistics, Quarterly Census of Employment and Wages, annual averages by area
- −387 and +885 Securities and investment jobs: change in Multnomah County, and in Washington, Clackamas and Clark counties together. Source: U.S. Bureau of Labor Statistics, Quarterly Census of Employment and Wages, annual averages by area
- −406 and +933 Architecture and engineering jobs: change in Multnomah County, and in the same three counties. Source: U.S. Bureau of Labor Statistics, Quarterly Census of Employment and Wages, annual averages by area
- +3.3% and +15.2% Jobs at doctors’ offices and clinics: change in Multnomah County, and in the same three counties. Source: U.S. Bureau of Labor Statistics, Quarterly Census of Employment and Wages, annual averages by area
Strongest evidence against. Measured across the whole area, Portland is still below the middle of the other nine areas in about 25 of the industries compared. Head offices and banks lost jobs in the suburban counties as well as in Multnomah.
Sources: U.S. Bureau of Labor Statistics, Quarterly Census of Employment and Wages, annual averages by area; U.S. Bureau of Labor Statistics, Quarterly Census of Employment and Wages, annual averages by county and detailed industry
A separate federal payroll count confirms that Multnomah County lost jobs from 2019 to 2024, and it shows a larger loss than the block records do: 21,014 jobs against 16,181. This check covers the whole county, because the payroll count is not published for areas smaller than a county.
10 figures, with sources and method
- -16,181 (-3.0%), 533,622 to 517,441 Change in all jobs in Multnomah County, 2019 to 2024, from the block records (LODES). How it was worked out: Jobs in every Multnomah County census block, summed. LODES counts jobs in the second quarter. Source: U.S. Census Bureau, LEHD Origin-Destination Employment Statistics (LODES), version 8, Workplace Area Characteristics; U.S. Census Bureau, LODES version 8 geography crosswalk
- -21,014 (-4.0%), 520,002 to 498,988 The same change from the payroll count (QCEW). How it was worked out: Annual average employment, all ownerships. Source: U.S. Bureau of Labor Statistics, Quarterly Census of Employment and Wages, annual averages by area
- 130% The payroll count as a share of the block-record loss. How it was worked out: 21,014 divided by 16,181. Source: U.S. Census Bureau, LEHD Origin-Destination Employment Statistics (LODES), version 8, Workplace Area Characteristics; U.S. Census Bureau, LODES version 8 geography crosswalk; U.S. Bureau of Labor Statistics, Quarterly Census of Employment and Wages, annual averages by area
- -18,462 and -24,918 Change in private jobs: block records and payroll count. How it was worked out: LODES private jobs (JT02) by block, summed for the county; QCEW private ownership. Source: U.S. Census Bureau, LODES version 8, Workplace Area Characteristics by ownership: private jobs (JT02) and federal jobs (JT04); U.S. Census Bureau, LODES version 8 geography crosswalk; U.S. Bureau of Labor Statistics, Quarterly Census of Employment and Wages, annual averages by area
- +2,276 and +3,747 Change in state and local government jobs: block records and payroll count. How it was worked out: LODES all jobs less private and federal jobs; QCEW state (+1,041) and local (+2,706) added. Source: U.S. Census Bureau, LEHD Origin-Destination Employment Statistics (LODES), version 8, Workplace Area Characteristics; U.S. Census Bureau, LODES version 8, Workplace Area Characteristics by ownership: private jobs (JT02) and federal jobs (JT04); U.S. Census Bureau, LODES version 8 geography crosswalk; U.S. Bureau of Labor Statistics, Quarterly Census of Employment and Wages, annual averages by area
- -4,501 and -4,684 Change in private finance and insurance jobs: block records and payroll count. Source: U.S. Census Bureau, LODES version 8, Workplace Area Characteristics by ownership: private jobs (JT02) and federal jobs (JT04); U.S. Census Bureau, LODES version 8 geography crosswalk; U.S. Bureau of Labor Statistics, Quarterly Census of Employment and Wages, annual averages by area
- -7,396 and -7,175 Change in private accommodation and food services jobs: block records and payroll count. Source: U.S. Census Bureau, LODES version 8, Workplace Area Characteristics by ownership: private jobs (JT02) and federal jobs (JT04); U.S. Census Bureau, LODES version 8 geography crosswalk; U.S. Bureau of Labor Statistics, Quarterly Census of Employment and Wages, annual averages by area
- -6,320 and -6,185 Change in private manufacturing jobs: block records and payroll count. Source: U.S. Census Bureau, LODES version 8, Workplace Area Characteristics by ownership: private jobs (JT02) and federal jobs (JT04); U.S. Census Bureau, LODES version 8 geography crosswalk; U.S. Bureau of Labor Statistics, Quarterly Census of Employment and Wages, annual averages by area
- -2,440 and -3,003 Change in private management of companies jobs: block records and payroll count. Source: U.S. Census Bureau, LODES version 8, Workplace Area Characteristics by ownership: private jobs (JT02) and federal jobs (JT04); U.S. Census Bureau, LODES version 8 geography crosswalk; U.S. Bureau of Labor Statistics, Quarterly Census of Employment and Wages, annual averages by area
- +1,610 and -577 Change in private professional and technical services jobs: block records and payroll count. How it was worked out: The one large office sector where the two sources disagree on the direction. Source: U.S. Census Bureau, LODES version 8, Workplace Area Characteristics by ownership: private jobs (JT02) and federal jobs (JT04); U.S. Census Bureau, LODES version 8 geography crosswalk; U.S. Bureau of Labor Statistics, Quarterly Census of Employment and Wages, annual averages by area
Strongest evidence against. Both sources start from what employers report to the state for unemployment insurance, so they share any error in the address an employer gives; agreement between them does not rule out a reporting change. The county check also says nothing about where inside the county the jobs were lost. The two sources disagree on professional and technical services.
Sources: U.S. Census Bureau, LEHD Origin-Destination Employment Statistics (LODES), version 8, Workplace Area Characteristics; U.S. Census Bureau, LODES version 8 geography crosswalk; U.S. Census Bureau, LODES version 8, Workplace Area Characteristics by ownership: private jobs (JT02) and federal jobs (JT04); U.S. Bureau of Labor Statistics, Quarterly Census of Employment and Wages, annual averages by area
A Census count of businesses by ZIP code, which does not rest on state payroll reports, confirms 76% of the private job loss in the four downtown ZIP codes from 2019 to 2023: 8,924 jobs against 11,711 in the block records. In the core ZIP code, 97204, it confirms 50%.
8 figures, with sources and method
- -11,711 (-11.3%), 103,874 to 92,163 Change in private jobs in ZIP codes 97201, 97204, 97205 and 97209, 2019 to 2023, from the block records. How it was worked out: LODES private jobs (JT02) in blocks the crosswalk places in each ZIP code area, summed. Source: U.S. Census Bureau, LODES version 8, Workplace Area Characteristics by ownership: private jobs (JT02) and federal jobs (JT04); U.S. Census Bureau, LODES version 8 geography crosswalk
- -8,924 (-8.6%), 103,664 to 94,740 The same change from Census ZIP Code Business Patterns. How it was worked out: Mid-March employment, all industries, for the four ZIP codes added together. Source: U.S. Census Bureau, County Business Patterns, ZIP Code Business Patterns: employment and establishments
- 76% Share of the block-record loss that the ZIP count confirms, four ZIP codes. How it was worked out: 8,924 divided by 11,711. Source: U.S. Census Bureau, LODES version 8, Workplace Area Characteristics by ownership: private jobs (JT02) and federal jobs (JT04); U.S. Census Bureau, LODES version 8 geography crosswalk; U.S. Census Bureau, County Business Patterns, ZIP Code Business Patterns: employment and establishments
- -6,106 and -3,023, so 50% ZIP code 97204, the core of downtown: block records and ZIP count. How it was worked out: 3,023 divided by 6,106. Source: U.S. Census Bureau, LODES version 8, Workplace Area Characteristics by ownership: private jobs (JT02) and federal jobs (JT04); U.S. Census Bureau, LODES version 8 geography crosswalk; U.S. Census Bureau, County Business Patterns, ZIP Code Business Patterns: employment and establishments
- -3,684 and -1,904, so 52% ZIP code 97205: block records and ZIP count. Source: U.S. Census Bureau, LODES version 8, Workplace Area Characteristics by ownership: private jobs (JT02) and federal jobs (JT04); U.S. Census Bureau, LODES version 8 geography crosswalk; U.S. Census Bureau, County Business Patterns, ZIP Code Business Patterns: employment and establishments
- -1,905 and -129, so 7% ZIP code 97201: block records and ZIP count. Source: U.S. Census Bureau, LODES version 8, Workplace Area Characteristics by ownership: private jobs (JT02) and federal jobs (JT04); U.S. Census Bureau, LODES version 8 geography crosswalk; U.S. Census Bureau, County Business Patterns, ZIP Code Business Patterns: employment and establishments
- -16 and -3,868 ZIP code 97209: block records and ZIP count. How it was worked out: Here the ZIP count shows a large loss and the block records almost none. Source: U.S. Census Bureau, LODES version 8, Workplace Area Characteristics by ownership: private jobs (JT02) and federal jobs (JT04); U.S. Census Bureau, LODES version 8 geography crosswalk; U.S. Census Bureau, County Business Patterns, ZIP Code Business Patterns: employment and establishments
- -12.7% (4,962 to 4,334) Change in the number of business establishments in the four ZIP codes, 2019 to 2023. Source: U.S. Census Bureau, County Business Patterns, ZIP Code Business Patterns: employment and establishments
Strongest evidence against. In the core ZIP code the independent count finds only 50% of the loss, so up to 50% of the loss there through 2023 could be a matter of timing or of the address employers report. The two sources disagree widely in single ZIP codes (7% in 97201, and the reverse in 97209), and agree only when the four are added. ZIP codes and the ZIP code areas used for the block records differ slightly. The ZIP count ends in 2023, so nothing checks 2024, the year of some of the largest office losses.
Sources: U.S. Census Bureau, LODES version 8, Workplace Area Characteristics by ownership: private jobs (JT02) and federal jobs (JT04); U.S. Census Bureau, LODES version 8 geography crosswalk; U.S. Census Bureau, County Business Patterns, ZIP Code Business Patterns: employment and establishments
Downtown's job count reached its low in 2021. Since then restaurant, hotel and shop jobs have recovered by 4,547 while office jobs fell by another 5,121, spread over 2021, 2022 and 2024. 33% of the downtown office loss came after 2022. The 88% given in claim S2 is a countywide figure that counts a broader group of industries through 2025; counted the same way as downtown, the county figure is 61% to 72%.
11 figures, with sources and method
- 103,281, 94,591, 86,818, 89,052, 90,592, 86,842 All jobs within 0.75 mile of the center, each year 2019 to 2024. How it was worked out: Jobs in City of Portland census blocks whose internal point is within 0.75 mile of latitude 45.5189, longitude -122.6793, summed. All jobs, counted at the address the employer reports. Source: U.S. Census Bureau, LEHD Origin-Destination Employment Statistics (LODES), version 8, Workplace Area Characteristics; U.S. Census Bureau, LODES version 8 geography crosswalk
- 49,680, 49,425, 46,537, 44,114, 44,047, 41,416 Office-type jobs within 0.75 mile, each year 2019 to 2024. How it was worked out: Office-type jobs are LODES sectors CNS09 to CNS13: information; finance and insurance; real estate; professional and technical services; management of companies. Source: U.S. Census Bureau, LEHD Origin-Destination Employment Statistics (LODES), version 8, Workplace Area Characteristics; U.S. Census Bureau, LODES version 8 geography crosswalk
- 3%, 35%, 29%, 1%, 32% Share of the 2019 to 2024 fall in downtown office-type jobs that came in each year, 2020 to 2024. How it was worked out: Each year's fall divided by the whole fall of 8,264. Source: U.S. Census Bureau, LEHD Origin-Destination Employment Statistics (LODES), version 8, Workplace Area Characteristics; U.S. Census Bureau, LODES version 8 geography crosswalk
- 33% (2,698 of 8,264) Share of the downtown office-type loss that came after 2022. How it was worked out: The 2022 count less the 2024 count, divided by the 2019 count less the 2024 count. Source: U.S. Census Bureau, LEHD Origin-Destination Employment Statistics (LODES), version 8, Workplace Area Characteristics; U.S. Census Bureau, LODES version 8 geography crosswalk
- 22,360, 11,782 and 16,329 Jobs in restaurants, hotels, shops and other consumer services within 0.75 mile: 2019, 2021 and 2024. How it was worked out: LODES sectors CNS07, CNS17, CNS18 and CNS19. Source: U.S. Census Bureau, LEHD Origin-Destination Employment Statistics (LODES), version 8, Workplace Area Characteristics; U.S. Census Bureau, LODES version 8 geography crosswalk
- 61% (3,823 of 6,267) Multnomah County private office-type jobs: share of the 2019 to 2024 loss after 2022, block records. How it was worked out: LODES private jobs in the same five sectors, summed for the county: 109,429 in 2019, 106,985 in 2022, 103,162 in 2024. Source: U.S. Census Bureau, LODES version 8, Workplace Area Characteristics by ownership: private jobs (JT02) and federal jobs (JT04); U.S. Census Bureau, LODES version 8 geography crosswalk
- 66% and 72% The same share from the payroll count, 2019 to 2024 and 2019 to 2025. How it was worked out: QCEW private employment in NAICS sectors 51 to 55, added: 102,296 in 2019, 98,854 in 2022, 92,280 in 2024 and 90,192 in 2025. Source: U.S. Bureau of Labor Statistics, Quarterly Census of Employment and Wages, annual averages by area
- 88% The share in claim S2. How it was worked out: See S2. That figure runs to 2025 and counts three broad industry groups, which include administrative and support services; the figures above count five sectors. Source: U.S. Bureau of Labor Statistics, Quarterly Census of Employment and Wages, annual averages by industry
- 1,410, 1,360, 1,061, 679, 609, 222 Finance and insurance jobs at the U.S. Bancorp Tower block, each year 2019 to 2024. How it was worked out: The bank announced in September 2024 that it would not renew most of its lease. Source: U.S. Census Bureau, LEHD Origin-Destination Employment Statistics (LODES), version 8, Workplace Area Characteristics; U.S. Census Bureau, LODES version 8 geography crosswalk; Portland Tribune, U.S. Bank to leave iconic, pink Portland high-rise named after it
- 1,695, 1,621, 1,171, 290, 331, 356 Finance and insurance jobs at the Standard Plaza block, each year 2019 to 2024. How it was worked out: The chief executive's statement on hybrid work was published in December 2020. Source: U.S. Census Bureau, LEHD Origin-Destination Employment Statistics (LODES), version 8, Workplace Area Characteristics; U.S. Census Bureau, LODES version 8 geography crosswalk; Oregon Business, Future of Work: 'I Would Like to Have the Option to Return to Downtown Portland'
- 573, 610, 445, 259, 180, 118 Finance and insurance jobs at the Liberty Centre block, each year 2019 to 2024. How it was worked out: Liberty Mutual announced in September 2022 that it would leave at the end of that year. Source: U.S. Census Bureau, LEHD Origin-Destination Employment Statistics (LODES), version 8, Workplace Area Characteristics; U.S. Census Bureau, LODES version 8 geography crosswalk; Willamette Week, Liberty Mutual Insurance to End Lease in Lloyd District Building That Bears Its Name and Move to Lake Oswego
Strongest evidence against. The block records count jobs in the second quarter and the payroll count is an annual average, so the two can place the same change in different years. The records can also lag: the county courts' 2020 move shows in 2023. On three of the largest blocks the jobs fell before the employer announced it would give up space, which fits employers changing where staff are reported before leaving, but that reading is ours.
Sources: U.S. Census Bureau, LEHD Origin-Destination Employment Statistics (LODES), version 8, Workplace Area Characteristics; U.S. Census Bureau, LODES version 8 geography crosswalk; U.S. Census Bureau, LODES version 8, Workplace Area Characteristics by ownership: private jobs (JT02) and federal jobs (JT04); U.S. Bureau of Labor Statistics, Quarterly Census of Employment and Wages, annual averages by area; U.S. Bureau of Labor Statistics, Quarterly Census of Employment and Wages, annual averages by industry; Portland Tribune, U.S. Bank to leave iconic, pink Portland high-rise named after it; Oregon Business, Future of Work: 'I Would Like to Have the Option to Return to Downtown Portland'; Willamette Week, Liberty Mutual Insurance to End Lease in Lloyd District Building That Bears Its Name and Move to Lake Oswego
Office-type jobs in Portland beyond 2 miles from the center rose by 6,382, or 21.8%, from 2019 to 2024. The gain is spread over 2,375 blocks, and its two largest pieces are a hospital system's office park and a truck maker's headquarters. Neither is an office that left downtown.
8 figures, with sources and method
- 29,221 and 35,603 (+6,382, +21.8%) Office-type jobs in Portland beyond 2 miles from the center, 2019 and 2024. How it was worked out: City of Portland census blocks whose internal point is more than 2 miles from the downtown point. Office-type jobs are LODES sectors CNS09 to CNS13: information; finance and insurance; real estate; professional and technical services; management of companies. Source: U.S. Census Bureau, LEHD Origin-Destination Employment Statistics (LODES), version 8, Workplace Area Characteristics; U.S. Census Bureau, LODES version 8 geography crosswalk
- The largest parts of that rise by sector. Professional and technical services +3,845; information +2,096 How it was worked out: 12,068 to 15,913 and 3,255 to 5,351. Source: U.S. Census Bureau, LEHD Origin-Destination Employment Statistics (LODES), version 8, Workplace Area Characteristics; U.S. Census Bureau, LODES version 8 geography crosswalk
- +15,104 on 2,375 blocks; -8,722 on 1,292 blocks Gross gains and gross losses in office-type jobs beyond 2 miles. How it was worked out: The change on every block that rose, and on every block that fell, added separately. Source: U.S. Census Bureau, LEHD Origin-Destination Employment Statistics (LODES), version 8, Workplace Area Characteristics; U.S. Census Bureau, LODES version 8 geography crosswalk
- Largest gaining block: the Providence office park at NE 47th Ave and NE Halsey St. +905 office-type jobs; professional and technical services 823 to 1,707 How it was worked out: The step came in 2021, when professional and technical jobs on the block went from 794 to 1,746. Source: U.S. Census Bureau, LEHD Origin-Destination Employment Statistics (LODES), version 8, Workplace Area Characteristics; U.S. Census Bureau, LODES version 8 geography crosswalk; JE Dunn Construction, Providence Office Park Regional Campus
- Second largest: the Daimler Truck North America headquarters block on Swan Island. +788 office-type jobs; management of companies 2,032 to 2,745 Source: U.S. Census Bureau, LEHD Origin-Destination Employment Statistics (LODES), version 8, Workplace Area Characteristics; U.S. Census Bureau, LODES version 8 geography crosswalk; KATU, Daimler Truck to end production in Portland, eliminate 375 jobs
- +15.3% The rise beyond 2 miles without its three largest blocks. How it was worked out: The three largest gains (905, 788 and 217) taken out of the 2024 count. Source: U.S. Census Bureau, LEHD Origin-Destination Employment Statistics (LODES), version 8, Workplace Area Characteristics; U.S. Census Bureau, LODES version 8 geography crosswalk
- 27,835 and 23,708 (-14.8%) Office-type jobs in Portland between 0.75 and 2 miles from the center, 2019 and 2024. Source: U.S. Census Bureau, LEHD Origin-Destination Employment Statistics (LODES), version 8, Workplace Area Characteristics; U.S. Census Bureau, LODES version 8 geography crosswalk
- 0 and 338; 273 and 0 A suburban match: finance and insurance jobs on a Tigard block, 2023 and 2024, beside the Unitus Plaza block downtown. How it was worked out: The credit union announced in August 2022 that it would move its headquarters to several locations, one in Tigard. The match of the two blocks to it is inferred. Source: U.S. Census Bureau, LEHD Origin-Destination Employment Statistics (LODES), version 8, Workplace Area Characteristics; U.S. Census Bureau, LODES version 8 geography crosswalk; KPTV, More businesses announce they're leaving downtown Portland
Strongest evidence against. The step at the Providence block in 2021 may itself be existing staff newly reported at that address. Many gaining blocks went from no office jobs to about a hundred in residential or small commercial areas, which could be small firms or could be remote staff reported at a firm's small new address; the records cannot tell these apart. The employers on the gaining blocks were not identified beyond the two largest.
Sources: U.S. Census Bureau, LEHD Origin-Destination Employment Statistics (LODES), version 8, Workplace Area Characteristics; U.S. Census Bureau, LODES version 8 geography crosswalk; JE Dunn Construction, Providence Office Park Regional Campus; KATU, Daimler Truck to end production in Portland, eliminate 375 jobs; KPTV, More businesses announce they're leaving downtown Portland
Likely 34 claims: S1, L1, L2, L3, L5, F19, F25, F35, F46, F48, F49, F51, U1, U5, U11, U12, U17, A1, A2, A3, A4, A5, A6, A7, A8, M1, M2, M3, M4, M5, M6, M7, M9, B9
Multnomah County began losing ground to its suburbs again about 2013 to 2015, before the pandemic and before the taxes and housing rules of 2016 to 2019, and the cause is not known.
7 figures, with sources and method
- +10.3% Growth in jobs in the City of Portland, 2013 to 2017. How it was worked out: Jobs in census blocks inside the 2020 Portland city boundary, summed. A job is counted at the address the employer reports. Source: U.S. Census Bureau, LEHD Origin-Destination Employment Statistics (LODES), version 8, Workplace Area Characteristics; U.S. Census Bureau, LODES version 8 geography crosswalk
- 44.0% and 44.4% Multnomah County's share of jobs in Multnomah, Washington, Clackamas and Clark counties, 2008 and 2014. How it was worked out: Multnomah County total employment divided by the four-county total. The share held steady over these years and fell in every year from 2015. Source: U.S. Bureau of Economic Analysis, Total full-time and part-time employment by industry, counties, 2001 to 2022 (table CAEMP25N)
- +15.6% Growth in jobs in Washington and Clackamas counties, 2013 to 2017. How it was worked out: Jobs in census blocks in the two counties outside Portland, summed. Source: U.S. Census Bureau, LEHD Origin-Destination Employment Statistics (LODES), version 8, Workplace Area Characteristics; U.S. Census Bureau, LODES version 8 geography crosswalk
- -0.69 percentage points (43.74% to 43.05%) Change in Multnomah County's share of the seven-county metro's payroll jobs, 2015 to 2019. How it was worked out: Multnomah County employment as a percent of the seven-county total, 2019 less 2015. Source: U.S. Bureau of Labor Statistics, Quarterly Census of Employment and Wages, annual averages by industry
- +0.13 percentage points The same change for Denver County in its metro, 2015 to 2019. How it was worked out: Denver County employment as a percent of the ten-county Denver metro total. Source: U.S. Bureau of Labor Statistics, Quarterly Census of Employment and Wages, annual averages by industry
- Change in Multnomah County's share of the metro's business applications, 2015 to 2019. -4.56 percentage points (42.0% to 37.4%), the largest fall of ten comparison metros How it was worked out: Applications in the central county as a percent of applications in its metro, 2019 less 2015. Source: U.S. Census Bureau, Business Formation Statistics, annual business applications by county
- -0.3, -1.2, +0.4 and -0.2 points Yearly change in City of Portland jobs against Washington and Clackamas counties, 2016, 2017, 2018 and 2019. How it was worked out: Growth on the Portland side less growth on the other side, measured as the change in the natural logarithm of the count, times 100. For small changes this is close to a difference in percentage points. Source: U.S. Census Bureau, LEHD Origin-Destination Employment Statistics (LODES), version 8, Workplace Area Characteristics; U.S. Census Bureau, LODES version 8 geography crosswalk
Strongest evidence against. The slip before 2020 was small and not unusual: three comparison counties lost about as much share from 2015 to 2019 (Hennepin and Ramsey -0.49, Franklin -0.63, Travis -1.03), and measured at the city limits Portland fell only 1.2 points against its suburbs in those years. The independent check lowered this to likely for anything particular to Portland before 2020; only the business applications figure is unusual.
Sources: U.S. Census Bureau, LEHD Origin-Destination Employment Statistics (LODES), version 8, Workplace Area Characteristics; U.S. Census Bureau, LODES version 8 geography crosswalk; U.S. Bureau of Labor Statistics, Quarterly Census of Employment and Wages, annual averages by industry; U.S. Census Bureau, Business Formation Statistics, annual business applications by county
The loss belongs to the city more than the county: the part of Multnomah County outside Portland gained jobs, but the test is weak because all of its net gain is in health care, education and warehousing.
4 figures, with sources and method
- +4,103 Change in jobs in Multnomah County outside Portland, 2019 to 2024. How it was worked out: Jobs in Multnomah County census blocks outside the Portland city boundary, summed. Source: U.S. Census Bureau, LEHD Origin-Destination Employment Statistics (LODES), version 8, Workplace Area Characteristics; U.S. Census Bureau, LODES version 8 geography crosswalk
- +3,028 Of that, health care and education. How it was worked out: Jobs in educational services and in health care and social assistance in the same blocks. Source: U.S. Census Bureau, LEHD Origin-Destination Employment Statistics (LODES), version 8, Workplace Area Characteristics; U.S. Census Bureau, LODES version 8 geography crosswalk
- +1,469 Of that, transportation and warehousing. How it was worked out: Jobs in transportation and warehousing in the same blocks. Source: U.S. Census Bureau, LEHD Origin-Destination Employment Statistics (LODES), version 8, Workplace Area Characteristics; U.S. Census Bureau, LODES version 8 geography crosswalk
- -2.3% against +3.6% Change in its other sectors, against the same sectors in Washington and Clackamas counties. How it was worked out: All jobs less goods-producing sectors, wholesale trade, transportation and warehousing, health care and education. Source: U.S. Census Bureau, LEHD Origin-Destination Employment Statistics (LODES), version 8, Workplace Area Characteristics; U.S. Census Bureau, LODES version 8 geography crosswalk
Strongest evidence against. East county is small and has only about 4,900 office-type jobs, so it cannot test the office loss that drives the city's figures. Leaving out its warehouses, hospitals and schools, it fell while the suburbs grew, which points the other way.
Sources: U.S. Census Bureau, LEHD Origin-Destination Employment Statistics (LODES), version 8, Workplace Area Characteristics; U.S. Census Bureau, LODES version 8 geography crosswalk
Remote work is part of the cause downtown but does not explain the loss alone: most of the fall in downtown visits also happened in comparison downtowns, and people working on site in Portland fell 20.0%, close to Seattle's 17.9%.
4 figures, with sources and method
- 65% to 85% Share of the fall in downtown Portland visits by spring 2023 that also happened in comparison downtowns. How it was worked out: The typical fall in visits from 2019 divided by Portland's fall of 39.2 points: 85% using the median of the nine comparison downtowns (33.2 points) and 65% using the median of 54 U.S. downtowns. Source: University of Toronto, School of Cities, Downtown Recovery rankings
- -20.0% Change in the number of people working on site in the City of Portland, 2019 to 2025. How it was worked out: Workers whose workplace is in the city, less those of them who worked from home. Source: U.S. Census Bureau, American Community Survey 1-year estimates, table B08406, Sex of Workers by Means of Transportation to Work for Workplace Geography
- -17.9% The same change in the City of Seattle. How it was worked out: Same calculation. Source: U.S. Census Bureau, American Community Survey 1-year estimates, table B08406, Sex of Workers by Means of Transportation to Work for Workplace Geography
- About 5 points Largest effect of working from home on a central county's jobs, relative to its suburbs, that the cross-county test cannot rule out. How it was worked out: Across 48 central counties the estimated effect of a one-point higher work-from-home share is +0.02 points, with a 95% range of -0.36 to +0.39. Multnomah County's share rose 14 points from 2019 to 2024 (8.6% to 22.6%), and 14 times 0.36 is about 5. Source: U.S. Census Bureau, American Community Survey 1-year estimates, table B08301, Means of Transportation to Work; U.S. Bureau of Labor Statistics, Quarterly Census of Employment and Wages, annual averages by industry
Strongest evidence against. Across large central counties, neither the share of office jobs nor the share of residents working from home predicts which counties lost jobs. Remote work is the likeliest shared cause of the fall in visits, but that share was not measured directly. Working from home is counted where people live, which may be far from the office.
Sources: University of Toronto, School of Cities, Downtown Recovery rankings; U.S. Census Bureau, American Community Survey 1-year estimates, table B08406, Sex of Workers by Means of Transportation to Work for Workplace Geography; U.S. Census Bureau, American Community Survey 1-year estimates, table B08301, Means of Transportation to Work; U.S. Bureau of Labor Statistics, Quarterly Census of Employment and Wages, annual averages by industry
Restaurant and hotel jobs fell 12.2% in Multnomah County from 2019 to 2025, the worst record of 49 large central counties. Safety and street conditions are one explanation. Fewer office workers and visitors are others, and the records do not separate them.
3 figures, with sources and method
- -12.2% Change in private leisure and hospitality jobs in Multnomah County, 2019 to 2025. Source: U.S. Bureau of Labor Statistics, Quarterly Census of Employment and Wages, annual averages by industry
- Last of 49 with a published figure Rank among the central counties of the 50 largest metros. How it was worked out: Central counties ranked by percent change in private leisure and hospitality employment; one county has no published figure and is left out. Source: U.S. Bureau of Labor Statistics, Quarterly Census of Employment and Wages, annual averages by industry; U.S. Census Bureau, Metropolitan and Micropolitan Statistical Area Population Totals, Vintage 2025
- -12.3 points Change in consumer-facing jobs in the City of Portland against Washington and Clackamas counties, 2019 to 2024. How it was worked out: Jobs in retail, arts and recreation, accommodation and food, and other services. Growth on the Portland side less growth on the other side, measured as the change in the natural logarithm of the count, times 100. For small changes this is close to a difference in percentage points. Source: U.S. Census Bureau, LEHD Origin-Destination Employment Statistics (LODES), version 8, Workplace Area Characteristics; U.S. Census Bureau, LODES version 8 geography crosswalk
Strongest evidence against. Street conditions are not measured in any of these figures, so the link is an inference. Lost foot traffic from office workers fits the same numbers, and the break came in 2020, the pandemic year. Seattle's and Minneapolis-St. Paul's counties lost less (5.0% and 5.7%).
Sources: U.S. Bureau of Labor Statistics, Quarterly Census of Employment and Wages, annual averages by industry; U.S. Census Bureau, Metropolitan and Micropolitan Statistical Area Population Totals, Vintage 2025; U.S. Census Bureau, LEHD Origin-Destination Employment Statistics (LODES), version 8, Workplace Area Characteristics; U.S. Census Bureau, LODES version 8 geography crosswalk
Part of the loss is the earlier drift carrying on: it accounts for 27% of the job loss in Multnomah County that growth in the rest of the region does not explain.
1 figure, with sources and method
- About 27% (26% before rounding) Share of Multnomah County's unexplained job loss, 2019 to 2025, accounted for by its 2015 to 2019 drift. How it was worked out: Across 42 large metros, a central county's job change is predicted from the growth of the rest of its metro and its share of office-type jobs. Multnomah falls 5.9 points short of the prediction. Adding each center's 2015 to 2019 gap to its suburbs as a predictor cuts that to 4.3 points; 1.6 of 5.9 is 27%. Source: U.S. Bureau of Labor Statistics, Quarterly Census of Employment and Wages, annual averages by industry; U.S. Census Bureau, Metropolitan and Micropolitan Statistical Area Population Totals, Vintage 2025
Strongest evidence against. The estimate comes from a comparison of 42 metros at one point in time and does not say what the lasting factor is. Multnomah County is still fourth worst of the 42 after the adjustment.
Sources: U.S. Bureau of Labor Statistics, Quarterly Census of Employment and Wages, annual averages by industry; U.S. Census Bureau, Metropolitan and Micropolitan Statistical Area Population Totals, Vintage 2025
Multnomah County lost $3.1 billion of income to moves over three years, and between 3% and 48% of that left beyond what left the two neighboring Oregon counties, which is the most the county tax could explain.
3 figures, with sources and method
- $3.10 billion Net income Multnomah County lost to moves, 2020-21 to 2022-23. How it was worked out: Income of returns moving in less income of returns moving out, three filing-year pairs added: $1.08, $1.22 and $0.80 billion. Source: Internal Revenue Service, Statistics of Income, U.S. Population Migration Data, county-to-county flows
- $0.10 billion to $1.50 billion (3% to 48%) Income that left Multnomah beyond what left Washington and Clackamas counties. How it was worked out: Multnomah's rise in the share of residents' income leaving, over its 2015-16 to 2018-19 average, less the same rise in the two counties, times Multnomah's income. The high figure counts 2020-21, the year of the vote; the low figure counts only the excess beyond that year's. Source: Internal Revenue Service, Statistics of Income, U.S. Population Migration Data, county-to-county flows
- 28,920; none to 15% Net loss of residents to moves over the same years, and the share the same comparison covers. How it was worked out: Persons on returns moving in less persons on returns moving out. Taken from the saved output of the analysis and not recomputed for this page. Source: Internal Revenue Service, Statistics of Income, U.S. Population Migration Data, county-to-county flows
Strongest evidence against. The range measures how Multnomah County differed from its neighbors, and the tax is one possible reason: crime, school closures and remote work changed in the same months. The one study of the tax is a working paper (see L4).
Sources: Internal Revenue Service, Statistics of Income, U.S. Population Migration Data, county-to-county flows; Karen Conway, John Iselin and Jon Rork, Mult-No-More? The Migration Effects of Multnomah County's Preschool For All Income Tax; Multnomah County Elections, Multnomah County Voters' Pamphlet, General Election, November 3, 2020
The loss of officers could explain between none and 42% of Portland's extra homicides, and the range cannot be narrowed.
6 figures, with sources and method
- 0.058 to 0.102 Homicides prevented a year by each additional officer, in published research. Source: Aaron Chalfin, Benjamin Hansen, Emily Weisburst and Morgan Williams, Police Force Size and Civilian Race
- Officers Portland lost. 98 (FBI count, 2019 to 2021-22) to 168 (City count, July 2020 to July 2022) Source: Federal Bureau of Investigation, Crime Data Explorer, police employee counts by agency; Portland Police Bureau, Police Staffing Numbers, open data
- 6 to 17 Homicides a year that corresponds to. How it was worked out: 98 times 0.058 and 168 times 0.102. Source: Aaron Chalfin, Benjamin Hansen, Emily Weisburst and Morgan Williams, Police Force Size and Civilian Race; Federal Bureau of Investigation, Crime Data Explorer, police employee counts by agency
- About 41 Homicides a year in Portland beyond what the trend in comparison cities would predict, 2021 to 2025. How it was worked out: Taken from the saved output of the analysis and not recomputed for this page. Source: Federal Bureau of Investigation, Crime Data Explorer, summarized offense counts by police agency
- Share of the extra homicides. 14% to 42%; none if only Portland's loss beyond other cities' is counted How it was worked out: 6 and 17 divided by 41. Source: Aaron Chalfin, Benjamin Hansen, Emily Weisburst and Morgan Williams, Police Force Size and Civilian Race; Federal Bureau of Investigation, Crime Data Explorer, police employee counts by agency; Federal Bureau of Investigation, Crime Data Explorer, summarized offense counts by police agency
- 18% to 29% and 55% to 95% Share of extra violent offenses on two published estimates. How it was worked out: 133 to 217, and 418 to 717, of about 758 extra offenses a year. Taken from the saved output of the analysis and not recomputed for this page. Source: Aaron Chalfin and Justin McCrary, The Effect of Police on Crime: New Evidence from U.S. Cities, 1960-2010; Steven Mello, More COPS, Less Crime; Federal Bureau of Investigation, Crime Data Explorer, summarized offense counts by police agency
Strongest evidence against. The research measures cities adding officers in ordinary years. A sudden loss during unrest may work differently. Officers left partly because of the protests, so the staffing loss is tangled up with the events it is meant to explain.
Sources: Aaron Chalfin, Benjamin Hansen, Emily Weisburst and Morgan Williams, Police Force Size and Civilian Race; Aaron Chalfin and Justin McCrary, The Effect of Police on Crime: New Evidence from U.S. Cities, 1960-2010; Steven Mello, More COPS, Less Crime; Federal Bureau of Investigation, Crime Data Explorer, police employee counts by agency; Federal Bureau of Investigation, Crime Data Explorer, summarized offense counts by police agency
The mandate may explain part of the fall in apartment approvals: Portland's pace fell to 26% of its earlier level, and the three weakest comparison cities are the three with similar mandates.
4 figures, with sources and method
- 26% and 122% Apartments approved a year in 2023 to 2025 as a share of the 2015 to 2019 pace: City of Portland and the typical comparison city. How it was worked out: Units in buildings of five or more; the yearly average of the later years divided by that of the earlier years. Source: U.S. Census Bureau, Building Permits Survey, annual files
- 24%, 44% and 63% The same for Minneapolis, Seattle and Denver. Source: U.S. Census Bureau, Building Permits Survey, annual files
- 5% to 40% Share of Portland's 2020 to 2025 gap in apartment approvals that local rules account for. How it was worked out: The low end holds if the City's count for 2021 and 2022 is right, the high end if the Census count is. Taken from the saved output of the analysis and not recomputed for this page. Source: U.S. Census Bureau, Building Permits Survey, annual files; City of Portland, Portland Permitting and Development, Report on Temporary SDC Exemptions for Housing, August 15, 2025 through January 15, 2026
- 9% to 30% Share that interest rates and costs account for. How it was worked out: Taken from the saved output of the analysis and not recomputed for this page. Source: U.S. Census Bureau, Building Permits Survey, annual files
Strongest evidence against. Minneapolis is below Portland on this measure. No evaluation of Portland's rule with a comparison group exists.
Sources: U.S. Census Bureau, Building Permits Survey, annual files; City of Portland, Portland Permitting and Development, Report on Temporary SDC Exemptions for Housing, August 15, 2025 through January 15, 2026
Oregon is not a cheap place to pass a measure by the one yardstick available.
1 figure, with sources and method
- $5.50 and $2.70 Contributions on both sides for each vote cast, typical measure: Oregon and five other states. How it was worked out: The middle value for ten Oregon statewide measures from 2014 to 2024, and for 18 measures in Washington, California, Colorado, Massachusetts and Alaska, each from its Ballotpedia page. Only one of those pages is linked here. Source: Ballotpedia, Oregon Measure 97, Business Tax Increase Initiative (2016)
Strongest evidence against. The measures compared were chosen by us and are few.
Sources: Ballotpedia, Oregon Measure 97, Business Tax Increase Initiative (2016)
Six of ten Portland civic organizations and campaigns checked had a documented internal conflict between 2015 and 2020, but nothing in the record shows that newcomers were behind it.
3 figures, with sources and method
- 6 of 10, and a seventh in part Organizations and campaigns with a documented conflict. How it was worked out: One news report read for each; the three with no reported conflict are not linked. Source: Willamette Week, Portland's Obscure Human Rights Commission Sparks Anger With Israel-Palestine Vote; KOIN 6 News, Report on the Women's March on Portland and its organizers; Willamette Week, Former Leaders Say the City Club of Portland Is Pushing Diversity at the Expense of Debate; OPB, Report on the Montavilla Neighborhood Association election; Portland Mercury, In Search of Equal Representation, Portland Looks Beyond Neighborhood Associations; OPB, Jo Ann Hardesty Resurrected Local NAACP, With Scant Attention To Fiscal Oversight; BikePortland, BTA members support changing organization name to The Street Trust
- 5.4%, 5.2%, 4.7%, 5.3%, 5.3% and 5.3% Portland adults who had lived in another state a year earlier, 2010, 2011, 2014, 2015, 2016 and 2017. Source: U.S. Census Bureau, American Community Survey 1-year estimates, tables B07001 (residence one year ago) and B05002 (place of birth)
- 43.5% and 47.1%; highest every year from 2010 to 2019 Portland residents born in another U.S. state, 2010 and 2016, and rank among the ten cities. Source: U.S. Census Bureau, American Community Survey 1-year estimates, tables B07001 (residence one year ago) and B05002 (place of birth)
Strongest evidence against. The ten were chosen by us, each rests on one report, and no source tracks where the leaders of these groups came from. The survey figures have sampling error of several tenths of a point.
Sources: Willamette Week, Portland's Obscure Human Rights Commission Sparks Anger With Israel-Palestine Vote; KOIN 6 News, Report on the Women's March on Portland and its organizers; Willamette Week, Former Leaders Say the City Club of Portland Is Pushing Diversity at the Expense of Debate; OPB, Report on the Montavilla Neighborhood Association election; Portland Mercury, In Search of Equal Representation, Portland Looks Beyond Neighborhood Associations; OPB, Jo Ann Hardesty Resurrected Local NAACP, With Scant Attention To Fiscal Oversight; BikePortland, BTA members support changing organization name to The Street Trust; U.S. Census Bureau, American Community Survey 1-year estimates, tables B07001 (residence one year ago) and B05002 (place of birth)
Downtown Portland's jobs were unusually concentrated in office work, which accounts for about 3.5 of the 6 points of its gap in visits with comparable downtowns; weekends and the fall in downtown jobs are not explained by it.
5 figures, with sources and method
- 43.3%, eleventh highest of 55 downtowns Office work as a share of downtown Portland's jobs in 2019. How it was worked out: Jobs in information, finance, real estate, professional services and management within 1.25 miles of the densest cluster of jobs. Source: U.S. Census Bureau, LEHD Origin-Destination Employment Statistics (LODES), version 8, Workplace Area Characteristics; U.S. Census Bureau, LODES version 8 geography crosswalk
- 26% Share of the differences among 54 downtowns that office share alone explains. How it was worked out: The fit of 2023 visits on office share across 54 downtowns. Source: University of Toronto, School of Cities, Downtown Recovery rankings; U.S. Census Bureau, LEHD Origin-Destination Employment Statistics (LODES), version 8, Workplace Area Characteristics
- About 3.5 Points of Portland's 6-point gap that a fuller model accounts for. How it was worked out: A model with office share, residents per job and the share of jobs that can be done remotely. Taken from the saved output of the analysis and not recomputed for this page. Source: University of Toronto, School of Cities, Downtown Recovery rankings; U.S. Census Bureau, LEHD Origin-Destination Employment Statistics (LODES), version 8, Workplace Area Characteristics
- 71% and 79% Weekend visits in spring 2023 as a share of 2019: Portland and the typical comparable downtown. Source: University of Toronto, School of Cities, Downtown Recovery, time of week rankings
- -13.1%; comparison downtowns ranged from -3.6% to +20.8% Change in jobs within 1.25 miles of the center, 2019 to 2024. Source: U.S. Census Bureau, LEHD Origin-Destination Employment Statistics (LODES), version 8, Workplace Area Characteristics; U.S. Census Bureau, LODES version 8 geography crosswalk
Strongest evidence against. The result shifts with where the edge of downtown is drawn, and by 2025 office share no longer predicted which downtowns had recovered.
Sources: University of Toronto, School of Cities, Downtown Recovery rankings; University of Toronto, School of Cities, Downtown Recovery, time of week rankings; University of Toronto, School of Cities, Downtown Recovery, September to December trend; U.S. Census Bureau, LEHD Origin-Destination Employment Statistics (LODES), version 8, Workplace Area Characteristics; U.S. Census Bureau, LODES version 8 geography crosswalk
Intel and Nike are a small part of the region's jobs gap against all nine regions and 24% to 37% of its gap against the three most similar.
5 figures, with sources and method
- 4,000 to 6,200 Jobs the two companies cut in Oregon, 2019 to 2026. How it was worked out: From company filings, layoff notices and published employer lists. Taken from the saved output of the analysis and not recomputed for this page. Source: OPB, Intel will cut another 669 workers in Oregon by the end of 2025; Oregon Higher Education Coordinating Commission, Worker Adjustment and Retraining Notification (WARN) notices
- 5% to 8%, and 24% to 37% Share of the 74,000-job gap, and of the 17,000-job gap. How it was worked out: 4,000 and 6,200 divided by each gap. Source: U.S. Bureau of Labor Statistics, Quarterly Census of Employment and Wages, annual averages by industry
- About 2,100; 20 of 23 Jobs of the 74,000 that the region's mix of industries explains, and industry groups in which the region trails. How it was worked out: Taken from the saved output of the analysis and not recomputed for this page. Source: U.S. Bureau of Labor Statistics, Quarterly Census of Employment and Wages, annual averages by area
- 26,500 Jobs by which the region trailed the national pace in 2023, before either company filed a layoff notice. How it was worked out: The region's 2019 jobs times national growth to 2023, less its 2023 jobs. Nike's first notice is dated April 19, 2024 and Intel's October 15, 2024. Source: U.S. Bureau of Labor Statistics, Quarterly Census of Employment and Wages, annual averages by area; Oregon Higher Education Coordinating Commission, Worker Adjustment and Retraining Notification (WARN) notices
- 55% to 80% Share of the 74,000 that is weakness across nearly every industry. How it was worked out: Taken from the saved output of the analysis and not recomputed for this page. Source: U.S. Bureau of Labor Statistics, Quarterly Census of Employment and Wages, annual averages by area
Strongest evidence against. Layoffs at large employers in the other three regions were not counted the same way, and the industry breakdown was not rerun against them.
Sources: U.S. Bureau of Labor Statistics, Quarterly Census of Employment and Wages, annual averages by industry; U.S. Bureau of Labor Statistics, Quarterly Census of Employment and Wages, annual averages by area; OPB, Intel will cut another 669 workers in Oregon by the end of 2025; Oregon Higher Education Coordinating Commission, Worker Adjustment and Retraining Notification (WARN) notices
Visits to downtown Portland have been recovering, but no measure that compares downtowns against 2019 has been published since spring 2023. A second University of Toronto series, from a different phone data provider, shows more phone activity in downtown Portland in fall 2025 than in fall 2023, and a larger rise than in the typical comparable downtown. The size of Portland’s rise depends on how missing days are handled, from 18% to 58%. Downtown Portland Clean & Safe reports about 32 million visits to its 273-block district in 2025, 5.5% more than in 2024, with Saturday visits at 88.6% of their 2019 number.
1 figure, with sources and method
- The latest published figures. University of Toronto School of Cities, daily count of phones in each downtown, September to December. Downtown Portland, fall 2025 against fall 2023: +57.8% counting only days present in both years (the 5th largest rise of 60 U.S. downtowns), +47.5% on September and October only, and +17.8% counting all days. Typical of the nine comparison downtowns on matched days: +7.1% (from +3.7% in Seattle to +100.1% in Phoenix). Portland, fall 2025 against fall 2024: +26.8%, against +7.2%. None of these is measured against 2019. Downtown Portland Clean & Safe (Placer.ai counts, 273-block district): about 32 million visits in 2025, up 5.5% from about 30 million in 2024. Saturday visits were 5,783,911 in 2025 against 6,528,120 in 2019, which is 88.6%. Source: University of Toronto School of Cities, Downtown Recovery: U.S. trends, September to December 2023, 2024 and 2025
Strongest evidence against. Portland's rows are irregular: November 2023 is missing, every December is about three times the other months, and the series stops December 18, 2025. The project says the trend series uses "different cell phone data providers from our previous rankings analysis", and that Portland's data is cut off "due to Oregon's Consumer Privacy Act", so no later Portland figures should be expected from this source. Seattle, Denver and Columbus show a 2024 level far above both 2023 and 2025, which suggests the phone panel changed between years.
By the downtown district's count, monthly visits by visitors and office workers together reached 3 million in summer 2026 for the first time since 2019, when the summer peak was 3.8 million. Office workers have stayed near 350,000 a month since 2022, 43% of the 819,000 of October 2019 (Downtown Portland Clean & Safe figures, reported by Willamette Week).
1 figure, with sources and method
- The latest published figures. Willamette Week, September 23, 2026, reporting Clean & Safe figures: monthly visitors and office workers together reached 3 million in summer 2026 for the first time since 2019, against about 2.8 million the summer before and a high of 3.8 million in July 2019; office workers in the district have been about 350,000 a month since May 2022, against 819,000 in October 2019. Source: Willamette Week, Downtown Foot Traffic Is Up but Office Workers Remain Home, Study Shows (September 23, 2026)
Strongest evidence against. This is a news report of the district’s own phone counts. We did not see the district’s report.
Office vacancy downtown is now 28% to 39%, depending on which broker's building list and definition is used, up from about 12% at the end of 2019. Kidder Mathews counts 27.8% of downtown office space vacant and offered by the landlord in the third quarter of 2026 (29.6% with sublease space), Cushman & Wakefield 35.2% in the downtown core, and CBRE 38.8%.
1 figure, with sources and method
- The latest published figures. Downtown Portland office vacancy, third quarter 2026, by three brokers, each with its own building list and definition. Kidder Mathews, central business district: 27.8% direct, 29.6% including sublease space; it was 12.0% and 12.4% at the end of 2019 and has risen every year. Cushman & Wakefield: 35.2% overall (direct plus sublease) in its Central Core of 20.1 million square feet; 32.6% in its wider "CBD" of 31.6 million square feet, which adds the Lloyd District, close-in Northwest and the close-in east side. CBRE, as printed on slide 22 of the Portland Metro Chamber's November 12, 2026 Council presentation: 38.8% in the central business district, against 12.0% in the fourth quarter of 2019. Source: Kidder Mathews; Cushman & Wakefield; CBRE (via Portland Metro Chamber), Portland Office Market Report, 3Q 2026; Portland Office MarketBeat Q3 2026; The Future of Downtown (Council presentation, November 12, 2026)
Strongest evidence against. These are brokers’ private counts, and the three differ by 11 points because each chooses its own buildings and CBRE counts space that is vacant but still leased. We did not read CBRE’s report. Its figure comes from a slide in the Portland Metro Chamber’s November 12, 2026 presentation to the City Council.
On one broker's measure, downtown Portland is not the emptiest of the comparison downtowns. Cushman & Wakefield counted 32.6% of office space vacant in central Portland in the third quarter of 2026, against 37.5% in downtown Seattle, 37.1% in downtown Denver, 33.3% in downtown Austin, 32.8% in downtown Minneapolis and 22.7% in downtown Salt Lake City.
1 figure, with sources and method
- The latest published figures. Cushman & Wakefield, overall vacancy (direct plus sublease) in each market's central business district, third quarter 2026: Seattle CBD 37.5%; Denver 37.1%; Austin 33.3%; Minneapolis CBD 32.8%; Portland 32.6% (35.2% for its Central Core); Salt Lake City 22.7%. Not found for the central business districts of Columbus, San Diego, Phoenix and Raleigh. Whole metro markets, same broker and quarter, from its national report: Seattle 32.6%, Denver 27.1%, Austin 27.1%, Minneapolis-St. Paul 27.0%, Phoenix 25.1%, Portland 23.9%, Columbus 22.5%, Salt Lake City 21.9%, Raleigh-Durham 21.5%, San Diego 14.7%; United States 19.8%. Source: Cushman & Wakefield, Office MarketBeat Q3 2026: Portland, Seattle (downtown), Denver, Minneapolis, Austin, Salt Lake City, and United States
Strongest evidence against. One broker, its own submarket boundaries, and each city's "CBD" is drawn differently (Portland's includes the Lloyd District and close-in east side). Four of the nine downtowns are missing, so this cannot be called a ranking of ten.
Of the 6,912 people Multnomah County reported as unsheltered on January 22, 2025, 5,090 were added from its list of people known to service providers, so the 2025 count cannot be compared with earlier counts or with other cities.
1 figure, with sources and method
- The latest published figures. Point-in-time count, Portland, Gresham and Multnomah County, January 22, 2025: 10,526 people, 3,614 sheltered and 6,912 unsheltered. Of the 6,912, the county added 5,090 from its list of people known to service providers and presumed unsheltered, which leaves 1,822 from the street count. As reported to HUD that is 86.9 unsheltered people for every 10,000 residents, against 49.7 in the 2023 count. HUD's 2025 file for the comparison areas: Seattle and King County 41.8 (carried forward, no street count in 2025), San Diego 17.4, Austin and Travis County 11.3, Phoenix and Maricopa County 11.1, metro Denver 6.4, Salt Lake County 4.2, Columbus and Franklin County 3.3, Minneapolis and Hennepin County 3.3, Raleigh and Wake County 2.3. Source: U.S. Department of Housing and Urban Development; Multnomah County Homeless Services Department, 2007 to 2025 Point-in-Time Counts by CoC; 2025 Tri-County Point-in-Time Count Report (November 4, 2025)
Strongest evidence against. No count newer than January 2025 has been published. Taking out the 5,090 leaves 1,822 people from the street count, which is our subtraction. The county’s report does not give that figure.
The evidence points most to remote and hybrid work and the fall in visits that came with it. It accounts for at least 20% and at most 76% of the 16,439 jobs downtown lost from 2019 to 2024. Office jobs are 50% of the loss, and 62% of the lost office jobs were lost after April 2021. Other downtowns went through the same shift and lost far less. What Portland shares with them is 10% to 45% of its loss, so remote work by itself does not explain why Portland’s downtown did worse.
3 figures, with sources and method
- 20% to 76% Share of the loss this can account for. How it was worked out: Each end of a range comes from a separate calculation on Census block job counts, federal payroll counts by county or Census counts of businesses by ZIP code. The ranges overlap and cannot be added together. Source: U.S. Census Bureau, LEHD Origin-Destination Employment Statistics (LODES), version 8, Workplace Area Characteristics; U.S. Census Bureau, LODES version 8 geography crosswalk; U.S. Bureau of Labor Statistics, Quarterly Census of Employment and Wages, annual averages by industry; U.S. Census Bureau, County Business Patterns, ZIP Code Business Patterns
- What decides it. Office jobs are 8,264 of the 16,439 jobs lost (50%). 3% of that office loss had happened by April 1, 2020, 38% by April 1, 2021, and 62% came after, spread across 2021 to 2024. Source: U.S. Census Bureau, LEHD Origin-Destination Employment Statistics (LODES), version 8, Workplace Area Characteristics; U.S. Census Bureau, LODES version 8 geography crosswalk; U.S. Bureau of Labor Statistics, Quarterly Census of Employment and Wages, annual averages by industry; U.S. Census Bureau, County Business Patterns, ZIP Code Business Patterns
- What decides it. Comparison downtowns share between 10% and 45% of Portland’s loss (28% to 60% of the loss in restaurants, hotels and shops, and 0% to 45% of the office loss), measured with block counts for Minneapolis and San Diego, counts of downtown businesses for Seattle, Denver and Minneapolis, and county payroll counts for Hennepin and Ramsey. Source: U.S. Census Bureau, LEHD Origin-Destination Employment Statistics (LODES), version 8, Workplace Area Characteristics; U.S. Census Bureau, LODES version 8 geography crosswalk; U.S. Bureau of Labor Statistics, Quarterly Census of Employment and Wages, annual averages by industry; U.S. Census Bureau, County Business Patterns, ZIP Code Business Patterns
Strongest evidence against. Downtowns that lived through the same shift lost far fewer office jobs: about 3% in Minneapolis, which has a larger office share, and about 7% in San Diego, against 16.6% in Portland. Employers that said publicly they had gone remote account for 1,538 of the lost jobs (9.4%). What Portland shares with Seattle, Denver and Minneapolis also includes their own unrest and street disorder, so the shared part is not a clean measure of remote work.
Sources: U.S. Census Bureau, LEHD Origin-Destination Employment Statistics (LODES), version 8, Workplace Area Characteristics; U.S. Census Bureau, LODES version 8 geography crosswalk; U.S. Bureau of Labor Statistics, Quarterly Census of Employment and Wages, annual averages by industry; U.S. Census Bureau, County Business Patterns, ZIP Code Business Patterns
Safety, police response and street conditions come second, and the evidence cannot size them. No measurement puts their share above 0%, and none rules out as much as 67%. What is measured is that downtown Portland lost 2,400 to 4,400 more restaurant, hotel and shop jobs than it would have at the rates of comparison downtowns, which is 15% to 27% of the downtown loss. Street conditions are one explanation of that shortfall. A larger office loss and fewer visitors are others, and the records do not separate them.
3 figures, with sources and method
- 0% to 67% Share of the loss this can account for. How it was worked out: Each end of a range comes from a separate calculation on Census block job counts, federal payroll counts by county or Census counts of businesses by ZIP code. The ranges overlap and cannot be added together. Source: U.S. Census Bureau, LEHD Origin-Destination Employment Statistics (LODES), version 8, Workplace Area Characteristics; U.S. Census Bureau, LODES version 8 geography crosswalk; U.S. Bureau of Labor Statistics, Quarterly Census of Employment and Wages, annual averages by industry; U.S. Census Bureau, County Business Patterns, ZIP Code Business Patterns
- What decides it. Downtown Portland lost 27.0% of its restaurant, hotel, shop and personal-service jobs. The downtowns of Seattle, Denver and Minneapolis lost 9% to 16%. At their rates Portland would have kept 2,415 to 4,363 more of those jobs, which is 15% to 27% of the downtown loss. Three sources agree that Portland’s fall is the largest. Source: U.S. Census Bureau, LEHD Origin-Destination Employment Statistics (LODES), version 8, Workplace Area Characteristics; U.S. Census Bureau, LODES version 8 geography crosswalk; U.S. Bureau of Labor Statistics, Quarterly Census of Employment and Wages, annual averages by industry; U.S. Census Bureau, County Business Patterns, ZIP Code Business Patterns
- What decides it. Those jobs fell by 7,442 by April 1, 2020, before the protests began in late May 2020. They fell by another 3,136 by April 2021 and have come back by 4,547 since. Source: U.S. Census Bureau, LEHD Origin-Destination Employment Statistics (LODES), version 8, Workplace Area Characteristics; U.S. Census Bureau, LODES version 8 geography crosswalk; U.S. Bureau of Labor Statistics, Quarterly Census of Employment and Wages, annual averages by industry; U.S. Census Bureau, County Business Patterns, ZIP Code Business Patterns
Strongest evidence against. Nothing in the records measures street conditions against jobs. The shortfall in restaurant, hotel and shop jobs is also what a larger office loss and fewer visitors would produce, and the one test that tries to separate them gives answers from 483 to 2,190 jobs depending on which cities are included. No employer among the 19 with a stated reason named crime or street conditions alone. 62% of the office loss came after April 2021.
Sources: U.S. Census Bureau, LEHD Origin-Destination Employment Statistics (LODES), version 8, Workplace Area Characteristics; U.S. Census Bureau, LODES version 8 geography crosswalk; U.S. Bureau of Labor Statistics, Quarterly Census of Employment and Wages, annual averages by industry; U.S. Census Bureau, County Business Patterns, ZIP Code Business Patterns
The slide against the suburbs that began before 2020 describes a trend already under way, and its cause is unknown. If it had continued it would account for between 0% and 26% of the downtown loss. Downtown was still adding jobs through 2019, only more slowly than the rest of the region.
3 figures, with sources and method
- 0% to 26% Share of the loss this can account for. How it was worked out: Each end of a range comes from a separate calculation on Census block job counts, federal payroll counts by county or Census counts of businesses by ZIP code. The ranges overlap and cannot be added together. Source: U.S. Census Bureau, LEHD Origin-Destination Employment Statistics (LODES), version 8, Workplace Area Characteristics; U.S. Census Bureau, LODES version 8 geography crosswalk; U.S. Bureau of Labor Statistics, Quarterly Census of Employment and Wages, annual averages by industry; U.S. Census Bureau, County Business Patterns, ZIP Code Business Patterns
- What decides it. Downtown had 95,500 jobs in April 2015 and 103,281 in April 2019, a rise of 8.1%, while the rest of the region grew faster. Source: U.S. Census Bureau, LEHD Origin-Destination Employment Statistics (LODES), version 8, Workplace Area Characteristics; U.S. Census Bureau, LODES version 8 geography crosswalk; U.S. Bureau of Labor Statistics, Quarterly Census of Employment and Wages, annual averages by industry; U.S. Census Bureau, County Business Patterns, ZIP Code Business Patterns
- What decides it. Four ways of projecting that earlier gap forward give 0%, 3%, 15% and 26% of the downtown loss. The estimates depend on the years chosen and on whether a 2018 change in where about 4,000 education jobs are reported is counted. Source: U.S. Census Bureau, LEHD Origin-Destination Employment Statistics (LODES), version 8, Workplace Area Characteristics; U.S. Census Bureau, LODES version 8 geography crosswalk; U.S. Bureau of Labor Statistics, Quarterly Census of Employment and Wages, annual averages by industry; U.S. Census Bureau, County Business Patterns, ZIP Code Business Patterns
Strongest evidence against. Downtown was gaining jobs through 2019, so in absolute terms there was no fall to carry forward. The trend’s margin of error is twice the trend itself.
Sources: U.S. Census Bureau, LEHD Origin-Destination Employment Statistics (LODES), version 8, Workplace Area Characteristics; U.S. Census Bureau, LODES version 8 geography crosswalk; U.S. Bureau of Labor Statistics, Quarterly Census of Employment and Wages, annual averages by industry; U.S. Census Bureau, County Business Patterns, ZIP Code Business Patterns
Of the office jobs downtown lost, 3,301 were in banking and insurance, 20% of the whole downtown loss. Banks and insurers shrank in comparison cities too: at their rates downtown Portland would have lost 880 to 2,380 of these jobs anyway, which is 5% to 14% of the downtown loss. These jobs are already counted in the office loss under remote work.
3 figures, with sources and method
- 0% to 20% Share of the loss this can account for. How it was worked out: Each end of a range comes from a separate calculation on Census block job counts, federal payroll counts by county or Census counts of businesses by ZIP code. The ranges overlap and cannot be added together. Source: U.S. Census Bureau, LEHD Origin-Destination Employment Statistics (LODES), version 8, Workplace Area Characteristics; U.S. Census Bureau, LODES version 8 geography crosswalk; U.S. Bureau of Labor Statistics, Quarterly Census of Employment and Wages, annual averages by industry; U.S. Census Bureau, County Business Patterns, ZIP Code Business Patterns
- What decides it. Finance and insurance jobs downtown fell from 12,398 to 9,097, a loss of 3,301, which is 20% of the downtown loss. Source: U.S. Census Bureau, LEHD Origin-Destination Employment Statistics (LODES), version 8, Workplace Area Characteristics; U.S. Census Bureau, LODES version 8 geography crosswalk; U.S. Bureau of Labor Statistics, Quarterly Census of Employment and Wages, annual averages by industry; U.S. Census Bureau, County Business Patterns, ZIP Code Business Patterns
- What decides it. Finance and insurance jobs fell 7% to 19% in the central counties of Seattle, Minneapolis-St. Paul, San Diego and Columbus from 2019 to 2024. At those rates downtown Portland would have lost 880 to 2,380 of these jobs, 5% to 14% of the downtown loss. Multnomah County’s 24.0% fall was the largest of ten. Source: U.S. Census Bureau, LEHD Origin-Destination Employment Statistics (LODES), version 8, Workplace Area Characteristics; U.S. Census Bureau, LODES version 8 geography crosswalk; U.S. Bureau of Labor Statistics, Quarterly Census of Employment and Wages, annual averages by industry; U.S. Census Bureau, County Business Patterns, ZIP Code Business Patterns
Strongest evidence against. These jobs are already counted in the office loss under remote work, and the largest single case is an insurer that said it had gone remote. A count by industry shows where the loss is and cannot show why.
Sources: U.S. Census Bureau, LEHD Origin-Destination Employment Statistics (LODES), version 8, Workplace Area Characteristics; U.S. Census Bureau, LODES version 8 geography crosswalk; U.S. Bureau of Labor Statistics, Quarterly Census of Employment and Wages, annual averages by industry; U.S. Census Bureau, County Business Patterns, ZIP Code Business Patterns
Local taxes rank below those. They account for between 0% and 18% of the downtown loss. No test finds a tax effect: away from downtown, office work inside the city grew faster than just outside it, and no employer that gave a reason named taxes. Those tests cover small employers far from the center, and 62% of the lost office jobs left after the county and Metro income taxes took effect in January 2021, so an effect on downtown firms cannot be ruled out. The 18% ceiling assumes the entire gap between Portland and its suburbs in the number of office businesses is a tax effect.
3 figures, with sources and method
- 0% to 18% Share of the loss this can account for. How it was worked out: Each end of a range comes from a separate calculation on Census block job counts, federal payroll counts by county or Census counts of businesses by ZIP code. The ranges overlap and cannot be added together. Source: U.S. Census Bureau, LEHD Origin-Destination Employment Statistics (LODES), version 8, Workplace Area Characteristics; U.S. Census Bureau, LODES version 8 geography crosswalk; U.S. Bureau of Labor Statistics, Quarterly Census of Employment and Wages, annual averages by industry; U.S. Census Bureau, County Business Patterns, ZIP Code Business Patterns
- What decides it. The number of office businesses in Portland ZIP codes fell 1.8% from 2019 to 2023 while it rose 3.0% in Washington and Clackamas counties. If that whole 4.8 point gap were a tax effect and jobs followed businesses one for one, it would be 2,384 downtown office jobs, 15% of the downtown loss; allowing for Portland’s faster growth before 2019 it would be 2,906 jobs, 18%. Source: U.S. Census Bureau, LEHD Origin-Destination Employment Statistics (LODES), version 8, Workplace Area Characteristics; U.S. Census Bureau, LODES version 8 geography crosswalk; U.S. Bureau of Labor Statistics, Quarterly Census of Employment and Wages, annual averages by industry; U.S. Census Bureau, County Business Patterns, ZIP Code Business Patterns
- What decides it. More than 2 miles from the center and within 1 mile of the city line, office jobs rose 24.4% inside Portland (13.8% without the five largest gaining blocks) and 2.7% to 6.0% just outside in Washington and Clackamas counties. That band holds 5,090 office jobs, 4.8% of the city’s. None of the 19 employers that gave a reason for leaving or shrinking named taxes. Source: U.S. Census Bureau, LEHD Origin-Destination Employment Statistics (LODES), version 8, Workplace Area Characteristics; U.S. Census Bureau, LODES version 8 geography crosswalk; U.S. Bureau of Labor Statistics, Quarterly Census of Employment and Wages, annual averages by industry; U.S. Census Bureau, County Business Patterns, ZIP Code Business Patterns
Strongest evidence against. For a larger effect: 5,121 downtown office jobs (31% of the downtown loss) left after April 2021, when the county and Metro income taxes were in force; the gap between Portland and its suburbs in the number of office businesses opened entirely between the 2021 and 2023 counts; professional-services businesses in the central ZIP codes fell 10.3%; and the two tests that find nothing cover small employers far from downtown. For a smaller effect: Hennepin and Ramsey counties, which have no local income tax, lost 5.8% of their office jobs from 2021 to 2025 against 8.5% in Multnomah County.
Sources: U.S. Census Bureau, LEHD Origin-Destination Employment Statistics (LODES), version 8, Workplace Area Characteristics; U.S. Census Bureau, LODES version 8 geography crosswalk; U.S. Bureau of Labor Statistics, Quarterly Census of Employment and Wages, annual averages by industry; U.S. Census Bureau, County Business Patterns, ZIP Code Business Patterns
Fewer residents account for at most 4% of the downtown loss. That ceiling assumes shop and restaurant jobs fall 1% for each 1% of residents lost, which the records are too imprecise to confirm.
2 figures, with sources and method
- 0% to 4% Share of the loss this can account for. How it was worked out: Each end of a range comes from a separate calculation on Census block job counts, federal payroll counts by county or Census counts of businesses by ZIP code. The ranges overlap and cannot be added together. Source: U.S. Census Bureau, LEHD Origin-Destination Employment Statistics (LODES), version 8, Workplace Area Characteristics; U.S. Census Bureau, LODES version 8 geography crosswalk; U.S. Bureau of Labor Statistics, Quarterly Census of Employment and Wages, annual averages by industry; U.S. Census Bureau, County Business Patterns, ZIP Code Business Patterns
- What decides it. The city lost 3.0% of its residents. If restaurant, hotel and shop jobs fell 1% for each 1% of residents lost, that would be 671 of the 22,360 such jobs downtown had in 2019, 4% of the downtown loss. Source: U.S. Census Bureau, LEHD Origin-Destination Employment Statistics (LODES), version 8, Workplace Area Characteristics; U.S. Census Bureau, LODES version 8 geography crosswalk; U.S. Bureau of Labor Statistics, Quarterly Census of Employment and Wages, annual averages by industry; U.S. Census Bureau, County Business Patterns, ZIP Code Business Patterns
Strongest evidence against. The 1% for 1% response is an assumption. The measured response across 48 large counties is too imprecise to tell from zero.
Sources: U.S. Census Bureau, LEHD Origin-Destination Employment Statistics (LODES), version 8, Workplace Area Characteristics; U.S. Census Bureau, LODES version 8 geography crosswalk; U.S. Bureau of Labor Statistics, Quarterly Census of Employment and Wages, annual averages by industry; U.S. Census Bureau, County Business Patterns, ZIP Code Business Patterns
Between 1% and 24% of the recorded downtown loss may be staff who are still employed and are now reported at another address. This concerns how jobs are counted, and most of it would sit inside the range for remote work.
3 figures, with sources and method
- 1% to 24% Share of the recorded loss that may be re-reporting. How it was worked out: Each end of a range comes from a separate calculation on Census block job counts, federal payroll counts by county or Census counts of businesses by ZIP code. The ranges overlap and cannot be added together. Source: U.S. Census Bureau, LEHD Origin-Destination Employment Statistics (LODES), version 8, Workplace Area Characteristics; U.S. Census Bureau, LODES version 8 geography crosswalk; U.S. Bureau of Labor Statistics, Quarterly Census of Employment and Wages, annual averages by industry; U.S. Census Bureau, County Business Patterns, ZIP Code Business Patterns
- What decides it. A second federal count, built from different records, shows 76% of the loss that the block counts show in the four downtown ZIP codes from 2019 to 2023. The other 24% is not confirmed. Source: U.S. Census Bureau, LEHD Origin-Destination Employment Statistics (LODES), version 8, Workplace Area Characteristics; U.S. Census Bureau, LODES version 8 geography crosswalk; U.S. Bureau of Labor Statistics, Quarterly Census of Employment and Wages, annual averages by industry; U.S. Census Bureau, County Business Patterns, ZIP Code Business Patterns
- What decides it. One employer’s 199 jobs left a downtown block and a like number appeared at its suburban address in the same year. Source: U.S. Census Bureau, LEHD Origin-Destination Employment Statistics (LODES), version 8, Workplace Area Characteristics; U.S. Census Bureau, LODES version 8 geography crosswalk; U.S. Bureau of Labor Statistics, Quarterly Census of Employment and Wages, annual averages by industry; U.S. Census Bureau, County Business Patterns, ZIP Code Business Patterns
Strongest evidence against. The unconfirmed share is 8% measured from 2018 and negative measured from 2017. County payroll counts show a larger loss than the block counts do.
Sources: U.S. Census Bureau, LEHD Origin-Destination Employment Statistics (LODES), version 8, Workplace Area Characteristics; U.S. Census Bureau, LODES version 8 geography crosswalk; U.S. Bureau of Labor Statistics, Quarterly Census of Employment and Wages, annual averages by industry; U.S. Census Bureau, County Business Patterns, ZIP Code Business Patterns
Between 55% and 90% of the downtown loss is specific to Portland: other downtowns did not lose it. The records cannot divide that part among remote work on an office-heavy downtown, street conditions and taxes. The evidence points most to remote work, then to safety and street conditions, and least to taxes and to the loss of residents.
2 figures, with sources and method
- 55% to 90% Share of the downtown loss that is specific to Portland. How it was worked out: Each end of a range comes from a separate calculation on Census block job counts, federal payroll counts by county or Census counts of businesses by ZIP code. The ranges overlap and cannot be added together. Source: U.S. Census Bureau, LEHD Origin-Destination Employment Statistics (LODES), version 8, Workplace Area Characteristics; U.S. Census Bureau, LODES version 8 geography crosswalk; U.S. Bureau of Labor Statistics, Quarterly Census of Employment and Wages, annual averages by industry; U.S. Census Bureau, County Business Patterns, ZIP Code Business Patterns
- What decides it. Comparison downtowns share 1,668 to 7,338 of the 16,439 jobs lost (10% to 45%). The rest is specific to Portland: 4,542 to 8,264 office jobs, 2,415 to 4,363 restaurant, hotel and shop jobs, and about 2,000 jobs in education and health care. Source: U.S. Census Bureau, LEHD Origin-Destination Employment Statistics (LODES), version 8, Workplace Area Characteristics; U.S. Census Bureau, LODES version 8 geography crosswalk; U.S. Bureau of Labor Statistics, Quarterly Census of Employment and Wages, annual averages by industry; U.S. Census Bureau, County Business Patterns, ZIP Code Business Patterns
Strongest evidence against. Only two of nine comparison downtowns have block counts of office jobs stable enough to use, so the shared part rests on Minneapolis, San Diego and two other sources. Employer records for the largest losing blocks could move much of this under remote work.
Sources: U.S. Census Bureau, LEHD Origin-Destination Employment Statistics (LODES), version 8, Workplace Area Characteristics; U.S. Census Bureau, LODES version 8 geography crosswalk; U.S. Bureau of Labor Statistics, Quarterly Census of Employment and Wages, annual averages by industry; U.S. Census Bureau, County Business Patterns, ZIP Code Business Patterns
For the county too the evidence points most to remote and hybrid work, with a wide range: at least 12% and at most 64% of the 25,695 jobs Multnomah County lost from 2019 to 2025. Office jobs fell by 12,104, which is 47% of the county’s net loss, and 66% of that fall came in 2024 and 2025, when seven of nine comparison counties were losing office jobs too. Multnomah’s 11.8% fall was the largest of the ten. Hennepin and Ramsey counties, the nearest case, lost 8.2%.
3 figures, with sources and method
- 12% to 64% Share of the loss this can account for. How it was worked out: Each end of a range comes from a separate calculation on Census block job counts, federal payroll counts by county or Census counts of businesses by ZIP code. The ranges overlap and cannot be added together. Source: U.S. Census Bureau, LEHD Origin-Destination Employment Statistics (LODES), version 8, Workplace Area Characteristics; U.S. Census Bureau, LODES version 8 geography crosswalk; U.S. Bureau of Labor Statistics, Quarterly Census of Employment and Wages, annual averages by industry; U.S. Census Bureau, County Business Patterns, ZIP Code Business Patterns
- What decides it. Office jobs (information, finance, real estate, professional services and company management) fell by 12,104 in Multnomah County, 11.8%, the largest fall of ten comparison counties. That is 47% of the county’s net loss. Hennepin and Ramsey counties lost 8.2%; six of the nine gained. Source: U.S. Census Bureau, LEHD Origin-Destination Employment Statistics (LODES), version 8, Workplace Area Characteristics; U.S. Census Bureau, LODES version 8 geography crosswalk; U.S. Bureau of Labor Statistics, Quarterly Census of Employment and Wages, annual averages by industry; U.S. Census Bureau, County Business Patterns, ZIP Code Business Patterns
- What decides it. 66% of the county’s office loss came in 2024 and 2025. Seven of nine comparison counties also lost office jobs from 2023 to 2024. Source: U.S. Census Bureau, LEHD Origin-Destination Employment Statistics (LODES), version 8, Workplace Area Characteristics; U.S. Census Bureau, LODES version 8 geography crosswalk; U.S. Bureau of Labor Statistics, Quarterly Census of Employment and Wages, annual averages by industry; U.S. Census Bureau, County Business Patterns, ZIP Code Business Patterns
Strongest evidence against. The county’s loss is as bad outside offices: Multnomah also had the largest falls of ten in manufacturing (20.8%), wholesale (11.0%) and restaurant, hotel and entertainment jobs (12.2%). Factories, wholesalers and builders lost 11,670 jobs that remote work does not reach. Across 48 large central counties a larger office share does not go with a larger job loss.
Sources: U.S. Census Bureau, LEHD Origin-Destination Employment Statistics (LODES), version 8, Workplace Area Characteristics; U.S. Census Bureau, LODES version 8 geography crosswalk; U.S. Bureau of Labor Statistics, Quarterly Census of Employment and Wages, annual averages by industry; U.S. Census Bureau, County Business Patterns, ZIP Code Business Patterns
Part of the county’s loss continues a slide that began before 2020. From 2015 to 2019 Multnomah County’s jobs grew 8.3% while the rest of the region’s grew 11.4%. If that gap had continued, it would account for 15% to 31% of the 25,695 jobs lost; the full range of the estimates is 4% to 54%. This describes a trend that was already under way, with no cause identified, and 14 of 48 large central counties were falling behind their suburbs faster.
4 figures, with sources and method
- 4% to 54% Share of the loss this can account for. How it was worked out: Each end of a range comes from a separate calculation on Census block job counts, federal payroll counts by county or Census counts of businesses by ZIP code. The ranges overlap and cannot be added together. Source: U.S. Census Bureau, LEHD Origin-Destination Employment Statistics (LODES), version 8, Workplace Area Characteristics; U.S. Census Bureau, LODES version 8 geography crosswalk; U.S. Bureau of Labor Statistics, Quarterly Census of Employment and Wages, annual averages by industry; U.S. Census Bureau, County Business Patterns, ZIP Code Business Patterns
- What two methods give, as a share of the county loss. 15% (straight projection) and 25% to 31% (comparison across 48 metros) Source: U.S. Census Bureau, LEHD Origin-Destination Employment Statistics (LODES), version 8, Workplace Area Characteristics; U.S. Census Bureau, LODES version 8 geography crosswalk; U.S. Bureau of Labor Statistics, Quarterly Census of Employment and Wages, annual averages by industry; U.S. Census Bureau, County Business Patterns, ZIP Code Business Patterns
- What decides it. From 2015 to 2019 Multnomah County’s jobs grew 8.3% and the rest of the region’s grew 11.4%. Six more years of that yearly gap, with the rest of the region growing 3.9% as it did, would leave the county down 0.7%, which is 3,747 jobs, 15% of the loss. Source: U.S. Census Bureau, LEHD Origin-Destination Employment Statistics (LODES), version 8, Workplace Area Characteristics; U.S. Census Bureau, LODES version 8 geography crosswalk; U.S. Bureau of Labor Statistics, Quarterly Census of Employment and Wages, annual averages by industry; U.S. Census Bureau, County Business Patterns, ZIP Code Business Patterns
- What decides it. Across 48 large metros, central counties that lagged their suburbs from 2015 to 2019 kept lagging afterward. That pattern predicts 25% to 31% of Multnomah’s loss, with margins of error from 4% to 54%. Source: U.S. Census Bureau, LEHD Origin-Destination Employment Statistics (LODES), version 8, Workplace Area Characteristics; U.S. Census Bureau, LODES version 8 geography crosswalk; U.S. Bureau of Labor Statistics, Quarterly Census of Employment and Wages, annual averages by industry; U.S. Census Bureau, County Business Patterns, ZIP Code Business Patterns
Strongest evidence against. Multnomah’s earlier gap was not unusual: 14 of 48 central counties lagged their suburbs by more. After allowing for its region’s growth, Multnomah’s shortfall is still the second largest of 48. The trend does not say what caused it.
Sources: U.S. Census Bureau, LEHD Origin-Destination Employment Statistics (LODES), version 8, Workplace Area Characteristics; U.S. Census Bureau, LODES version 8 geography crosswalk; U.S. Bureau of Labor Statistics, Quarterly Census of Employment and Wages, annual averages by industry; U.S. Census Bureau, County Business Patterns, ZIP Code Business Patterns
For the county, safety and street conditions cannot be sized: the range is 0% to 63%. What is measured is that restaurant, hotel and entertainment jobs fell 12.2% in Multnomah County, the most of ten comparison counties and about twice the 5.7% fall in Hennepin and Ramsey counties. The extra loss is 3,100 to 4,600 jobs, 12% to 18% of the county total. The records do not say how much of that is street conditions and how much is fewer office workers, visitors and residents.
3 figures, with sources and method
- 0% to 63% Share of the loss this can account for. How it was worked out: Each end of a range comes from a separate calculation on Census block job counts, federal payroll counts by county or Census counts of businesses by ZIP code. The ranges overlap and cannot be added together. Source: U.S. Census Bureau, LEHD Origin-Destination Employment Statistics (LODES), version 8, Workplace Area Characteristics; U.S. Census Bureau, LODES version 8 geography crosswalk; U.S. Bureau of Labor Statistics, Quarterly Census of Employment and Wages, annual averages by industry; U.S. Census Bureau, County Business Patterns, ZIP Code Business Patterns
- What decides it. Restaurant, hotel and entertainment jobs fell 12.2% in Multnomah County (7,226 jobs), the largest fall of ten comparison counties. Hennepin and Ramsey counties lost 5.7%, King County 5.0% and Denver 2.3%. Source: U.S. Census Bureau, LEHD Origin-Destination Employment Statistics (LODES), version 8, Workplace Area Characteristics; U.S. Census Bureau, LODES version 8 geography crosswalk; U.S. Bureau of Labor Statistics, Quarterly Census of Employment and Wages, annual averages by industry; U.S. Census Bureau, County Business Patterns, ZIP Code Business Patterns
- What decides it. The fall beyond what the region’s growth, population change and comparison counties would predict is 3,100 to 4,600 jobs, 12% to 18% of the county loss. Source: U.S. Census Bureau, LEHD Origin-Destination Employment Statistics (LODES), version 8, Workplace Area Characteristics; U.S. Census Bureau, LODES version 8 geography crosswalk; U.S. Bureau of Labor Statistics, Quarterly Census of Employment and Wages, annual averages by industry; U.S. Census Bureau, County Business Patterns, ZIP Code Business Patterns
Strongest evidence against. The 3,100 to 4,600 is what is left after other things are allowed for. Street conditions themselves were not measured. Fewer office workers, visitors and residents would produce the same shortfall. Nothing ties the office, factory or wholesale losses to safety.
Sources: U.S. Census Bureau, LEHD Origin-Destination Employment Statistics (LODES), version 8, Workplace Area Characteristics; U.S. Census Bureau, LODES version 8 geography crosswalk; U.S. Bureau of Labor Statistics, Quarterly Census of Employment and Wages, annual averages by industry; U.S. Census Bureau, County Business Patterns, ZIP Code Business Patterns
Local taxes account for between 0% and 30% of the county’s job loss. No job count breaks at a tax date. The office loss did come late, 66% of it in 2024 and 2025, which is when leases signed before the 2021 income taxes would run out, but Hennepin and Ramsey counties, which have no local income tax, lost office jobs in those two years as well: 4.7% against 8.1% in Multnomah. The part of that late fall specific to Portland is 3,300 to 5,400 jobs, 13% to 21% of the county loss, and taxes share it with every other local cause.
3 figures, with sources and method
- 0% to 30% Share of the loss this can account for. How it was worked out: Each end of a range comes from a separate calculation on Census block job counts, federal payroll counts by county or Census counts of businesses by ZIP code. The ranges overlap and cannot be added together. Source: U.S. Census Bureau, LEHD Origin-Destination Employment Statistics (LODES), version 8, Workplace Area Characteristics; U.S. Census Bureau, LODES version 8 geography crosswalk; U.S. Bureau of Labor Statistics, Quarterly Census of Employment and Wages, annual averages by industry; U.S. Census Bureau, County Business Patterns, ZIP Code Business Patterns
- What decides it. If the whole gap between Portland and its Oregon suburbs in the number of office businesses (4.8 points from 2019 to 2023, or 5.8 allowing for the earlier trend) were a tax effect, it would be 5,121 to 6,243 office jobs. Adding at most 1,500 jobs from the spending of households that left gives a ceiling of 26% to 30% of the county loss. Source: U.S. Census Bureau, LEHD Origin-Destination Employment Statistics (LODES), version 8, Workplace Area Characteristics; U.S. Census Bureau, LODES version 8 geography crosswalk; U.S. Bureau of Labor Statistics, Quarterly Census of Employment and Wages, annual averages by industry; U.S. Census Bureau, County Business Patterns, ZIP Code Business Patterns
- What decides it. Office jobs fell 8.1% in Multnomah County from 2023 to 2025. They fell 4.7% in Hennepin and Ramsey counties, which have no local income tax, and 2.6% at the median of nine comparison counties. Multnomah’s extra fall is 3,300 to 5,400 jobs, 13% to 21% of the county loss. Source: U.S. Census Bureau, LEHD Origin-Destination Employment Statistics (LODES), version 8, Workplace Area Characteristics; U.S. Census Bureau, LODES version 8 geography crosswalk; U.S. Bureau of Labor Statistics, Quarterly Census of Employment and Wages, annual averages by industry; U.S. Census Bureau, County Business Patterns, ZIP Code Business Patterns
Strongest evidence against. For a larger effect: the office loss came late, when leases signed before the 2021 income taxes would run out, and Multnomah’s late fall was the largest of ten. For a smaller effect: no job series breaks at a tax date, office work in Portland away from downtown outgrew the suburbs, and Hennepin and Ramsey counties, with no local income tax, lost office jobs in the same two years.
Sources: U.S. Census Bureau, LEHD Origin-Destination Employment Statistics (LODES), version 8, Workplace Area Characteristics; U.S. Census Bureau, LODES version 8 geography crosswalk; U.S. Bureau of Labor Statistics, Quarterly Census of Employment and Wages, annual averages by industry; U.S. Census Bureau, County Business Patterns, ZIP Code Business Patterns
A slow region explains little: between 0% and 26% of the county’s loss. Portland’s suburbs grew 3.9% from 2019 to 2025, a little less than suburbs elsewhere. A central county with suburbs growing that fast would normally have gained jobs. Multnomah’s shortfall against that expectation is the second largest of 48 large metros.
2 figures, with sources and method
- 0% to 26% Share of the loss this can account for. How it was worked out: Each end of a range comes from a separate calculation on Census block job counts, federal payroll counts by county or Census counts of businesses by ZIP code. The ranges overlap and cannot be added together. Source: U.S. Census Bureau, LEHD Origin-Destination Employment Statistics (LODES), version 8, Workplace Area Characteristics; U.S. Census Bureau, LODES version 8 geography crosswalk; U.S. Bureau of Labor Statistics, Quarterly Census of Employment and Wages, annual averages by industry; U.S. Census Bureau, County Business Patterns, ZIP Code Business Patterns
- What decides it. Across 48 large metros a central county gains 0.52% for each 1% its suburbs grow. Portland’s suburbs grew 3.9% from 2019 to 2025, which is 0.6 points less than the suburbs of Seattle, Denver and Minneapolis-St. Paul and 2.0 points less than the middle of the 48. That gap is worth 1,200 to 6,700 county jobs, 5% to 26% of the loss. Source: U.S. Census Bureau, LEHD Origin-Destination Employment Statistics (LODES), version 8, Workplace Area Characteristics; U.S. Census Bureau, LODES version 8 geography crosswalk; U.S. Bureau of Labor Statistics, Quarterly Census of Employment and Wages, annual averages by industry; U.S. Census Bureau, County Business Patterns, ZIP Code Business Patterns
Strongest evidence against. The link may run the other way, from a weak center to a weak region. Given its region’s growth, Multnomah County should have gained about 4,600 jobs; it lost 25,695, the second largest shortfall of 48.
Sources: U.S. Census Bureau, LEHD Origin-Destination Employment Statistics (LODES), version 8, Workplace Area Characteristics; U.S. Census Bureau, LODES version 8 geography crosswalk; U.S. Bureau of Labor Statistics, Quarterly Census of Employment and Wages, annual averages by industry; U.S. Census Bureau, County Business Patterns, ZIP Code Business Patterns
Fewer residents account for at most 12% of the county’s loss. That ceiling assumes shop and restaurant jobs fall 1% for each 1% of residents lost, which the records are too imprecise to confirm.
2 figures, with sources and method
- 0% to 12% Share of the loss this can account for. How it was worked out: Each end of a range comes from a separate calculation on Census block job counts, federal payroll counts by county or Census counts of businesses by ZIP code. The ranges overlap and cannot be added together. Source: U.S. Census Bureau, LEHD Origin-Destination Employment Statistics (LODES), version 8, Workplace Area Characteristics; U.S. Census Bureau, LODES version 8 geography crosswalk; U.S. Bureau of Labor Statistics, Quarterly Census of Employment and Wages, annual averages by industry; U.S. Census Bureau, County Business Patterns, ZIP Code Business Patterns
- What decides it. The county lost 2.6% of its residents from 2020 to 2025. If shop, restaurant and personal-service jobs fell 1% for each 1% of residents lost, that would be 3,179 of 124,342 such jobs, 12% of the county loss. Source: U.S. Census Bureau, LEHD Origin-Destination Employment Statistics (LODES), version 8, Workplace Area Characteristics; U.S. Census Bureau, LODES version 8 geography crosswalk; U.S. Bureau of Labor Statistics, Quarterly Census of Employment and Wages, annual averages by industry; U.S. Census Bureau, County Business Patterns, ZIP Code Business Patterns
Strongest evidence against. The 1% for 1% response is an assumption; the measured response is too imprecise to tell from zero.
Sources: U.S. Census Bureau, LEHD Origin-Destination Employment Statistics (LODES), version 8, Workplace Area Characteristics; U.S. Census Bureau, LODES version 8 geography crosswalk; U.S. Bureau of Labor Statistics, Quarterly Census of Employment and Wages, annual averages by industry; U.S. Census Bureau, County Business Patterns, ZIP Code Business Patterns
Between 1% and 15% of the county’s recorded loss may be staff who are still employed and are reported outside the county. This concerns how jobs are counted.
2 figures, with sources and method
- 1% to 15% Share of the recorded loss that may be re-reporting. How it was worked out: Each end of a range comes from a separate calculation on Census block job counts, federal payroll counts by county or Census counts of businesses by ZIP code. The ranges overlap and cannot be added together. Source: U.S. Census Bureau, LEHD Origin-Destination Employment Statistics (LODES), version 8, Workplace Area Characteristics; U.S. Census Bureau, LODES version 8 geography crosswalk; U.S. Bureau of Labor Statistics, Quarterly Census of Employment and Wages, annual averages by industry; U.S. Census Bureau, County Business Patterns, ZIP Code Business Patterns
- What decides it. This range is the downtown estimate applied to the county: 199 to 3,912 jobs that may still exist and be reported at an address outside the county, which is 1% to 15% of the 25,695 jobs the county lost. Source: U.S. Census Bureau, LEHD Origin-Destination Employment Statistics (LODES), version 8, Workplace Area Characteristics; U.S. Census Bureau, LODES version 8 geography crosswalk; U.S. Bureau of Labor Statistics, Quarterly Census of Employment and Wages, annual averages by industry; U.S. Census Bureau, County Business Patterns, ZIP Code Business Patterns
Strongest evidence against. The county payroll count shows a larger loss than the block counts, which is the opposite of what re-reporting inside the county would produce.
Sources: U.S. Census Bureau, LEHD Origin-Destination Employment Statistics (LODES), version 8, Workplace Area Characteristics; U.S. Census Bureau, LODES version 8 geography crosswalk; U.S. Bureau of Labor Statistics, Quarterly Census of Employment and Wages, annual averages by industry; U.S. Census Bureau, County Business Patterns, ZIP Code Business Patterns
Most of the county’s loss cannot be assigned to a single cause. The evidence points most to remote work and to a slide that was under way before 2020, then to safety and street conditions, and least to taxes, a slow region and the loss of residents, with wide ranges for each.
2 figures, with sources and method
- 0% to 82% Share of the county loss not assignable to one cause. How it was worked out: Each end of a range comes from a separate calculation on Census block job counts, federal payroll counts by county or Census counts of businesses by ZIP code. The ranges overlap and cannot be added together. Source: U.S. Census Bureau, LEHD Origin-Destination Employment Statistics (LODES), version 8, Workplace Area Characteristics; U.S. Census Bureau, LODES version 8 geography crosswalk; U.S. Bureau of Labor Statistics, Quarterly Census of Employment and Wages, annual averages by industry; U.S. Census Bureau, County Business Patterns, ZIP Code Business Patterns
- What decides it. The floors that can be measured (12% for remote work, 4% for the earlier slide, 1% for re-reporting) leave up to 82% unassigned. Source: U.S. Census Bureau, LEHD Origin-Destination Employment Statistics (LODES), version 8, Workplace Area Characteristics; U.S. Census Bureau, LODES version 8 geography crosswalk; U.S. Bureau of Labor Statistics, Quarterly Census of Employment and Wages, annual averages by industry; U.S. Census Bureau, County Business Patterns, ZIP Code Business Patterns
Strongest evidence against. The unassigned share shrinks whenever one of the measured minimums rises.
Sources: U.S. Census Bureau, LEHD Origin-Destination Employment Statistics (LODES), version 8, Workplace Area Characteristics; U.S. Census Bureau, LODES version 8 geography crosswalk; U.S. Bureau of Labor Statistics, Quarterly Census of Employment and Wages, annual averages by industry; U.S. Census Bureau, County Business Patterns, ZIP Code Business Patterns
None of the largest losing blocks is shown to be a change in reporting alone, but the way employers report addresses shapes several of them, and more Oregon jobs are now reported with no county at all.
7 figures, with sources and method
- 0 and 4,035 Education jobs at the Portland State University block at 1600 SW 4th Ave, 2017 and 2018. How it was worked out: The university's jobs appear at one block from 2018. All jobs on the block went from 686 to 4,732. Source: U.S. Census Bureau, LEHD Origin-Destination Employment Statistics (LODES), version 8, Workplace Area Characteristics; U.S. Census Bureau, LODES version 8 geography crosswalk; Portland State University, Human Resources
- 360 of 484 Public administration jobs still counted at the old courthouse block in 2022, two years after the courts moved. Source: U.S. Census Bureau, LEHD Origin-Destination Employment Statistics (LODES), version 8, Workplace Area Characteristics; U.S. Census Bureau, LODES version 8 geography crosswalk; Wikipedia, Multnomah County Courthouse
- 851 and 595 Management of companies jobs counted at the Liberty Centre block, 2019 and 2024. How it was worked out: KinderCare, a past headquarters tenant by a secondhand account, has had its principal office in Lake Oswego since 2022, yet most of these jobs are still counted here. Whose jobs they are is not established. Source: U.S. Census Bureau, LEHD Origin-Destination Employment Statistics (LODES), version 8, Workplace Area Characteristics; U.S. Census Bureau, LODES version 8 geography crosswalk; KinderCare Learning Companies, Inc., Form 10-K for the fiscal year ended December 28, 2024; Wikipedia, Liberty Centre
- 116 and 0 Information jobs at the block that holds the KGW television studio, 2019 and 2020. How it was worked out: No move of the station was found. That this is a reporting change is inferred. Source: U.S. Census Bureau, LEHD Origin-Destination Employment Statistics (LODES), version 8, Workplace Area Characteristics; U.S. Census Bureau, LODES version 8 geography crosswalk
- 1,777, 726 and 1,521 Finance and insurance jobs on two Gresham blocks that hold a U.S. Bank building, 2019, 2023 and 2024. How it was worked out: The rise of 795 in 2024 is the year the bank said staff would move to Gresham. From 2019 to 2023 the Gresham blocks fell along with the tower, so the earlier fall at the tower was not a move to Gresham. Source: U.S. Census Bureau, LEHD Origin-Destination Employment Statistics (LODES), version 8, Workplace Area Characteristics; U.S. Census Bureau, LODES version 8 geography crosswalk; Portland Tribune, U.S. Bank to leave iconic, pink Portland high-rise named after it
- 25,105 and 43,283 (+18,178) Private jobs in Oregon reported with the county unknown or undefined, 2019 and 2024. How it was worked out: QCEW area 41999, private ownership, all industries. Source: U.S. Bureau of Labor Statistics, Quarterly Census of Employment and Wages, annual averages by area
- 56,511 and 52,795 (-3,716) Private finance and insurance jobs in Oregon statewide, 2019 and 2024. How it was worked out: QCEW area 41000. The statewide count includes jobs with no county, so this fall is not a reporting change. Source: U.S. Bureau of Labor Statistics, Quarterly Census of Employment and Wages, annual averages by area
Strongest evidence against. The rise in jobs with no county is statewide and cannot be assigned to Multnomah County employers from public files. For finance the loss is real at the state level. A search for matching gains found them only for the three downtown moves, for Unitus and in part for U.S. Bank, which argues against reporting changes as the main explanation; it does not rule out staff who stayed on the books of an old office or were reported at home.
Sources: U.S. Census Bureau, LEHD Origin-Destination Employment Statistics (LODES), version 8, Workplace Area Characteristics; U.S. Census Bureau, LODES version 8 geography crosswalk; U.S. Bureau of Labor Statistics, Quarterly Census of Employment and Wages, annual averages by area; Portland State University, Human Resources; Wikipedia, Multnomah County Courthouse; KinderCare Learning Companies, Inc., Form 10-K for the fiscal year ended December 28, 2024; Wikipedia, Liberty Centre; Portland Tribune, U.S. Bank to leave iconic, pink Portland high-rise named after it
Not shown 12 claims: N1, N2, N3, N4, N5, N6, N7, N8, N9, N10, N11, F27
City business taxes are not shown to be the cause of the job loss: office jobs grew elsewhere in the city under the same taxes and nothing broke when the taxes rose in 2018 and 2019. They are not ruled out either.
3 figures, with sources and method
- +21.8% Change in office-type jobs in the City of Portland beyond 2 miles from downtown, 2019 to 2024. How it was worked out: See P9. Source: U.S. Census Bureau, LEHD Origin-Destination Employment Statistics (LODES), version 8, Workplace Area Characteristics; U.S. Census Bureau, LODES version 8 geography crosswalk
- +0.4 and -0.2 points Yearly change in City of Portland jobs against Washington and Clackamas counties in 2018 and 2019, the years the City's business license tax rose and its surcharge on large retailers began. How it was worked out: Growth on the Portland side less growth on the other side, measured as the change in the natural logarithm of the count, times 100. For small changes this is close to a difference in percentage points. Source: U.S. Census Bureau, LEHD Origin-Destination Employment Statistics (LODES), version 8, Workplace Area Characteristics; U.S. Census Bureau, LODES version 8 geography crosswalk; City of Portland, Ordinance 189017, amending the Business License Law rate (City Code 7.02.500); City of Portland, Revenue Division, Clean Energy Surcharge
- +65.9% Change in business applications in Multnomah County, 2019 to 2025. How it was worked out: Applications in 2025 divided by applications in 2019, less one. Source: U.S. Census Bureau, Business Formation Statistics, annual business applications by county
Strongest evidence against. The number of professional-services firms in Portland fell 7.6 points against the suburbs from 2019 to 2023, which could be a tax effect and cannot be separated from remote work and downtown conditions. Business applications are mostly from businesses with no employees and rose more in Clark County (91.7%) than in Multnomah. No public count of business tax filers by location exists to test this directly, and the independent check would list this item as not known instead of not shown.
Sources: U.S. Census Bureau, LEHD Origin-Destination Employment Statistics (LODES), version 8, Workplace Area Characteristics; U.S. Census Bureau, LODES version 8 geography crosswalk; U.S. Census Bureau, Business Formation Statistics, annual business applications by county; U.S. Census Bureau, County Business Patterns, ZIP Code Business Patterns; City of Portland, Ordinance 189017, amending the Business License Law rate (City Code 7.02.500); City of Portland, Revenue Division, Clean Energy Surcharge
The Metro income tax, which the Oregon suburbs pay too, shows no effect: the income of top earners in Washington and Clackamas counties fell against Clark County no faster after the tax than before it.
1 figure, with sources and method
- -1.9 and -1.3 points a year Yearly change in income reported on returns of $200,000 or more in Washington and Clackamas county ZIP codes against Clark County, 2015 to 2019 and 2019 to 2023. How it was worked out: Adjusted gross income in the top income class in 24 suburban ZIP codes against Clark County ZIP codes; the change over each four-year span divided by four. Growth on the Portland side less growth on the other side, measured as the change in the natural logarithm of the count, times 100. For small changes this is close to a difference in percentage points. Source: Internal Revenue Service, Statistics of Income, Individual Income Tax Statistics, ZIP Code Data
Strongest evidence against. The number of such returns did fall faster after 2019 (4.6 points a year against 3.3), and a small tax effect inside that cannot be separated from remote work.
Sources: Internal Revenue Service, Statistics of Income, Individual Income Tax Statistics, ZIP Code Data; Multnomah County Elections, May 19, 2020 Primary Election, Metro results summary
The 2017 affordable housing mandate is not shown to explain the fall in homebuilding at the city line: new housing shifted out of Multnomah County more sharply than out of any comparison central county, but apartment permits fell as far in Oregon suburbs that have no mandate.
3 figures, with sources and method
- 38.7% and 23.5%, the largest fall of ten comparison metros Multnomah County's share of housing units permitted in the metro area, 2015 to 2019 and 2020 to 2024. How it was worked out: Units permitted in the central county divided by units permitted in its metro, summed over each five-year span. Source: U.S. Census Bureau, Building Permits Survey, annual files
- -77% Change in permitted units in buildings of five or more, 2023 to 2025 against 2017 to 2019: City of Portland. How it was worked out: Units over the three later years divided by units over the three earlier years, less one. Source: U.S. Census Bureau, Building Permits Survey, annual files
- -87%, -75%, -70%, -67% and -65% The same change in Beaverton, Lake Oswego, Hillsboro, Gresham and Washington County. How it was worked out: Same calculation. Source: U.S. Census Bureau, Building Permits Survey, annual files
Strongest evidence against. Portland's share of the four-county area's permitted apartment units dropped from 49.1% in 2019 to 20.0% in 2020, about when projects approved before the mandate ran out. That is the timing the mandate would produce, so a part for the mandate is not ruled out. A separate comparison with other cities (claim F35) finds the mandate may explain part of the fall in apartment approvals.
Sources: U.S. Census Bureau, Building Permits Survey, annual files; City of Portland, Ordinance 188163, Inclusionary Housing, with the amendment record of December 13 and 14, 2016
School closures are not shown to be a cause: enrollment fell somewhat more in Portland Public Schools than in the typical neighboring district, but middle-income households did not shift from Portland to the suburbs.
3 figures, with sources and method
- -12.2% Change in enrollment in Portland Public Schools, fall 2019 to fall 2025. How it was worked out: Fall 2025 enrollment divided by fall 2019 enrollment, less one. Source: Oregon Department of Education, Fall Membership Report
- -8.6% (from -2.0% to -15.8%) The same change in eight neighboring districts (median and range). How it was worked out: Beaverton, Hillsboro, Lake Oswego, North Clackamas, David Douglas, Gresham-Barlow, Vancouver and Evergreen. Source: Oregon Department of Education, Fall Membership Report; Washington Office of Superintendent of Public Instruction, Report Card Enrollment from 2014-15 to Current Year
- +7.8 and +3.8 points, in Portland's favor Change in tax returns with income of $100,000 to $200,000, and of $50,000 to $100,000, in Portland ZIP codes against Washington and Clackamas county ZIP codes, tax years 2019 to 2023. How it was worked out: Growth on the Portland side less growth on the other side, measured as the change in the natural logarithm of the count, times 100. For small changes this is close to a difference in percentage points. Source: Internal Revenue Service, Statistics of Income, Individual Income Tax Statistics, ZIP Code Data
Strongest evidence against. Portland did lose more students than the typical neighbor, and where families moved was not measured by district. School closures were not tested against jobs.
Sources: Oregon Department of Education, Fall Membership Report; Washington Office of Superintendent of Public Instruction, Report Card Enrollment from 2014-15 to Current Year; Internal Revenue Service, Statistics of Income, Individual Income Tax Statistics, ZIP Code Data
Housing cost is not shown to be the cause of the loss after 2020: Multnomah County lost residents to the rest of the country at about the same rate as the central counties of Seattle and Minneapolis-St. Paul.
2 figures, with sources and method
- -45.5, -42.5 and -47.2 Net moves to the rest of the United States, July 2020 to July 2025, per 1,000 residents: Multnomah, King, and Hennepin and Ramsey counties. How it was worked out: Net domestic migration summed over five years, divided by the 2020 population. Source: U.S. Census Bureau, County Population Totals and Components of Change, Vintage 2025
- -13.2 The same for the Portland metro area as a whole. How it was worked out: The same calculation for the seven metro counties together. Source: U.S. Census Bureau, County Population Totals and Components of Change, Vintage 2025; U.S. Census Bureau, Metropolitan and Micropolitan Statistical Area Population Totals, Vintage 2025
Strongest evidence against. This was tested only against people moving, and it does not rule out housing cost as a reason people left before 2020.
Sources: U.S. Census Bureau, County Population Totals and Components of Change, Vintage 2025; U.S. Census Bureau, Metropolitan and Micropolitan Statistical Area Population Totals, Vintage 2025
A damaged reputation, as something separate from conditions on the ground, is not shown: arrivals from other states stalled just as much in Washington and Clackamas counties and in Minneapolis's county as in Multnomah.
1 figure, with sources and method
- +1.0%, -2.2%, -3.2% and -3.4% Change in tax returns arriving from other states, 2021-22 and 2022-23 against 2017-18 and 2018-19: Multnomah, Washington (Oregon), Clackamas and Hennepin counties. How it was worked out: The yearly average number of returns in the two later filing-year pairs divided by the average in the two earlier pairs. Source: Internal Revenue Service, Statistics of Income, U.S. Population Migration Data, county-to-county flows
Strongest evidence against. People deciding against Portland may not tell Beaverton from the city, so a reputation effect could cover the whole Oregon side. No survey of visitors or movers was available, and the fall in restaurant and hotel jobs fits a visitor effect.
The loss of locally owned headquarters is not shown to be a cause of the job loss: nothing in the evidence shows that outside-owned firms left downtown faster than local ones.
Strongest evidence against. The downtown office towers in financial trouble in 2023 were mostly owned from out of town, according to reporting at the time. No count of departures by ownership exists, so the comparison rests on a small number of named cases.
Sources: Willamette Week, Empty and Unwanted: The Iconic Buildings of Portland's Skyline Are in Trouble
The urban growth boundary is not shown to have caused the decline: home prices against incomes in Portland's counties sit among those of comparison counties, though a documented shortage of large industrial sites was not tested against job growth.
2 figures, with sources and method
- 6.40, 7.12, 7.62, 6.75, 7.39 and 4.72 Typical home value divided by income per person, 2024: Multnomah, Washington (Oregon), Clark, King, Salt Lake and Denver counties. How it was worked out: Zillow's typical home value for December 2024 divided by the county's per capita personal income for 2024. Source: Zillow Research, Zillow Home Value Index, counties, all homes, middle tier, smoothed and seasonally adjusted; U.S. Bureau of Economic Analysis, County and metro area personal income summary, 1969 to 2024 (table CAINC1)
- 56 and 28; 2 ready Portland-area industrial sites of more than 25 acres, 2011 and 2022, and the number ready to build on within six months in 2022. Source: Oregon Semiconductor Competitiveness Task Force, Oregon Semiconductor Competitiveness Task Force Report, August 2022
Strongest evidence against. Large industrial sites became scarce, and the effect of that on job growth on the Oregon side of the region was not tested. Clark County, outside Oregon's land use system, has the highest ratio of home value to income of the six.
Sources: Zillow Research, Zillow Home Value Index, counties, all homes, middle tier, smoothed and seasonally adjusted; U.S. Bureau of Economic Analysis, County and metro area personal income summary, 1969 to 2024 (table CAINC1); Oregon Semiconductor Competitiveness Task Force, Oregon Semiconductor Competitiveness Task Force Report, August 2022
The idea that the taxes of 2018 to 2020 started the slide is not shown: Multnomah County's share of the region's jobs was already falling every year from 2015, three years before the first of them.
3 figures, with sources and method
- 43.87%, 43.74%, 43.56%, 43.36%, 43.22% and 43.05% Multnomah County's share of the seven-county metro's payroll jobs, each year 2014 to 2019. How it was worked out: Multnomah County employment as a percent of the seven-county total. Source: U.S. Bureau of Labor Statistics, Quarterly Census of Employment and Wages, annual averages by industry
- 2018 First tax year of the City's higher business license tax rate (2.6%, up from 2.2%). Source: City of Portland, Ordinance 189017, amending the Business License Law rate (City Code 7.02.500)
- 2020 First tax year of the county's higher business income tax rate (2.0%, up from 1.45%). Source: Multnomah County, Ordinance No. 1283, amending Multnomah County Code Chapter 12, Business Income Tax
Strongest evidence against. A slide that began earlier could still have been deepened by the taxes, and effects of taxes can lag by years because of leases. Nothing here separates the two.
Sources: U.S. Bureau of Labor Statistics, Quarterly Census of Employment and Wages, annual averages by industry; City of Portland, Ordinance 189017, amending the Business License Law rate (City Code 7.02.500); City of Portland, Revenue Division, Clean Energy Surcharge; Multnomah County, Ordinance No. 1283, amending Multnomah County Code Chapter 12, Business Income Tax
Policy backed by funders from outside Oregon is not shown to be a cause of the job loss: it was not tested against jobs.
Strongest evidence against. The absence of a test is not evidence of no effect.
Sources: Ballotpedia, Oregon Measure 110, Drug Decriminalization and Addiction Treatment Initiative (2020); Ballotpedia, Oregon Measure 109, Psilocybin Mushroom Services Program Initiative (2020); Ballotpedia, Oregon Measure 114, Changes to Firearm Ownership and Purchase Requirements Initiative (2022); Ballotpedia, Oregon Legalized Marijuana Initiative, Measure 91 (2014); Ballotpedia, Portland, Oregon, Measure 26-201, Renewable Energy Initiative (November 2018); Ballotpedia, Portland, Oregon, Measure 26-228, Changes to City Governance and Ranked-Choice Voting Measure (November 2022); Ballotpedia, Multnomah County, Oregon, Measure 26-214, Income Tax to Fund Tuition-Free Preschool Program (November 2020); Ballotpedia, Portland Metro, Oregon, Measure 26-210, Income and Business Taxes for Homeless Services (May 2020); City of Portland, Auditor, Certification of the November 6, 2018 election results; KOIN 6 News, Opponents say out-of-state, big-money donors are influencing Portland charter vote; Multnomah County Elections, May 19, 2020 Primary Election, Metro results summary
It is not shown that Portland's center did worse than Minneapolis-St. Paul's on residents moving away or on arrivals from other states, under different taxes. On office jobs Multnomah County did worse: it lost 11.8% from 2019 to 2025 against 8.2%, and the two are equal at 10.5% only on a broad measure that includes temporary help and call centers.
5 figures, with sources and method
- -10.5% and -10.5% Change in private office-type jobs on the broad measure, with temporary help and call centers, 2019 to 2025: Multnomah County, and Hennepin and Ramsey counties. How it was worked out: See S2. Source: U.S. Bureau of Labor Statistics, Quarterly Census of Employment and Wages, annual averages by industry
- -11.8% and -8.2% The same on the narrower measure used for downtown. How it was worked out: Information, finance and insurance, real estate, professional services and management of companies. Source: U.S. Bureau of Labor Statistics, Quarterly Census of Employment and Wages, annual averages by industry
- -45.5 and -47.2 Net moves to the rest of the United States, July 2020 to July 2025, per 1,000 residents. How it was worked out: See N5. Source: U.S. Census Bureau, County Population Totals and Components of Change, Vintage 2025
- +1.0% and -3.4% Change in tax returns arriving from other states: Multnomah and Hennepin counties. How it was worked out: See N6. Source: Internal Revenue Service, Statistics of Income, U.S. Population Migration Data, county-to-county flows
- +0.1% and +0.5% Change in metro area jobs, 2019 to 2025: Portland and Minneapolis-St. Paul. How it was worked out: See P5. Source: U.S. Bureau of Labor Statistics, Quarterly Census of Employment and Wages, annual averages by industry
Strongest evidence against. Multnomah County is the weaker of the two on total jobs (-4.9% against -1.7%), on restaurant and hotel jobs (-12.2% against -5.7%) and on factory jobs (-20.8% against -2.7%).
Sources: U.S. Bureau of Labor Statistics, Quarterly Census of Employment and Wages, annual averages by industry; U.S. Census Bureau, County Population Totals and Components of Change, Vintage 2025; Internal Revenue Service, Statistics of Income, U.S. Population Migration Data, county-to-county flows
It is not shown that the district attorney stopped prosecuting serious crimes: felony cases fell in 2020 and recovered above their 2019 level, while cases for minor offenses fell 71%.
5 figures, with sources and method
- August 11, 2020 Date of the district attorney's policy of not charging offenses tied only to protesting. Source: OPB and NPR, published by KPBS, Multnomah County DA: Most Portland Protesters Won't Face Charges
- 85.3 and 107.1 Felony cases filed in Multnomah County, 2020 and 2023, with 2019 set to 100. Source: Oregon Judicial Department, State Trial Courts, Cases Filed, 2018 to 2025
- 80.8 and 73.6 The same in 2023 for Washington and Clackamas counties. Source: Oregon Judicial Department, State Trial Courts, Cases Filed, 2018 to 2025
- -71% (8,824 to 2,540), -14% and -17% Change in misdemeanor cases filed, 2019 to 2022: Multnomah, Washington and Clackamas counties. Source: Oregon Judicial Department, State Trial Courts, Cases Filed, 2018 to 2025
- 153 to 170 in Portland; 93, 107 and 94 in Gresham Serious assault rate against the 2017 to 2019 average, 2021 to 2025: Portland, and Gresham from 2023. How it was worked out: Gresham has the same district attorney and its own police. Source: Federal Bureau of Investigation, Crime Data Explorer, summarized offense counts by police agency
Strongest evidence against. The counts cover all felonies and do not show whether charging kept pace with the rise in violence. Misdemeanor filings were already falling before 2020, and police were sending prosecutors fewer cases. Gresham's homicides more than doubled, so a countywide cause for homicide is not ruled out. The effect of fewer minor charges on disorder was not measured.
Sources: OPB and NPR, published by KPBS, Multnomah County DA: Most Portland Protesters Won't Face Charges; Oregon Judicial Department, State Trial Courts, Cases Filed, 2018 to 2025; Federal Bureau of Investigation, Crime Data Explorer, summarized offense counts by police agency
Not known 12 claims: L4, K1, K2, K4, K5, K6, F11, F32, F39, F40, F45, B10
Counts of tax filers with income of $200,000 or more cannot show how many households the county income tax that began in 2021 moved. By 2023 Portland had about 830 fewer such filers than it would have had at the growth rate of its Oregon suburbs since 2019, 7,728 fewer than at Clark County's rate, and 8,425 fewer than at the rate of east Multnomah County, which pays the same taxes. Measured from 2020, the last year before the tax, Portland had 162 more than the Oregon suburbs' rate implies.
5 figures, with sources and method
- 32,950 Tax returns with income of $200,000 or more in Portland ZIP codes, tax year 2023. How it was worked out: Returns in the top income class in 26 Portland ZIP codes, added together. Source: Internal Revenue Service, Statistics of Income, Individual Income Tax Statistics, ZIP Code Data
- About 830 (826) Returns of that kind Portland would have had in 2023, beyond what it did have, if it had kept pace with Washington and Clackamas counties since 2019. How it was worked out: Portland's 2019 count times the growth of the count in 24 Washington and Clackamas county ZIP codes from 2019 to 2023, less Portland's 2023 count. Residents of those two counties pay the Metro income tax, so this comparison cannot show any effect of that tax. Source: Internal Revenue Service, Statistics of Income, Individual Income Tax Statistics, ZIP Code Data
- The same gap measured from 2020, 2018 and 2017 instead of 2019. 162 more than the suburbs' growth implies from 2020; 1,049 fewer from 2018; 454 fewer from 2017 How it was worked out: The same calculation with a different starting year. Source: Internal Revenue Service, Statistics of Income, Individual Income Tax Statistics, ZIP Code Data
- 7,728 fewer (19.0% of the expected count) The same gap against Clark County, Washington, which has no income tax, from 2019. How it was worked out: Portland's 2019 count times the growth of Clark County's count from 2019 to 2023, less Portland's 2023 count. On returns with income of $100,000 to $200,000, which the county tax mostly does not reach, Portland is also behind Clark County, by 5,401. Source: Internal Revenue Service, Statistics of Income, Individual Income Tax Statistics, ZIP Code Data
- 8,425 fewer (20.4% of the expected count) The same gap against east Multnomah County, which pays the same county and Metro taxes, from 2019. How it was worked out: The same calculation against Multnomah County ZIP codes east of Portland. Source: Internal Revenue Service, Statistics of Income, Individual Income Tax Statistics, ZIP Code Data
Strongest evidence against. These counts cover filers living in each place, so they also reflect people who never arrived and incomes that rose or fell. Seattle, Denver and Minneapolis lost more top filers to their suburbs on the same measure with no such tax (4.5, 8.8 and 9.4 points against Portland's 2.5). In the other direction, the one study of the tax, a working paper, estimates that the share of income leaving the county rose by up to 3.7 percentage points, which its authors call an upper bound, and the income of people leaving the county rose more than in any comparison county.
Sources: Internal Revenue Service, Statistics of Income, Individual Income Tax Statistics, ZIP Code Data; Karen Conway, John Iselin and Jon Rork, Mult-No-More? The Migration Effects of Multnomah County's Preschool For All Income Tax; Internal Revenue Service, Statistics of Income, U.S. Population Migration Data, county-to-county flows; Multnomah County Elections, Multnomah County Voters' Pamphlet, General Election, November 3, 2020
The evidence points most to remote and hybrid work, then to safety and street conditions, and least to taxes. What it cannot do is divide the 55% to 90% of the downtown loss that is specific to Portland among them.
Sources: University of Toronto, School of Cities, Downtown Recovery rankings; U.S. Census Bureau, American Community Survey 1-year estimates, table B08406, Sex of Workers by Means of Transportation to Work for Workplace Geography; U.S. Census Bureau, American Community Survey 1-year estimates, table B08301, Means of Transportation to Work; U.S. Bureau of Labor Statistics, Quarterly Census of Employment and Wages, annual averages by industry; U.S. Census Bureau, Metropolitan and Micropolitan Statistical Area Population Totals, Vintage 2025; U.S. Census Bureau, LEHD Origin-Destination Employment Statistics (LODES), version 8, Workplace Area Characteristics; U.S. Census Bureau, LODES version 8 geography crosswalk; U.S. Census Bureau, Business Formation Statistics, annual business applications by county; U.S. Census Bureau, County Business Patterns, ZIP Code Business Patterns; City of Portland, Ordinance 189017, amending the Business License Law rate (City Code 7.02.500); City of Portland, Revenue Division, Clean Energy Surcharge
It is not known how much of the recorded loss is real and how much is staff who still have their jobs but are now reported at another address.
Strongest evidence against. Counted by where people actually work, the number working on site in Portland fell 20.0% from 2019 to 2025, so a large real change in where work is done is not in doubt.
Sources: U.S. Census Bureau, LEHD Origin-Destination Employment Statistics (LODES), version 8, Workplace Area Characteristics; U.S. Census Bureau, American Community Survey 1-year estimates, table B08406, Sex of Workers by Means of Transportation to Work for Workplace Geography
It is not known why the slide against the suburbs began about 2015.
Sources: U.S. Bureau of Labor Statistics, Quarterly Census of Employment and Wages, annual averages by industry; U.S. Census Bureau, LEHD Origin-Destination Employment Statistics (LODES), version 8, Workplace Area Characteristics; U.S. Census Bureau, LODES version 8 geography crosswalk
It is not known why immigration from abroad to Multnomah County is so much lower than to comparable counties.
Sources: U.S. Census Bureau, County Population Totals and Components of Change, Vintage 2025
It is not known whether the policy changes of 2024 to 2026 are working, because job counts end in 2024 for the city and in March 2026 for the county, where they were still falling.
Sources: U.S. Census Bureau, LEHD Origin-Destination Employment Statistics (LODES), version 8, Workplace Area Characteristics; U.S. Bureau of Labor Statistics, Quarterly Census of Employment and Wages, annual averages by industry
What caused the early slide is mostly not known: the business taxes of 2018 to 2020 came after the jobs gap opened, and the minimum wage and housing costs do not explain it.
4 figures, with sources and method
- Third quarter of 2016 Quarter by which the jobs gap had opened. How it was worked out: See F3. Source: U.S. Bureau of Labor Statistics, Quarterly Census of Employment and Wages, County High-Level files
- 2018 First tax year of the City's higher business tax rate. Source: City of Portland, Ordinance 189017, amending the Business License Law rate (City Code 7.02.500)
- +12.9% and +5.4% Change in restaurant and bar jobs, 2015 to 2019: Washington County and Multnomah County, under the same minimum wage. How it was worked out: Private employment in food services and drinking places. Taken from the saved output of the analysis and not recomputed for this page. Source: U.S. Bureau of Labor Statistics, Quarterly Census of Employment and Wages, annual averages by area
- +10.6%, +12.5% and +13.5% Job growth, 2015 to 2019, in three central counties whose net moves from the rest of the country fell as Multnomah's did: Denver, King (Seattle) and Travis (Austin). Source: U.S. Bureau of Labor Statistics, Quarterly Census of Employment and Wages, annual averages by industry
Strongest evidence against. Taxes that came later could still have deepened a slide that had begun. Commercial rents, the City's fees taken together and street conditions were not tested. The comparison with Denver, Seattle and Austin uses net moves, which combine arrivals and departures.
Sources: U.S. Bureau of Labor Statistics, Quarterly Census of Employment and Wages, annual averages by industry; U.S. Bureau of Labor Statistics, Quarterly Census of Employment and Wages, County High-Level files; U.S. Bureau of Labor Statistics, Quarterly Census of Employment and Wages, annual averages by area; City of Portland, Ordinance 189017, amending the Business License Law rate (City Code 7.02.500)
What caused the rise after 2019 is not known: rents explain little of Portland's gap, and no study measures how local policy would have caused it.
3 figures, with sources and method
- 0% to 20% Share of Portland's gap with comparison areas that rent and empty-apartment rates explain. How it was worked out: From a model of homelessness rates on rent and vacancy across 44 large-city count areas, 2011 to 2023. Taken from the saved output of the analysis and not recomputed for this page. Source: U.S. Department of Housing and Urban Development, 2007 to 2025 Point-in-Time Estimates by Continuum of Care; U.S. Census Bureau, American Community Survey 1-year estimates, tables B25064 (median gross rent) and B25004 (vacancy status)
- 2.1 to 3.1 times, in every year tested since 2011 Multnomah County's counted rate against the rate its rent and vacancy predict. How it was worked out: Taken from the saved output of the analysis and not recomputed for this page. Source: U.S. Department of Housing and Urban Development, 2007 to 2025 Point-in-Time Estimates by Continuum of Care; U.S. Census Bureau, American Community Survey 1-year estimates, tables B25064 (median gross rent) and B25004 (vacancy status)
- None to 45% Share of the gap that local policy since 2015 could explain. How it was worked out: The upper figure is the whole rise after 2019 beyond comparison areas. No mechanism was measured. Source: U.S. Department of Housing and Urban Development, 2007 to 2025 Point-in-Time Estimates by Continuum of Care
Strongest evidence against. Because the excess over what rents predict is as old as 2011, it may reflect how the county counts, its climate and its shelter system as much as anything decided since 2015.
Sources: U.S. Department of Housing and Urban Development, 2007 to 2025 Point-in-Time Estimates by Continuum of Care; U.S. Census Bureau, American Community Survey 1-year estimates, tables B25064 (median gross rent) and B25004 (vacancy status)
Whether Measure 110 raised overdose deaths is not known: measured from the month fentanyl became common, Oregon and Washington rose most of six western states, and both had loosened their drug laws.
5 figures, with sources and method
- September 2020 and August 2016 Month synthetic opioids reached 25% of overdose deaths: Oregon and the United States. How it was worked out: Deaths involving synthetic opioids divided by all overdose deaths, 12 months ending in each month. Source: Centers for Disease Control and Prevention, National Center for Health Statistics, VSRR Provisional Drug Overdose Death Counts
- 2.43 and 2.20 Overdose death rate as a multiple of its level in that month, 36 and 48 months later: Oregon. Source: Centers for Disease Control and Prevention, National Center for Health Statistics, VSRR Provisional Drug Overdose Death Counts
- 2.73, 1.99, 1.95, 1.65 and 1.01 The same for Washington, California, Nevada, Colorado and Idaho at 48 months. Source: Centers for Disease Control and Prevention, National Center for Health Statistics, VSRR Provisional Drug Overdose Death Counts
- February 25, 2021; a misdemeanor law that expired in 2023 Date Washington's felony possession law was struck down, and the law that replaced it. Source: Washington Supreme Court, State v. Blake, No. 96873-0; Washington State Legislature, Engrossed Senate Bill 5476, Chapter 311, Laws of 2021
- March 2024, at 44.8 for every 100,000 residents Month Oregon's 12-month death rate peaked. Source: Centers for Disease Control and Prevention, National Center for Health Statistics, VSRR Provisional Drug Overdose Death Counts
Strongest evidence against. The same pattern fits fentanyl reaching the Northwest last. Oregon's deaths began falling about five months before penalties returned.
Sources: Centers for Disease Control and Prevention, National Center for Health Statistics, VSRR Provisional Drug Overdose Death Counts; Washington Supreme Court, State v. Blake, No. 96873-0; Washington State Legislature, Engrossed Senate Bill 5476, Chapter 311, Laws of 2021
Three published studies of Measure 110 and overdose deaths disagree, and none covers 2023 and 2024.
3 figures, with sources and method
- 182, 23% more than predicted Extra deaths in 2021 in the one study that finds an effect. Source: Noah Spencer, Does drug decriminalization increase unintentional drug overdose deaths?
- No statistically significant change in the first year Finding of the second study. Source: Spruha Joshi and colleagues, One-Year Association of Drug Possession Law Change With Fatal Drug Overdose in Oregon and Washington
- Finding of the third study. A link that disappears once the spread of fentanyl is taken into account Source: Michael Zoorob and colleagues, Drug Decriminalization, Fentanyl, and Fatal Overdoses in Oregon
Strongest evidence against. The first two studies make no allowance for the arrival of fentanyl. The second study's title describes a one-year follow-up.
Sources: Noah Spencer, Does drug decriminalization increase unintentional drug overdose deaths?; Spruha Joshi and colleagues, One-Year Association of Drug Possession Law Change With Fatal Drug Overdose in Oregon and Washington; Michael Zoorob and colleagues, Drug Decriminalization, Fentanyl, and Fatal Overdoses in Oregon
Whether out-of-state money on the progressive side of ballot measures rose after 2016 cannot be told: the answer flips with where 2016 is counted.
3 figures, with sources and method
- $1.93 million and $1.50 million Identified out-of-state money on the progressive side, yearly average, 2012 to 2016 and 2017 to 2026. How it was worked out: $9,670,553 over five years and $15,034,368 over ten, from 41 Oregon and Portland-area measures. The pages of the other measures are not each linked here. Source: Ballotpedia, Oregon Legalized Marijuana Initiative, Measure 91 (2014); Ballotpedia, Oregon Measure 110, Drug Decriminalization and Addiction Treatment Initiative (2020); Ballotpedia, Oregon Measure 109, Psilocybin Mushroom Services Program Initiative (2020); Ballotpedia, Oregon Measure 114, Changes to Firearm Ownership and Purchase Requirements Initiative (2022)
- $1.19 million and $1.81 million The same with 2016 moved to the later period. How it was worked out: $4,765,000 over four years and $19,939,921 over eleven. Source: Ballotpedia, Oregon Legalized Marijuana Initiative, Measure 91 (2014); Ballotpedia, Oregon Measure 110, Drug Decriminalization and Addiction Treatment Initiative (2020); Ballotpedia, Oregon Measure 109, Psilocybin Mushroom Services Program Initiative (2020); Ballotpedia, Oregon Measure 114, Changes to Firearm Ownership and Purchase Requirements Initiative (2022)
- Nearly all of it ($4,665,000 of $4,765,000) Share of the money before 2016 that was for the 2014 marijuana measure. Source: Ballotpedia, Oregon Legalized Marijuana Initiative, Measure 91 (2014)
Strongest evidence against. Donor lists are incomplete, the state system was not searched, and money for candidates before 2020 was not counted.
Sources: Ballotpedia, Oregon Legalized Marijuana Initiative, Measure 91 (2014); Ballotpedia, Oregon Measure 110, Drug Decriminalization and Addiction Treatment Initiative (2020); Ballotpedia, Oregon Measure 109, Psilocybin Mushroom Services Program Initiative (2020); Ballotpedia, Oregon Measure 114, Changes to Firearm Ownership and Purchase Requirements Initiative (2022)
Which employers account for most of the jobs lost on the largest blocks, and why those jobs went, is not known from public records. The job records give counts by block and industry, never by employer.
5 figures, with sources and method
- 9,273 of 12,890 (71.9%) Jobs lost on the fifteen largest losing blocks with no employer or destination identified. How it was worked out: A cell is one sector on one block. For each of the fifteen blocks, every sector whose job count fell from 2019 to 2024 is counted, and the falls are added. A cell is assigned to a named employer only where a dated source names the employer and what it did; everything else is counted as not identified. Source: U.S. Census Bureau, LEHD Origin-Destination Employment Statistics (LODES), version 8, Workplace Area Characteristics; U.S. Census Bureau, LODES version 8 geography crosswalk
- 6,587 of 8,381 Office employers: jobs lost with no employer or destination identified. Source: U.S. Census Bureau, LEHD Origin-Destination Employment Statistics (LODES), version 8, Workplace Area Characteristics; U.S. Census Bureau, LODES version 8 geography crosswalk
- Largest groups not identified, by block and sector. U.S. Bancorp Tower finance and insurance 1,188; Portland State University block education 637; U.S. Bancorp Tower administrative and support 559; Harrison Square block real estate 430; Pioneer Tower block professional and technical 351; U.S. Bancorp Tower professional and technical 347 How it was worked out: The six largest sector falls that no source ties to a named employer and action. The 637 at the university block is the part of its fall that the state staff count does not explain. Source: U.S. Census Bureau, LEHD Origin-Destination Employment Statistics (LODES), version 8, Workplace Area Characteristics; U.S. Census Bureau, LODES version 8 geography crosswalk
- 358 (2 in 2024) Jobs counted in 2019 on a block where no office building was found. How it was worked out: The block bounded by SW 12th and 13th avenues and SW Alder and Morrison streets, where the tax lots show a church and its parking garage. Source: U.S. Census Bureau, LEHD Origin-Destination Employment Statistics (LODES), version 8, Workplace Area Characteristics; U.S. Census Bureau, LODES version 8 geography crosswalk; City of Portland, PortlandMaps public tax lot map service; U.S. Census Bureau, TIGERweb, 2020 census block outlines
- 0 Jobs shown to have moved out of the Portland region. How it was worked out: None was found. The search covered the fifteen blocks and news reports and filings for their known tenants. Source: U.S. Census Bureau, LEHD Origin-Destination Employment Statistics (LODES), version 8, Workplace Area Characteristics; U.S. Census Bureau, LODES version 8 geography crosswalk
Strongest evidence against. This could be settled by records that exist but are not public: building rent rolls, commercial tenant histories, and the worksite reports employers file with the Oregon Employment Department. Until then, any account of why most of these jobs went is a guess.
Sources: U.S. Census Bureau, LEHD Origin-Destination Employment Statistics (LODES), version 8, Workplace Area Characteristics; U.S. Census Bureau, LODES version 8 geography crosswalk; City of Portland, PortlandMaps public tax lot map service; U.S. Census Bureau, TIGERweb, 2020 census block outlines
All 179 sources Every document and data file this page rests on, with a link
- Aaron Chalfin and Justin McCrary. The Effect of Police on Crime: New Evidence from U.S. Cities, 1960-2010. National Bureau of Economic Research working paper 18815: a 1% rise in police is estimated to lower violent crime by 0.34% and murder by 0.67%, with wide margins of error.. Retrieved 2026-11-15. Later published in the Review of Economics and Statistics. We applied its figures to Portland; the authors did not study Portland.
- Aaron Chalfin, Benjamin Hansen, Emily Weisburst and Morgan Williams. Police Force Size and Civilian Race. American Economic Review: Insights, June 2022 (National Bureau of Economic Research working paper 28202, Table 2): in 242 large U.S. cities each additional officer is estimated to prevent 0.058 to 0.102 homicides a year, depending on the method.. Retrieved 2026-11-15. Peer reviewed. The estimates come from cities adding officers in ordinary years, not from a sudden loss. The working paper lists no outside funder.
- Ballotpedia. Multnomah County, Oregon, Measure 26-214, Income Tax to Fund Tuition-Free Preschool Program (November 2020). Certified result: 286,068 yes (64.09%) and 160,317 no.. Retrieved 2026-11-16. Ballotpedia compiles the result and the campaign finance reports filed with the state. Its own page did not answer an automated request on November 16, 2026, so the link opens the Internet Archive's copy. Shares from outside Oregon are our calculation and are minimums.
- Ballotpedia. Oregon Legalized Marijuana Initiative, Measure 91 (2014). Certified result (56.11% yes) and contributions: $9,246,174 in support.. Retrieved 2026-11-15. Ballotpedia compiles the result and the campaign finance reports filed with the state. Its own page did not answer an automated request on November 16, 2026, so the link opens the Internet Archive's copy. Shares from outside Oregon are our calculation and are minimums.
- Ballotpedia. Oregon Measure 103, Ban Tax on Groceries Initiative (2018). Result (42.69% yes, failed) and contributions: $8,176,516 in support.. Retrieved 2026-11-15. Ballotpedia compiles the result and the campaign finance reports filed with the state. Its own page did not answer an automated request on November 16, 2026, so the link opens the Internet Archive's copy. Shares from outside Oregon are our calculation and are minimums.
- Ballotpedia. Oregon Measure 109, Psilocybin Mushroom Services Program Initiative (2020). Certified result (55.75% yes) and contributions: $5,341,127 in support.. Retrieved 2026-11-15. Ballotpedia compiles the result and the campaign finance reports filed with the state. Its own page did not answer an automated request on November 16, 2026, so the link opens the Internet Archive's copy. Shares from outside Oregon are our calculation and are minimums.
- Ballotpedia. Oregon Measure 110, Drug Decriminalization and Addiction Treatment Initiative (2020). Certified result (58.46% yes), the text summary (possession becomes a violation with a maximum fine of $100), and contributions: $6,029,291 in support, including $5,054,753 from Drug Policy Action, and $167,740 in opposition.. Retrieved 2026-11-15. Ballotpedia compiles the result and the campaign finance reports filed with the state. Its own page did not answer an automated request on November 16, 2026, so the link opens the Internet Archive's copy. Shares from outside Oregon are our calculation and are minimums.
- Ballotpedia. Oregon Measure 114, Changes to Firearm Ownership and Purchase Requirements Initiative (2022). Certified result (50.65% yes) and contributions: $3,174,984 in support.. Retrieved 2026-11-15. Ballotpedia compiles the result and the campaign finance reports filed with the state. Its own page did not answer an automated request on November 16, 2026, so the link opens the Internet Archive's copy. Shares from outside Oregon are our calculation and are minimums.
- Ballotpedia. Oregon Measure 97, Business Tax Increase Initiative (2016). Contributions for and against, and votes cast: $23.78 per vote, the highest of the ten Oregon measures compared.. Retrieved 2026-11-15. Ballotpedia compiles the result and the campaign finance reports filed with the state. Its own page did not answer an automated request on November 16, 2026, so the link opens the Internet Archive's copy. Shares from outside Oregon are our calculation and are minimums. The cost-per-vote comparison uses the Ballotpedia pages of ten Oregon measures and 18 measures in Washington, California, Colorado, Massachusetts and Alaska; this is one of them.
- Ballotpedia. Oregon Open Primary Initiative, Measure 90 (2014). Result (31.77% yes, failed) and contributions: $9,144,517 in support.. Retrieved 2026-11-15. Ballotpedia compiles the result and the campaign finance reports filed with the state. Its own page did not answer an automated request on November 16, 2026, so the link opens the Internet Archive's copy. Shares from outside Oregon are our calculation and are minimums.
- Ballotpedia. Portland Metro, Oregon, Measure 26-210, Income and Business Taxes for Homeless Services (May 2020). Result and the committees for and against the Metro homeless services taxes.. Retrieved 2026-11-15. Ballotpedia compiles the result and the campaign finance reports filed with the state. Its own page did not answer an automated request on November 16, 2026, so the link opens the Internet Archive's copy. Shares from outside Oregon are our calculation and are minimums.
- Ballotpedia. Portland, Oregon, Measure 26-201, Renewable Energy Initiative (November 2018). Result and the committees for and against the surcharge on large retailers.. Retrieved 2026-11-15. Ballotpedia compiles the result and the campaign finance reports filed with the state. Its own page did not answer an automated request on November 16, 2026, so the link opens the Internet Archive's copy. Shares from outside Oregon are our calculation and are minimums.
- Ballotpedia. Portland, Oregon, Measure 26-228, Changes to City Governance and Ranked-Choice Voting Measure (November 2022). Certified result: 164,076 yes (58.10%) and 118,336 no.. Retrieved 2026-11-16. Ballotpedia compiles the result and the campaign finance reports filed with the state. Its own page did not answer an automated request on November 16, 2026, so the link opens the Internet Archive's copy. Shares from outside Oregon are our calculation and are minimums.
- BikePortland. BTA members support changing organization name to The Street Trust. Report of August 10, 2016 on the members' vote to rename the Bicycle Transportation Alliance.. Retrieved 2026-11-15.
- Centers for Disease Control and Prevention, National Center for Health Statistics. VSRR Provisional County-Level Drug Overdose Death Counts. Deaths from drug overdose in each 12 months ending in each month, for Multnomah County and the central counties of the nine comparison cities.. Retrieved 2026-11-15. Counts are provisional. County figures carry no detail on which drug was involved.
- Centers for Disease Control and Prevention, National Center for Health Statistics. VSRR Provisional County-Level Drug Overdose Death Counts. provisional_drug_overdose by fips, year and month (12 months ending); data as of October 4, 2026; rates on Vintage 2025 county population.. Retrieved November 17, 2026.
- Centers for Disease Control and Prevention, National Center for Health Statistics. VSRR Provisional Drug Overdose Death Counts. Deaths from drug overdose in each 12 months ending in each month, by state and by drug, including synthetic opioids other than methadone (code T40.4), for Oregon, Washington, California, Nevada, Colorado, Idaho and the United States.. Retrieved 2026-11-15. Counts are provisional and are revised. Rates are our calculation with Census state populations.
- Centers for Disease Control and Prevention, National Center for Health Statistics. VSRR Provisional Drug Overdose Death Counts (state). Indicator "Number of Drug Overdose Deaths", 12 month-ending, predicted_value; states OR, WA, US.. Retrieved November 17, 2026.
- City of Portland. FIN 1.74, FY 2015-16 Revised Budget, Housing Emergency. Emergency ordinance of March 16, 2016, which recites that the Council declared a housing emergency by Ordinance 187370 on October 7, 2015.. Retrieved 2026-11-15. This is a later ordinance that restates the declaration, not the declaration itself.
- City of Portland. Ordinance 188163, Inclusionary Housing, with the amendment record of December 13 and 14, 2016. The requirement that new buildings with 20 or more homes include affordable units, for permits not vested by February 1, 2017.. Retrieved 2026-11-07. The link opens the ordinance record in the City Auditor's files. It is a large file.
- City of Portland. Ordinance 189017, amending the Business License Law rate (City Code 7.02.500). Findings 1 and 2 and the amended code: the Business License Tax rate rises from 2.2% to 2.6% of net income for tax years beginning on or after January 1, 2018.. Retrieved 2026-11-07.
- City of Portland. Planning Guidelines, Portland Downtown Plan, as adopted by City Council, December 1972. Office goal, page 15 of the fifth printing (June 1974).. Retrieved 2026-11-07. The link opens a scan of the plan in the City Auditor's records.
- City of Portland. PortlandMaps public tax lot map service. Site address, owner, property type, building size and year built for each tax lot. Used to name what stands on a census block: the lots whose footprint falls inside the block outline.. Retrieved 2026-11-16. The link opens the description of the map layer, which can be queried by location. A tax lot shows the owner of a property. It does not list tenants.
- City of Portland. The Portland Building. City facilities page, undated. Says the City Council directed the reconstruction in 2015, the building reopened in 2020, and more than 1,500 City employees work there.. Retrieved 2026-11-16.
- City of Portland, Auditor. Certification of the November 6, 2018 election results. Measure 26-201, the surcharge on large retailers: 202,517 yes (65.21%) and 108,041 no.. Retrieved 2026-11-15.
- City of Portland, Auditor. Official Minutes, Portland City Council, June 17 and 18, 2020. The vote on Ordinance 190005, which adopted the City budget for the fiscal year beginning July 1, 2020: three in favor, one against.. Retrieved 2026-11-15.
- City of Portland, Bureau of Planning. Central City Plan, adopted by the Portland City Council March 24, 1988. Policy 1, Economic Development (printed page 37), and the adopting findings on the 50,000 jobs goal and on downtown as the main office location.. Retrieved 2026-11-08. The link opens a scan of the plan in the City Auditor's records. It is a large file.
- City of Portland, Bureau of Planning and Sustainability. Central City 2035 Plan. Table of jobs and households by subdistrict, 2010 and the 2035 target: the Downtown subdistrict had 47,700 jobs and 1,900 households in 2010.. Retrieved 2026-11-15. A large file.
- City of Portland, Bureau of Planning and Sustainability. Economic Opportunities Analysis, Section 4, Alternative Choices, proposed draft, March 2012. Section IV, Central City Commercial, printed pages 13 and 14: downtown's share of the region's multi-tenant office space and the average for eight comparison cities.. Retrieved 2026-11-08. Prepared for the City by the consulting firm E.D. Hovee & Company. This is a proposed draft. The comparison is with eight cities the report calls peers.
- City of Portland, City Budget Office. Adopted Budget, Fiscal Year 2020-21, Volume One. Portland Police Bureau section, summary of budget decisions: 38 sworn positions cut with the Gun Violence Reduction Team, 14 with the school officer program, 24 with the transit division and 8 from the tactical team; and the citywide table of bureau expenses.. Retrieved 2026-11-15. A large file. Budget figures are all funds, not adjusted for inflation.
- City of Portland, City Budget Office. Adopted Budget, Fiscal Year 2022-23, Volume One. Citywide table of bureau expenses, Portland Police Bureau line.. Retrieved 2026-11-15. A large file.
- City of Portland, Office of Commissioner Carmen Rubio. Commissioner Rubio Passes Policy Reforms to Advance Housing Production. Council action of January 31, 2024: changes to 15 building rules and a deeper property tax exemption for buildings covered by the inclusionary housing requirement outside the Central City.. Retrieved 2026-11-15. A City news release describing the vote, not the ordinance text.
- City of Portland, Office of the Mayor. Portland City Council Approves a Temporary SDC Exemption to Jumpstart Housing Development. Ordinance 192082, July 2025: a three-year waiver of system development charges, the fees charged on new homes.. Retrieved 2026-11-15. A City news release describing the vote, not the ordinance text.
- City of Portland, Portland Permitting and Development. Report on Temporary SDC Exemptions for Housing, August 15, 2025 through January 15, 2026. Table of homes permitted by structure type, 2020 to 2025, from the City's permit system: 5,363 homes in 2021 and 5,075 in 2022, leaving out accessory units; 893 apartments in 2024 and 705 in 2025.. Retrieved 2026-11-15. The City counts permits issued, finaled or under inspection. The Census Bureau's survey counts permits as the City reports them each month, and the two differ.
- City of Portland, Revenue Division. Clean Energy Surcharge. Overview and rate sections: a 1% surcharge on the Portland retail sales of large retailers, adopted by voters as Measure 26-201 on November 6, 2018, for tax years from January 1, 2019.. Retrieved 2026-11-07. This is the City's own description of the law, not the text of the measure.
- City of Portland; Independent Monitor LLC. The Handling of the 2020 Protests and Riots in Portland, Oregon: An Independent Review. Executive summary and chronology: the review covers May 28 to November 15, 2020, and dates the protests from the murder of George Floyd in Minneapolis on May 25, 2020.. Retrieved 2026-11-15. Commissioned by the City. A large file.
- City of Seattle, Office of Housing. Mandatory Housing Affordability and Incentive Zoning, 2024 annual report. Background on Seattle's affordable housing requirement, which applied citywide from 2019.. Retrieved 2026-11-15.
- Cushman & Wakefield. Office MarketBeat Q3 2026: Portland, Seattle (downtown), Denver, Minneapolis, Austin, Salt Lake City, and United States. Market Statistics table of each local report, CBD row; national report, table "Vacancy Rates Q3 2026", Overall column (preliminary).. Retrieved November 17, 2026.
- East Oregonian. Portland's New Relic will lay off another 255 in latest restructuring. East Oregonian, July 2, 2023. A report from The Oregonian carried by the East Oregonian. Says the company has shifted to remote and hybrid work and has reduced its space in the U.S. Bancorp Tower.. Retrieved 2026-11-16.
- Federal Bureau of Investigation. Crime Data Explorer, police employee counts. Sworn officers employed on October 31 of each year, 2019 to 2025. Retrieved November 17, 2026.
- Federal Bureau of Investigation. Crime Data Explorer, police employee counts by agency. Sworn officers reported each year by the police departments of Portland and the comparison cities, 2010 to 2025.. Retrieved 2026-11-15. The link opens the Portland figures from the explorer's data service. Change the agency code in the address for another city. The FBI's 2019 counts for Columbus and Raleigh are missing or unreliable.
- Federal Bureau of Investigation. Crime Data Explorer, summarized offense counts by police agency. Monthly counts of homicide, violent offenses, aggravated assault, robbery, property offenses and motor vehicle theft reported by the police departments of Portland, the nine comparison cities, St. Paul, Gresham, Beaverton, Hillsboro, Vancouver and the Multnomah County Sheriff, January 2010 to December 2025, with the population each agency covers.. Retrieved 2026-11-15. The link opens the FBI's explorer, where an agency can be chosen by name. We read the same figures from the explorer's data service, for example https://cde.ucr.cjis.gov/LATEST/summarized/agency/OR0260200/V?from=01-2010&to=12-2025&type=counts for Portland. A year is left out when an agency failed to report a month: Portland 2015, Phoenix 2021, Raleigh 2014 to 2018, Minneapolis and St. Paul 2010 to 2012.
- Internal Revenue Service, Statistics of Income. Individual income tax returns, county data by size of adjusted gross income. Tax years 2011 to 2023 (files 11incyallagi.csv to 23incyallagi.csv): number of returns with adjusted gross income of $200,000 or more, by county.. Retrieved 2026-11-15. The link opens the IRS page that lists every year. A single file opens at an address such as https://www.irs.gov/pub/irs-soi/23incyallagi.csv. The $200,000 line is not adjusted for inflation.
- Internal Revenue Service, Statistics of Income. Individual Income Tax Statistics, ZIP Code Data. Tax years 2011 to 2023 (files 11zpallagi.csv to 23zpallagi.csv): number of returns (N1) and adjusted gross income (A00100) by ZIP code and income class, for ZIP codes in Portland, Washington, Clackamas and Clark counties and in Seattle, Denver and Minneapolis and their suburbs.. Retrieved 2026-11-17. The link opens the IRS page that lists every tax year; there is one national file per year. The top income class is $200,000 or more, not adjusted for inflation. ZIP codes only approximate city limits.
- Internal Revenue Service, Statistics of Income. U.S. Population Migration Data, county-to-county flows. County inflow and outflow files for filing-year pairs 2011-12 to 2022-23 (countyinflow1112.csv to countyinflow2223.csv and countyoutflow1112.csv to countyoutflow2223.csv): number of returns and adjusted gross income for returns that moved to or from another state, moved anywhere in the United States, or did not move.. Retrieved 2026-11-16. The link opens the IRS page that lists every year. A single file opens directly at an address such as https://www.irs.gov/pub/irs-soi/countyoutflow2223.csv. The files count tax returns, not people, and miss late filers and people who do not file.
- JE Dunn Construction. Providence Office Park Regional Campus. The builder's project page, undated. Describes a Providence office building and a three-story, 66,750-square-foot clinical laboratory on the campus at NE 47th Ave and NE Halsey St.. Retrieved 2026-11-16.
- Karen Conway, John Iselin and Jon Rork. Mult-No-More? The Migration Effects of Multnomah County's Preschool For All Income Tax. Draft of April 6, 2026: benchmark estimate, the authors' statement that it is an upper bound (pages 10 and 35), and the comparison group (section 4.1).. Retrieved 2026-11-07. A working paper that has not been peer reviewed. The authors disclose no funder. The copy linked is hosted by the Oregon Center for Public Policy. We did not rerun its methods.
- KATU. Daimler Truck to end production in Portland, eliminate 375 jobs. KATU, July 29, 2026. Carries the company's statement that Portland will remain its North American headquarters. The job cuts were at the truck plant.. Retrieved 2026-11-16.
- KBS Growth & Income REIT, Inc.. Form 10-K for fiscal year 2022. Annual report of the owner of the Commonwealth Building, filed with the Securities and Exchange Commission in March 2023. Gives occupancy of 87% at the start of 2021 and 51% at December 31, 2022, and the owner's account of why tenants left.. Retrieved 2026-11-16. The Securities and Exchange Commission's website refused our automated check of this link on November 16, 2026, and no Internet Archive copy exists. Our saved copy was retrieved from this address the same day.
- KBS Growth & Income REIT, Inc.. Form 10-K for fiscal year 2023. Annual report. States that the Commonwealth Building was sold at a foreclosure auction on July 18, 2023 to a buyer affiliated with the lender.. Retrieved 2026-11-16. The link opens the Internet Archive's copy of the filing, because the Securities and Exchange Commission's website refuses automated requests. The original is at https://www.sec.gov/Archives/edgar/data/1631256/000163125624000002/kbsgi-20231231.htm.
- KBS Growth & Income REIT, Inc.. Form 8-K, February 16, 2023. Report to the Securities and Exchange Commission that the borrower on the Commonwealth Building loan was in default as of February 13, 2023, with $47.4 million outstanding.. Retrieved 2026-11-16. The link opens the Internet Archive's copy of the filing, because the Securities and Exchange Commission's website refuses automated requests. The original is at https://www.sec.gov/Archives/edgar/data/1631256/000163125623000015/kbsgi-20230213.htm.
- Kidder Mathews. Hoffman Construction to Leave Headquarters at 760,000 SQFT Fox Tower in Portland. Kidder Mathews, August 16, 2023. A brokerage's repost of a summary by The Registry of a report in The Oregonian: the firm will leave Fox Tower when its lease ends in 2025 and has not said where it will go.. Retrieved 2026-11-16. A secondhand source, two steps from the original report.
- Kidder Mathews; Cushman & Wakefield; CBRE (via Portland Metro Chamber). Portland Office Market Report, 3Q 2026; Portland Office MarketBeat Q3 2026; The Future of Downtown (Council presentation, November 12, 2026). Kidder Mathews: submarket table, central business district row. Cushman & Wakefield: Market Statistics table, rows Central Core and CBD. CBRE: slide 22 of the Portland Metro Chamber presentation at https://www.portland.gov/sites/default/files/council-documents/2026/Future-of-Downtown-Presentation-1.pdf, which credits the CBRE Q3 2026 Office Market Report. Retrieved November 17, 2026.
- KinderCare Learning Companies, Inc.. Form 10-K for the fiscal year ended December 28, 2024. Annual report filed with the Securities and Exchange Commission in 2025. States that the principal executive office is at 5005 Meadows Road, Lake Oswego, under a lease entered into in January 2022. The filing does not name the earlier address.. Retrieved 2026-11-16. The link opens the Internet Archive's copy of the filing, because the Securities and Exchange Commission's website refuses automated requests. The original is at https://www.sec.gov/Archives/edgar/data/1873529/000095017025043210/klc-20241228.htm.
- KOIN 6 News. Opponents say out-of-state, big-money donors are influencing Portland charter vote. Report of 2022 on who gave to the campaign for Measure 26-228, the change in Portland's form of government.. Retrieved 2026-11-15. KOIN's own page refused an automated request on November 16, 2026, so the link opens the Internet Archive's copy.
- KOIN 6 News. Report on the Women's March on Portland and its organizers. Report on the disputes among organizers of the 2017 march and the later criminal case over its funds.. Retrieved 2026-11-15.
- KPTV. More businesses announce they're leaving downtown Portland. KPTV, August 2022. Reports that Unitus Community Credit Union will move its headquarters out of the city to several locations, one in Tigard, and quotes the chief executive's press release. The report does not give the old address.. Retrieved 2026-11-16.
- LaborCurrent. Kimpton Hotel Vintage Portland layoffs and WARN notices. A private website that compiles layoff notices. Shows one notice for 94 workers, dated March 1, 2020.. Retrieved 2026-11-16. A secondhand source: the original notice was not seen.
- Lattice Semiconductor Corporation. Form 10-K for the fiscal year ended December 28, 2019. Annual report filed with the Securities and Exchange Commission in February 2020. States that the company vacated its Portland space in early 2019, subleased it, and moved its headquarters to its building at 5555 NE Moore Court, Hillsboro. The filing does not name the Portland building.. Retrieved 2026-11-16. The link opens the Internet Archive's copy of the filing, because the Securities and Exchange Commission's website refuses automated requests. The original is at https://www.sec.gov/Archives/edgar/data/855658/000085565820000025/lscc201910-k.htm.
- Mass Transit magazine. TriMet moves to new headquarters in downtown Portland. Mass Transit magazine, August 9, 2023. TriMet's press release as carried by the magazine. About 275 people report to One Main Place at least one day a week.. Retrieved 2026-11-16.
- Michael Zoorob and colleagues. Drug Decriminalization, Fentanyl, and Fatal Overdoses in Oregon. JAMA Network Open, September 2024: a link between Measure 110 and fatal overdoses that disappears once the spread of fentanyl is taken into account.. Retrieved 2026-11-15. Peer reviewed. Funder: none listed in the journal's record; two of the authors are at RTI International, whose Measure 110 research is supported by Arnold Ventures. The publisher's page refuses automated requests; we confirmed the article through the journal registry Crossref and read the abstract.
- Multnomah County. County board approves $28 million sale of Central Courthouse to NBP Capital. County news release, September 20, 2018. The board voted to sell the old courthouse at 1021 SW 4th Ave, with the county staying in the building until the new courthouse opened. Quotes the county chair.. Retrieved 2026-11-16.
- Multnomah County. Homeless Services Department, FY 2027 Adopted Budget. Actual spending of the joint City and County homeless services office as a share of its adopted budget, fiscal years 2020 to 2025: 109%, 115%, 94%, 74%, 103% and 89%.. Retrieved 2026-11-15.
- Multnomah County. Ordinance No. 1283, amending Multnomah County Code Chapter 12, Business Income Tax. The Business Income Tax rate rises from 1.45% to 2.00% of net income for tax years beginning on or after January 1, 2020.. Retrieved 2026-11-07.
- Multnomah County and Oregon Judicial Department. Multnomah County Central Courthouse, presentation to the Oregon Legislature. April 2015. A slide lists the judges and employees expected in the new courthouse in 2020: state court staff and county staff, 395 in all by our addition.. Retrieved 2026-11-16. The link downloads the presentation from the Oregon Legislative Information System. The figures are a 2015 projection.
- Multnomah County Elections. May 19, 2020 Primary Election, Metro results summary. Certified result for Metro Measure 26-210, the income taxes for supportive housing services, which apply in the parts of Multnomah, Washington and Clackamas counties inside the Metro district.. Retrieved 2026-11-07. This is the election result, not the text of the measure.
- Multnomah County Elections. Multnomah County Voters' Pamphlet, General Election, November 3, 2020. Measure 26-214, Preschool for All, page M-56: a county income tax on taxable income above $125,000 for single filers and $200,000 for joint filers, effective January 1, 2021.. Retrieved 2026-11-08. This is the ballot title and explanation as put to voters. It is a large file.
- Multnomah County Homeless Services Department. 2025 Tri-County Point-in-Time Count Report, November 4, 2025. The 2025 count for Multnomah County: 10,526 people, of whom 5,090 were added from a list of people known to service providers and presumed to be unsheltered.. Retrieved 2026-11-16. Prepared by Portland State University's Homelessness Research and Action Collaborative for the three counties.
- Noah Spencer. Does drug decriminalization increase unintentional drug overdose deaths?. Journal of Health Economics, volume 91, September 2023: estimates that Measure 110 caused 182 additional unintentional overdose deaths in Oregon in 2021, 23% more than predicted.. Retrieved 2026-11-15. Peer reviewed. Funder: none named in the abstract or in the journal's record. The method builds a comparison Oregon from other states and makes no allowance for when fentanyl arrived. We read the abstract, not the full paper.
- Northwest Natural Holding Company. Form 10-K for fiscal year 2020. Annual report filed with the Securities and Exchange Commission in February 2021. States that NW Natural began a 20-year lease in March 2020 for a new corporate operations center in Portland.. Retrieved 2026-11-16. The Securities and Exchange Commission's website refused our automated check of this link on November 16, 2026, and no Internet Archive copy exists. Our saved copy was retrieved from this address the same day.
- officeinsight. Bright Colors and Geometric Shapes Inspire New KinderCare Headquarters Designed by LRS Architects. officeinsight, July 30, 2022. The architect's announcement of the new headquarters off Kruse Way in Lake Oswego. The words come from the architect, and no statement from KinderCare was found.. Retrieved 2026-11-16.
- OPB. Intel will cut another 669 workers in Oregon by the end of 2025. Report of November 13, 2025: Intel employed about 23,000 people in Oregon at its peak and about 18,000 after several rounds of layoffs.. Retrieved 2026-11-15.
- OPB. Jo Ann Hardesty Resurrected Local NAACP, With Scant Attention To Fiscal Oversight. Report of 2018 on the finances of the Portland branch of the NAACP.. Retrieved 2026-11-15.
- OPB. Report on the Montavilla Neighborhood Association election. Report on a contested neighborhood association election in 2017 after a dispute over removing homeless camps.. Retrieved 2026-11-15.
- OPB and NPR, published by KPBS. Multnomah County DA: Most Portland Protesters Won't Face Charges. Report of August 11, 2020 on the district attorney's policy of not charging offenses tied only to protest activity, such as interfering with police, disorderly conduct and criminal trespass.. Retrieved 2026-11-15.
- Oregon Business. Future of Work: 'I Would Like to Have the Option to Return to Downtown Portland'. Oregon Business, December 21, 2020. Interview with the chief executive of The Standard on sending more than 3,000 employees home in March 2020 and the company's plans for its downtown buildings.. Retrieved 2026-11-16.
- Oregon Business. Tonkon Torp Announces New Downtown Offices. Oregon Business, May 1, 2024. The law firm's announcement of a move to 61,000 square feet in the Wells Fargo Center after 34 years in its offices; quotes the managing partner. The article does not name the old building.. Retrieved 2026-11-16.
- Oregon Department of Education. Fall Membership Report. Enrollment on the first school day of October, by school district, school years 2019-20 and 2025-26.. Retrieved 2026-11-16. The link downloads the 2025-26 file. The 2019-20 file is at https://www.oregon.gov/ode/reports-and-data/students/Documents/fallmembershipreport_20192020.xlsx.
- Oregon Higher Education Coordinating Commission. 2025 Employees at Public Institutions (report under ORS 350.360). Portland State University table: total employees each fall, 3,833 in 2019, 3,707 in 2020, 3,605 in 2021, 3,635 in 2022 and 3,602 in 2023. Student employees are counted separately.. Retrieved 2026-11-16.
- Oregon Higher Education Coordinating Commission. Worker Adjustment and Retraining Notification (WARN) notices. Layoff notices that employers file with the State, including Nike's of April 19, 2024 and Intel's of October 15, 2024, July 7, 2025 and November 13, 2025.. Retrieved 2026-11-16. The link opens the State's list of notices.
- Oregon Judicial Department. Measure 110 Class E Violations, through August 31, 2024. Cases filed for the possession violation that Measure 110 created, and how they ended.. Retrieved 2026-11-15.
- Oregon Judicial Department. State Trial Courts, Cases Filed, 2018 to 2025. Felony and misdemeanor cases filed in circuit court each year, by county.. Retrieved 2026-11-15. The link opens the department's reports page. One year's table opens at an address such as https://www.courts.oregon.gov/about/Documents/2023_CasesFiled.pdf.
- Oregon Judicial Department. State Trial Courts, Cases Filed, 2024 and 2025. County block for Multnomah, Washington and Clackamas; rows Felony and Misdemeanor; annual total column.. Retrieved November 17, 2026.
- Oregon Legislative Assembly. House Bill 4002, 2024 Regular Session (Oregon Laws 2024, chapter 70). Possession of small amounts of drugs becomes a misdemeanor again from September 1, 2024.. Retrieved 2026-11-15.
- Oregon Public Broadcasting. Delta variant delays return of downtown Portland office workers. Oregon Public Broadcasting, August 6, 2021. U.S. Bank and The Standard postpone their planned returns to the office; a spokesperson for The Standard is quoted.. Retrieved 2026-11-16.
- Oregon Public Broadcasting. Portland Mayor Keith Wilson mandates in-person work for all city managers beginning in April. Oregon Public Broadcasting, January 14, 2025. About 700 managers and supervisors ordered to work in person full time; quotes the mayor's email to managers.. Retrieved 2026-11-16.
- Oregon Public Broadcasting. Portland Mayor Ted Wheeler wants to reduce remote work for city employees. Oregon Public Broadcasting, December 7, 2022. Carries the mayor's prepared statement on requiring city office employees to work in person half the time from April 2023.. Retrieved 2026-11-16.
- Oregon Public Broadcasting. PSU begins layoff process for nearly 100 faculty members, more expected. Oregon Public Broadcasting, October 2024. About 100 non-tenure-track faculty received notices of possible layoff; the budget gap was $18 million. Quotes a university spokesperson.. Retrieved 2026-11-16.
- Oregon Semiconductor Competitiveness Task Force. Oregon Semiconductor Competitiveness Task Force Report, August 2022. Industrial land section: table of Portland-area industrial sites of more than 25 acres in 2011, 2014, 2017 and 2022, by readiness tier.. Retrieved 2026-11-08. The task force was chaired by a U.S. senator, the governor of Oregon and a utility chief executive, and its members included employers and public agencies. Its report recommends making more industrial land ready, so it is not a neutral source on this point. The copy linked is hosted by the Oregon Business Plan.
- Portland Development Commission. Central City Housing Inventory, 2008. Housing units by district: 22,994 in the Central City, of which 8,155 in the River District.. Retrieved 2026-11-15. The copy linked is held by the University of Oregon library.
- Portland Housing Bureau. 18-Month Review of the Inclusionary Housing Program. Memo of 2018: an estimated 19,000 homes were vested between March 5, 2016 and February 1, 2017, before the requirement applied.. Retrieved 2026-11-15.
- Portland Mercury. DA Mike Schmidt Concedes in Primary Election Marked by Big Spending, Progressive Upsets. Report of May 2024 on the result of the Multnomah County district attorney election.. Retrieved 2026-11-15.
- Portland Mercury. In Search of Equal Representation, Portland Looks Beyond Neighborhood Associations. Report of August 1, 2019 on the dispute over rewriting the City code that recognizes neighborhood associations.. Retrieved 2026-11-15.
- Portland Police Bureau. Dispatched Calls for Service open data, 2026 (updated after the 5th of each month). Calls classed as high priority with a recorded response time. Retrieved November 17, 2026.
- Portland Police Bureau. Police Dispatched Calls, open data. Dispatched calls by priority and month, 2016 to 2025, with the time from a call being received to an officer arriving.. Retrieved 2026-11-15. The link opens the bureau's dashboard, from which the yearly files download.
- Portland Police Bureau. Police Staffing Numbers (PPB Sworn Staffing Report). Tables "Current PPB sworn staffing" and "Authorized positions, current staffing and vacancies".. Retrieved November 17, 2026.
- Portland Police Bureau. Police Staffing Numbers, open data. Filled sworn positions by month. Used for the City's own count of officers in July 2020 and July 2022.. Retrieved 2026-11-15.
- Portland Police Bureau. Reported Crime Data, open data. Offense files by year, 2015 to 2025, one row per reported offense with its category and date.. Retrieved 2026-11-15.
- Portland Police Bureau. Reported crime open data, offense file for 2026. Rows with OffenseType in murder and non-negligent manslaughter, rape, robbery, aggravated assault; OffenseCount summed by ReportMonthYear. Earlier years from the same Bureau files for 2019 to 2025.csv).. Retrieved November 17, 2026.
- Portland Police Bureau, Strategic Services Division. Stops Data Collection: 2022 Annual Report. Driver stops reported by officers each year. With the 2015 to 2025 editions of the same report: 67,792 in 2012, 22,488 in 2017, 33,035 in 2019 and 13,654 in 2022.. Retrieved 2026-11-15. The other years' reports are at the same address with the year changed.
- Portland State University. Human Resources. The university's human resources office, which covers payroll, lists its location as 1600 SW 4th Ave, Suite 109. Retrieved November 16, 2026.. Retrieved 2026-11-16. The page shows today's address. That the university reported its payroll at this address from 2019 to 2024 is inferred.
- Portland Tribune. NW Natural to move downtown. Portland Tribune, October 13, 2017. Reports the company's announcement to employees that it will lease space at 250 SW Taylor St, with the reason it gave.. Retrieved 2026-11-16. The link opens the Internet Archive's copy; the newspaper's original address no longer works.
- Portland Tribune. NW Natural to move out of Old Town headquarters. Portland Tribune, March 21, 2017. Reports that the lease at One Pacific Square ends in 2020 and quotes a company communications manager on what the company is looking for.. Retrieved 2026-11-16. The link opens the Internet Archive's copy; the newspaper's original address no longer works.
- Portland Tribune. U.S. Bank to leave iconic, pink Portland high-rise named after it. Portland Tribune, September 5, 2024. Quotes the bank's press release on its decision not to renew most of its lease in the U.S. Bancorp Tower, and a spokesperson on where staff will go.. Retrieved 2026-11-16.
- Spruha Joshi and colleagues. One-Year Association of Drug Possession Law Change With Fatal Drug Overdose in Oregon and Washington. JAMA Psychiatry, December 2023: finds no statistically significant change in fatal overdose rates after Measure 110 in Oregon or after State v. Blake in Washington.. Retrieved 2026-11-15. Peer reviewed. Funder: none listed in the journal's record. One author works at a Portland service provider whose staff signed a voters' pamphlet argument for the measure. No allowance for when fentanyl arrived. The publisher's page refuses automated requests; we confirmed the article through the journal registry Crossref and read the abstract.
- Steven Mello. More COPS, Less Crime. Conference draft, American Economic Association, 2018: estimates of crimes prevented per officer hired under a 2009 federal grant program.. Retrieved 2026-11-15. A draft; the per-officer figure for violent crime is imprecise. Later published in the Journal of Public Economics.
- Supreme Court of the United States. City of Grants Pass, Oregon v. Johnson, No. 23-175. Decided June 28, 2024: enforcing general camping laws is not cruel and unusual punishment, which ended the limits set by Martin v. Boise.. Retrieved 2026-11-15.
- The Bulletin. New Relic is the latest Oregon tech employer to cut jobs. The Bulletin, August 18, 2022. A report from The Oregonian carried by The Bulletin of Bend. 110 jobs cut company-wide; about 600 employed in downtown Portland before the pandemic, with offices in the U.S. Bancorp Tower.. Retrieved 2026-11-16.
- The Bulletin. Professional firms expand in downtown Portland, capitalizing on tech's exodus. The Bulletin, February 18, 2025. A report from The Oregonian carried by The Bulletin of Bend. Its correction says New Relic has reduced its space but still has an office in the U.S. Bancorp Tower.. Retrieved 2026-11-16.
- The Columbian. New Relic will lay off up to 160 in restructuring. The Columbian, April 6, 2021. A report from The Oregonian carried by The Columbian. Company-wide job cuts; no Portland count.. Retrieved 2026-11-16.
- The Oregonian, republished by Gov1. Portland, Oregon rejects bid to cut $18M more from police. Report of November 2020 on the Council's 3 to 2 vote against a further cut, which states that the June budget involved no layoffs of police staff.. Retrieved 2026-11-15.
- The Registry. Oregon Symphony Takes 10,000 SQFT at the Pacific Center in Portland. The Registry, July 13, 2023. The Symphony moves its administrative and ticket offices to Pacific Center under a seven-year lease starting September 1. Only the opening paragraph is free to read, and it does not name the old address.. Retrieved 2026-11-16.
- The Standard. Get to know The Standard (company About page). The company describes itself as "a remote-first company headquartered in Portland, Oregon." The page is undated; our copy was retrieved on November 16, 2026.. Retrieved 2026-11-16. The link opens the Internet Archive's copy from September 13, 2026, because the company's website refuses automated requests. The page is at https://www.standard.com/get-to-know-standard.
- Tonkon Torp LLP. Tonkon Torp Celebrates Move into New Downtown Offices. The firm's announcement that the move was completed in July 2025.. Retrieved 2026-11-16.
- TriMet Board of Directors. Resolution No. 22-01-02, authorizing a lease for administrative office space at 101 SW Main Street. January 26, 2022. The staff memo from the general manager gives the reasons for leaving Harrison Square for One Main Place: about 95,000 square feet, a lease of 134 months, and a smaller space need because of the agency's telework policy.. Retrieved 2026-11-16.
- TriMet Board of Directors. Resolution No. 24-09-53, authorizing an amendment to the lease at One Main Place. September 25, 2024. The staff memo says staff began working in the building in June 2023, that administrative employees must now work in the office at least three days a week, and that the lease grows to about 118,580 square feet.. Retrieved 2026-11-16.
- U.S. Bureau of Economic Analysis. County and metro area gross domestic product summary, 2001 to 2024 (table CAGDP1). Real gross domestic product for the ten central counties.. Retrieved 2026-11-15. The link downloads a zip with one file per state.
- U.S. Bureau of Economic Analysis. County and metro area personal income summary, 1969 to 2024 (table CAINC1). Line 3, per capita personal income, for Multnomah, Washington, Clackamas, Clark, King, Denver and Salt Lake counties and for the United States.. Retrieved 2026-11-07. The link downloads a zip with one file per state and one for the United States.
- U.S. Bureau of Economic Analysis. Total full-time and part-time employment by industry, counties, 1969 to 2000 (table CAEMP25S). Line 10, total employment (number of jobs, by place of work, proprietors included), for Multnomah, Washington and Clackamas counties in Oregon, Clark County in Washington, seven Denver-area counties and seven Minneapolis-St. Paul-area counties.. Retrieved 2026-11-07. The link downloads a zip with one file per state. This table uses the old industry system (SIC) and ends in 2000.
- U.S. Bureau of Economic Analysis. Total full-time and part-time employment by industry, counties, 2001 to 2022 (table CAEMP25N). Line 10, total employment, for the same counties as the 1969 to 2000 table.. Retrieved 2026-11-07. The link downloads a zip with one file per state. This table uses the current industry system (NAICS). Total employment is defined the same way as in the earlier table. Our saved copy ends in 2022.
- U.S. Bureau of Labor Statistics. Quarterly Census of Employment and Wages, annual averages by area. Annual average employment by industry for the United States and for the counties of the ten metro areas, 2019 to 2025.. Retrieved 2026-11-15. The link downloads the 2025 file for the United States. Change the year and the area code in the address for other files.
- U.S. Bureau of Labor Statistics. Quarterly Census of Employment and Wages, annual averages by area. Annual average employment for Multnomah County (area 41051), 2019 to 2025, by ownership and by industry sector; and for Oregon statewide (41000) and Oregon with county unknown or undefined (41999), 2019 and 2024. Private sector rows are ownership code 5; sectors are the two-digit NAICS rows.. Retrieved 2026-11-16. The link downloads the 2024 file for Multnomah County. Change the year and the area code in the address for the other files. Counts are payroll jobs covered by unemployment insurance, at the worksite the employer reports. 2025 is preliminary.
- U.S. Bureau of Labor Statistics. Quarterly Census of Employment and Wages, annual averages by county and detailed industry. Annual average employment for one county and every industry it has, 2014 to 2025, for the central counties of ten metro areas: Multnomah, King, Denver, Hennepin, Ramsey, Franklin, San Diego, Maricopa, Salt Lake, Travis and Wake. Private employers (ownership 5) at the three-digit and four-digit industry level, and government at all levels. Retrieved 2026-11-18. The link downloads the 2025 file for Multnomah County. Change the year (2014 to 2025) and the five-digit county code in the address to get the other files. Counts are payroll jobs covered by unemployment insurance, at the worksite and in the industry the employer reports. A cell the Bureau withholds to protect an employer is marked N. 2025 is preliminary.
- U.S. Bureau of Labor Statistics. Quarterly Census of Employment and Wages, annual averages by industry. Annual average employment by county and state, 2014 to 2025. Total, all industries, all ownerships (industry 10, ownership 0); and private employment (ownership 5) in manufacturing (1013), trade, transportation and utilities (1021), information (1022), financial activities (1023), professional and business services (1024) and leisure and hospitality (1026).. Retrieved 2026-11-16. The link downloads the 2025 file for all industries. Change the year (2014 to 2025) and the industry code in the address to get the other files. Counts are payroll jobs covered by unemployment insurance, at the worksite the employer reports. 2025 is preliminary.
- U.S. Bureau of Labor Statistics. Quarterly Census of Employment and Wages, County High-Level files. Annual average employment, all ownerships, for the counties of ten metro areas, 2001 to 2025 (files 2001_all_county_high_level.zip to 2025_all_county_high_level.zip). Used for the 2001 to 2007 comparison of central county shares.. Retrieved 2026-11-17. The link downloads the 2025 file. Change the year in two places in the address for earlier years.
- U.S. Bureau of Labor Statistics. Quarterly Census of Employment and Wages, first quarter 2019 and 2026, supersector slices. Private employment in information, financial activities, professional and business services, leisure and hospitality, and manufacturing, third month of the first quarter. Retrieved November 17, 2026.
- U.S. Bureau of Labor Statistics. Quarterly Census of Employment and Wages, first quarter 2019 and 2026; State and Area Employment (CES), series SMU41389000000000001. CES: https://api.bls.gov/publicAPI/v2/timeseries/data/SMU41389000000000001?startyear=2017&endyear=2026 and the Seattle, Denver and Minneapolis series.. Retrieved November 17, 2026.
- U.S. Bureau of Labor Statistics. Quarterly Census of Employment and Wages, first quarter 2019, 2025 and 2026. Total employment, all industries and all owners, third month of the first quarter, for the central counties of the 50 largest metro areas. Retrieved November 17, 2026.
- U.S. Bureau of Labor Statistics; U.S. Census Bureau. QCEW first quarter 2026; LODES8 Oregon workplace files directory. Payroll counts for the first quarter of 2026. Census directory of Oregon block-level job files, where 2024 is the last year. Retrieved November 17, 2026.
- U.S. Census Bureau. American Community Survey 1-year estimates, 2025, tables B25064, B25003 and B25004. Median gross rent (table B25064) and homes vacant for rent as a share of all rental homes (tables B25003 and B25004), by county. Retrieved November 17, 2026.
- U.S. Census Bureau. American Community Survey 1-year estimates, table B08301, Means of Transportation to Work. 2019 and 2024, by county: workers 16 and over (B08301_001E) and those who worked from home (B08301_021E), for the central counties of the 50 largest metros.. Retrieved 2026-11-17. We retrieved the figures from the Census data service, which needs a free access key. The link opens the same table for Multnomah County on data.census.gov. Working from home is measured where people live, not where their employer is.
- U.S. Census Bureau. American Community Survey 1-year estimates, table B08406, Sex of Workers by Means of Transportation to Work for Workplace Geography. 2019 and 2025, for the cities of Portland, Seattle, Denver, Minneapolis and St. Paul: workers whose workplace is in the city (B08406_001E) and those of them who worked from home (B08406_017E).. Retrieved 2026-11-17. We retrieved the figures from the Census data service, which needs a free access key, so that address does not open for a reader. The link opens the same table for Portland on data.census.gov. These are survey estimates with sampling error.
- U.S. Census Bureau. American Community Survey 1-year estimates, tables B07001 (residence one year ago) and B05002 (place of birth). 2010 to 2019, for the ten cities: adults who lived in another state a year earlier, and residents born in another U.S. state.. Retrieved 2026-11-15. We retrieved the figures from the Census data service, which needs a free access key. The link opens the 2016 table for Portland on data.census.gov. These are survey estimates with sampling error.
- U.S. Census Bureau. American Community Survey 1-year estimates, tables B25064 (median gross rent) and B25004 (vacancy status). 2010 to 2024, for the ten central counties and the ten metro areas: median gross rent, and vacant-for-rent units as a share of rental units.. Retrieved 2026-11-15. We retrieved the figures from the Census data service, which needs a free access key. The link opens the rent table for Multnomah County on data.census.gov. No 2020 estimates were published. These are survey estimates with sampling error.
- U.S. Census Bureau. Building Permits Survey, annual files. Housing units authorized by building permits, by county (co2010a.txt to co2025a.txt) and by city for the West Region (we2010a.txt to we2025a.txt): total units and units in buildings of five or more.. Retrieved 2026-11-07. The link opens the folder. County files are under County/ and city files under Place/West Region/.
- U.S. Census Bureau. Building Permits Survey, county year-to-date files, September 2019, 2022, 2024, 2025 and 2026. Units in 1-unit, 2-unit, 3-4 unit and 5+ unit buildings (estimates with imputation columns); rates use the July 1, 2025 population from Vintage 2025.. Retrieved November 17, 2026.
- U.S. Census Bureau. Building Permits Survey, place year-to-date files, West Region, September 2024, 2025 and 2026. Row for Portland, Oregon; 5+ units column; nine months reported in 2025 and 2026.. Retrieved November 17, 2026.
- U.S. Census Bureau. Business Formation Statistics, annual business applications by county. File bfs_county_apps_annual.xlsx: applications for a federal employer identification number, by county and year, 2005 to 2025.. Retrieved 2026-11-08. Most applications are from businesses that will have no employees.
- U.S. Census Bureau. Business Formation Statistics: county annual applications; monthly applications by state. County workbook, years 2005 to 2025; monthly file https://www.census.gov/econ/bfs/csv/bfs_monthly.csv, series BA_BA, TOTAL, not seasonally adjusted (U).. Retrieved November 17, 2026.
- U.S. Census Bureau. City and Town Population Totals, Vintage 2025. File sub-est2025.csv, with the 2010 to 2020 estimates: July 1 population of the ten cities.. Retrieved 2026-11-15. These estimates are revised every year.
- U.S. Census Bureau. County Business Patterns, ZIP Code Business Patterns. Number of business establishments (ESTAB) by ZIP code, all industries, 2010 to 2023, for 26 ZIP codes in Portland and 24 in Washington and Clackamas counties.. Retrieved 2026-11-17. No direct link exists for this set of ZIP codes: we drew them from the Census data service, which needs a free access key. The link opens the Census page where the yearly ZIP code files can be downloaded. The series ends in 2023.
- U.S. Census Bureau. County Business Patterns, ZIP Code Business Patterns: employment and establishments. Mid-March employment (EMP) and number of establishments (ESTAB), all industries, 2017 to 2023, for ZIP codes 97201, 97204, 97205 and 97209 and the other Portland ZIP codes used in the comparison. Private employers only; government is not covered.. Retrieved 2026-11-16. No direct link exists for this set of ZIP codes: we drew them from the Census data service, which needs a free access key. The link opens the Census page where the yearly ZIP code files can be downloaded. The series ends in 2023.
- U.S. Census Bureau. County Population Totals and Components of Change, 2010 to 2020. File co-est2020-alldata.csv: yearly population, net domestic migration and net international migration by county, 2010 to 2020, used for figures before 2020.. Retrieved 2026-11-15. An older edition of the estimates than the 2025 file, so the two series do not join exactly.
- U.S. Census Bureau. County Population Totals and Components of Change, Vintage 2025. File co-est2025-alldata.csv: July 1, 2020 population estimate and yearly natural change, net international migration and net domestic migration, 2021 to 2025, by county.. Retrieved 2026-11-16. County figures for migration from abroad are modeled by the Census Bureau, not counted. These estimates are revised every year.
- U.S. Census Bureau. LEHD Origin-Destination Employment Statistics (LODES), version 8, Workplace Area Characteristics. Oregon and Washington, 2010 to 2024, all jobs (JT00), all workers (S000), by 2020 census block: total jobs (C000) and jobs in each of the 20 industry sectors (CNS01 to CNS20). Files or_wac_S000_JT00_2010.csv.gz to or_wac_S000_JT00_2024.csv.gz and the same for wa.. Retrieved 2026-11-16. The link opens the folder of Oregon files, one per year. The Washington files are at https://lehd.ces.census.gov/data/lodes/LODES8/wa/wac/. A job is counted at the address the employer reports.
- U.S. Census Bureau. LODES version 8 geography crosswalk. Oregon (or_xwalk.csv.gz) and Washington (wa_xwalk.csv.gz): for each 2020 census block, its county (ctyname), its city or place (stplcname) and the latitude and longitude of its internal point (blklatdd, blklondd).. Retrieved 2026-11-16. The link downloads the Oregon file. The Washington file is at https://lehd.ces.census.gov/data/lodes/LODES8/wa/wa_xwalk.csv.gz.
- U.S. Census Bureau. LODES version 8, Workplace Area Characteristics by ownership: private jobs (JT02) and federal jobs (JT04). Oregon, 2010 to 2024, by 2020 census block. Files or_wac_S000_JT02_2010.csv.gz to or_wac_S000_JT02_2024.csv.gz for all private jobs and or_wac_S000_JT04_2010.csv.gz to or_wac_S000_JT04_2024.csv.gz for all federal jobs. State and local government jobs are all jobs less private and federal.. Retrieved 2026-11-16. The link opens the folder of Oregon files. The all-jobs files and the block crosswalk are the sources census-lodes-wac and census-lodes-xwalk in the main source list.
- U.S. Census Bureau. Metropolitan and Micropolitan Statistical Area Population Totals, Vintage 2025. File cbsa-est2025-alldata.csv: the counties in each metropolitan area (July 2023 delineation) and each area's July 1, 2020 population estimate, used to pick the 50 largest metros and list their counties.. Retrieved 2026-11-08.
- U.S. Census Bureau. TIGERweb, 2020 census block outlines. The outline of each 2020 census block, used to find the tax lots that fall inside it.. Retrieved 2026-11-16. The link opens the description of the map layer, which can be queried by block number.
- U.S. Court of Appeals for the Ninth Circuit. Martin v. City of Boise, No. 15-35845. Decided September 4, 2018: a city may not punish people for sleeping outside when no shelter bed is available. The ruling bound the western states of the Ninth Circuit.. Retrieved 2026-11-16.
- U.S. Department of Housing and Urban Development. 2007 to 2025 Point-in-Time Estimates by Continuum of Care. File 2007-2025-PIT-Counts-by-CoC.xlsb: people counted as homeless on one night in January, sheltered and unsheltered, for the count area that covers each of the ten cities and for San Francisco, Oakland and Alameda County, and Sacramento.. Retrieved 2026-11-15. HUD's own address for this file (https://www.huduser.gov/portal/sites/default/files/xls/2007-2025-PIT-Counts-by-CoC.xlsb) did not answer an automated request on November 16, 2026, so the link opens the Internet Archive's copy. Multnomah County ran a full street count only in odd years; HUD repeats the earlier street figure in the years between.
- U.S. Department of Housing and Urban Development; Multnomah County Homeless Services Department. 2007 to 2025 Point-in-Time Counts by CoC; 2025 Tri-County Point-in-Time Count Report (November 4, 2025). HUD file: rows for Portland, Gresham and Multnomah County and the nine comparison areas. County report: the 5,090 people added from its list. Retrieved November 17, 2026.
- University of Toronto School of Cities. Downtown Recovery: recovery by time of week, spring 2023. time_of_week_rankings.csv, columns Recovery_Rate_weekends, Recovery_Rate_weekdays, Recovery_Rate_Working_Hours. Clean & Safe figure: "2025 Foot Traffic in Downtown and Old Town Portland", https://downtownportland.org/?p=6049.. Retrieved November 17, 2026.
- University of Toronto School of Cities. Downtown Recovery: U.S. trends, September to December 2023, 2024 and 2025. File trend_sep_to_dec_agg_only.csv, column agg_norm_distinct; method notes on the U.S. trends page. Second source: Downtown Portland Clean & Safe, "2025 Foot Traffic in Downtown and Old Town Portland", January 22, 2026, https://downtownportland.org/?p=6049.. Retrieved November 17, 2026.
- University of Toronto, School of Cities. Downtown Recovery rankings. File recovery_rankings.csv: visits to each downtown in spring 2023 as a share of spring 2019, measured from mobile phone locations, for 66 downtowns in the United States and Canada.. Retrieved 2026-11-11. The link opens the data file. The project's own charts are at https://downtownrecovery.com/charts/rankings.
- University of Toronto, School of Cities. Downtown Recovery, September to December trend. File trend_sep_to_dec_agg_only.csv: the year-to-year trend in downtown visits after 2023, used for a rough 2025 update.. Retrieved 2026-11-15. This series is measured differently from the 2023 ranking. Joining the two is our approximation.
- University of Toronto, School of Cities. Downtown Recovery, time of week rankings. File time_of_week_rankings.csv: visits in spring 2023 as a share of spring 2019, separately for working hours and weekends.. Retrieved 2026-11-15.
- WARNTracker.com. Kimpton Hotel Monaco Portland layoff, Portland, Oregon, March 2020. A private website that compiles layoff notices filed under the federal WARN Act. Shows a notice filed June 12, 2020 for 147 employees, effective March 13, 2020.. Retrieved 2026-11-16. A secondhand source: the original notice was not seen, and the page does not say whether the layoff was temporary.
- Washington Office of Superintendent of Public Instruction. Report Card Enrollment from 2014-15 to Current Year. District enrollment for Vancouver and Evergreen school districts, school years 2019-20 and 2025-26.. Retrieved 2026-11-17.
- Washington State Legislature. Engrossed Senate Bill 5476, Chapter 311, Laws of 2021. The temporary law passed after State v. Blake: knowing possession became a misdemeanor, with police and prosecutors encouraged to refer people to services.. Retrieved 2026-11-15.
- Washington Supreme Court. State v. Blake, No. 96873-0. Filed February 25, 2021: Washington's felony drug possession law is void.. Retrieved 2026-11-15. The copy linked is hosted by CourtListener.
- Wikipedia. Liberty Centre. Encyclopedia article naming past tenants of the building, citing The Oregonian and the Portland Business Journal. Used only for the statement that KinderCare had its headquarters in the building.. Retrieved 2026-11-16. A secondhand source. Rows that rest on it are marked provisional.
- Wikipedia. Multnomah County Courthouse. Encyclopedia article. Gives the old courthouse's last day as September 29, 2020 and the new courthouse's opening as October 5, 2020, citing The Oregonian of October 4, 2020.. Retrieved 2026-11-16. A secondhand source, used only for the two dates.
- Wikipedia. Pioneer Place. Encyclopedia article. Gives the closing of the J.Crew store as January 22, 2023, citing KOIN television.. Retrieved 2026-11-16. A secondhand source. Rows that rest on it are marked provisional.
- Wikipedia. Pittock Block. Encyclopedia article that lists the Oregon Symphony's administrative offices as a former tenant of the building.. Retrieved 2026-11-16. A secondhand source. Rows that rest on it are marked provisional.
- Willamette Week. 300 City Employees Won't Have to Return to the Office Next Month. Willamette Week, March 25, 2023. City office employees were required at their desks at least 20 hours a week from April 1, 2023; 300 were exempted; 2,950 city employees worked from downtown offices before the pandemic.. Retrieved 2026-11-16.
- Willamette Week. A Virtually Invisible Political Party Reels in a Whopper of a Donation. Report of April 24, 2024, citing state filings: the Working Families Party of Oregon received $340,000 from the national party's committee on April 20, 2024.. Retrieved 2026-11-15.
- Willamette Week. Downtown Foot Traffic Is Up but Office Workers Remain Home, Study Shows (September 23, 2026). Article text, reporting Downtown Portland Clean & Safe figures. Retrieved November 17, 2026.
- Willamette Week. Downtown's Il Solito Reopens Following a Long Pandemic Closure. Willamette Week, November 11, 2022. The restaurant in the Hotel Vintage closed in March 2020 and reopened on November 2, 2022.. Retrieved 2026-11-16.
- Willamette Week. Empty and Unwanted: The Iconic Buildings of Portland's Skyline Are in Trouble. Report of August 16, 2023 by Anthony Effinger on who owned the downtown office towers then in financial distress.. Retrieved 2026-11-07.
- Willamette Week. Former Leaders Say the City Club of Portland Is Pushing Diversity at the Expense of Debate. Report of June 20, 2018 on a dispute between former presidents of the club and its leadership.. Retrieved 2026-11-15.
- Willamette Week. Iconic Commonwealth Building Defaults as Downtown's Real Estate Woes Deepen. Willamette Week, February 21, 2023. Press account of the default; attributes the owner's statement to its chief financial officer.. Retrieved 2026-11-16.
- Willamette Week. Imperial, a Cornerstone of Chef Vitaly Paley's Hotel Restaurant Empire, Has Permanently Closed. Willamette Week, September 29, 2020. Reports the restaurant's closing in the Hotel Lucia and quotes the notice on its website, which gave no reason.. Retrieved 2026-11-16.
- Willamette Week. Liberty Mutual Insurance to End Lease in Lloyd District Building That Bears Its Name and Move to Lake Oswego. Willamette Week, September 15, 2022. Quotes a company spokesman; gives 500 employees in Liberty Centre before the pandemic, 380 working from home only, and a new office for 150.. Retrieved 2026-11-16.
- Willamette Week. Multnomah County Spent Less and Differently Than Planned on Homeless Services Last Year. Report of November 30, 2022, from Joint Office budget data: in the year to June 30, 2022 the office budgeted $52 million from the Metro homeless services tax and spent $36 million.. Retrieved 2026-11-15.
- Willamette Week. Portland's Obscure Human Rights Commission Sparks Anger With Israel-Palestine Vote. Report of October 28, 2015 on the dispute over a City commission's divestment vote.. Retrieved 2026-11-15.
- Willamette Week. Schmidt Continues to Collect Big Campaign Donations, Gaining Ground on Vasquez. Report of May 10, 2024, citing state filings: the sitting district attorney had raised $1.026 million, including $294,937 from the Working Families Party of Oregon and $63,000 from a national drug policy group; his opponent had raised $1.123 million.. Retrieved 2026-11-15.
- Willamette Week. WeWork Closing Downtown Portland Co-Working Space. Willamette Week, December 22, 2023. Says the Portland Business Journal reported in March 2021 that WeWork's 30,000-square-foot space in Pioneer Place had left the company's portfolio.. Retrieved 2026-11-16. Secondhand for the Pioneer Place closing: it reports what another paper reported.
- Zillow Research. Zillow Home Value Index, counties, all homes, middle tier, smoothed and seasonally adjusted. Typical home value in December 2024 for Multnomah, Washington (Oregon), Clark, King, Denver and Salt Lake counties.. Retrieved 2026-11-07. The link downloads the full county file. Zillow is a private company and revises this index.
Methods and limits
How this was done, and what it cannot show
Comparing places shows where Portland is different and cannot prove why. Job counts by block show where jobs were lost and never name the employer.
How it was done
- Before any data was pulled, the popular explanations were written out with what the records would show if each were true and what would count against it.
- Portland is compared with nine cities of similar size and role, with the three most similar (Seattle, Denver and Minneapolis–St. Paul), with the 50 largest metro areas, and with its own suburbs. Every chart says which.
- Jobs are counted where the job is located, from the Census Bureau’s block-level counts and the Bureau of Labor Statistics’ payroll counts.
- A separate review rebuilt the main numbers from the raw files and tried to break each conclusion. Conclusions that failed were removed or downgraded, including an early attempt to divide the decline into percentages that add to 100.
Limits
- Block-level job counts end in 2024. County payroll counts run to March 2026 and show Multnomah County still losing jobs, 2.2% in the year to March 2026. So the records do not yet show the policy changes of 2024 to 2026 working, and they are too recent to show that they have failed.K6U10
- Employers report where their staff work, and the rules for remote staff are loose. Some of the recorded loss may be people who still have their jobs and are now reported at another address.K2
- Downtown is a circle with a radius of 0.75 miles around one point. The block map and table use 1.25 miles.
- Tax-record migration data ends with 2022–23 and gives averages. County immigration figures are modeled estimates.
- Some tests were designed after seeing the data and should be trusted less: the start date of the early slide and the comparison of city against suburbs.
- The companies, officials and organizations named on this page were not asked to respond before publication. We will correct anything shown to be wrong.
The data
Every chart has a link to the numbers behind it. A note on each file is in the data guide.
Related
For the longer history of who owns and runs Portland’s economy, see Did the wealth made in Portland stay in Portland?
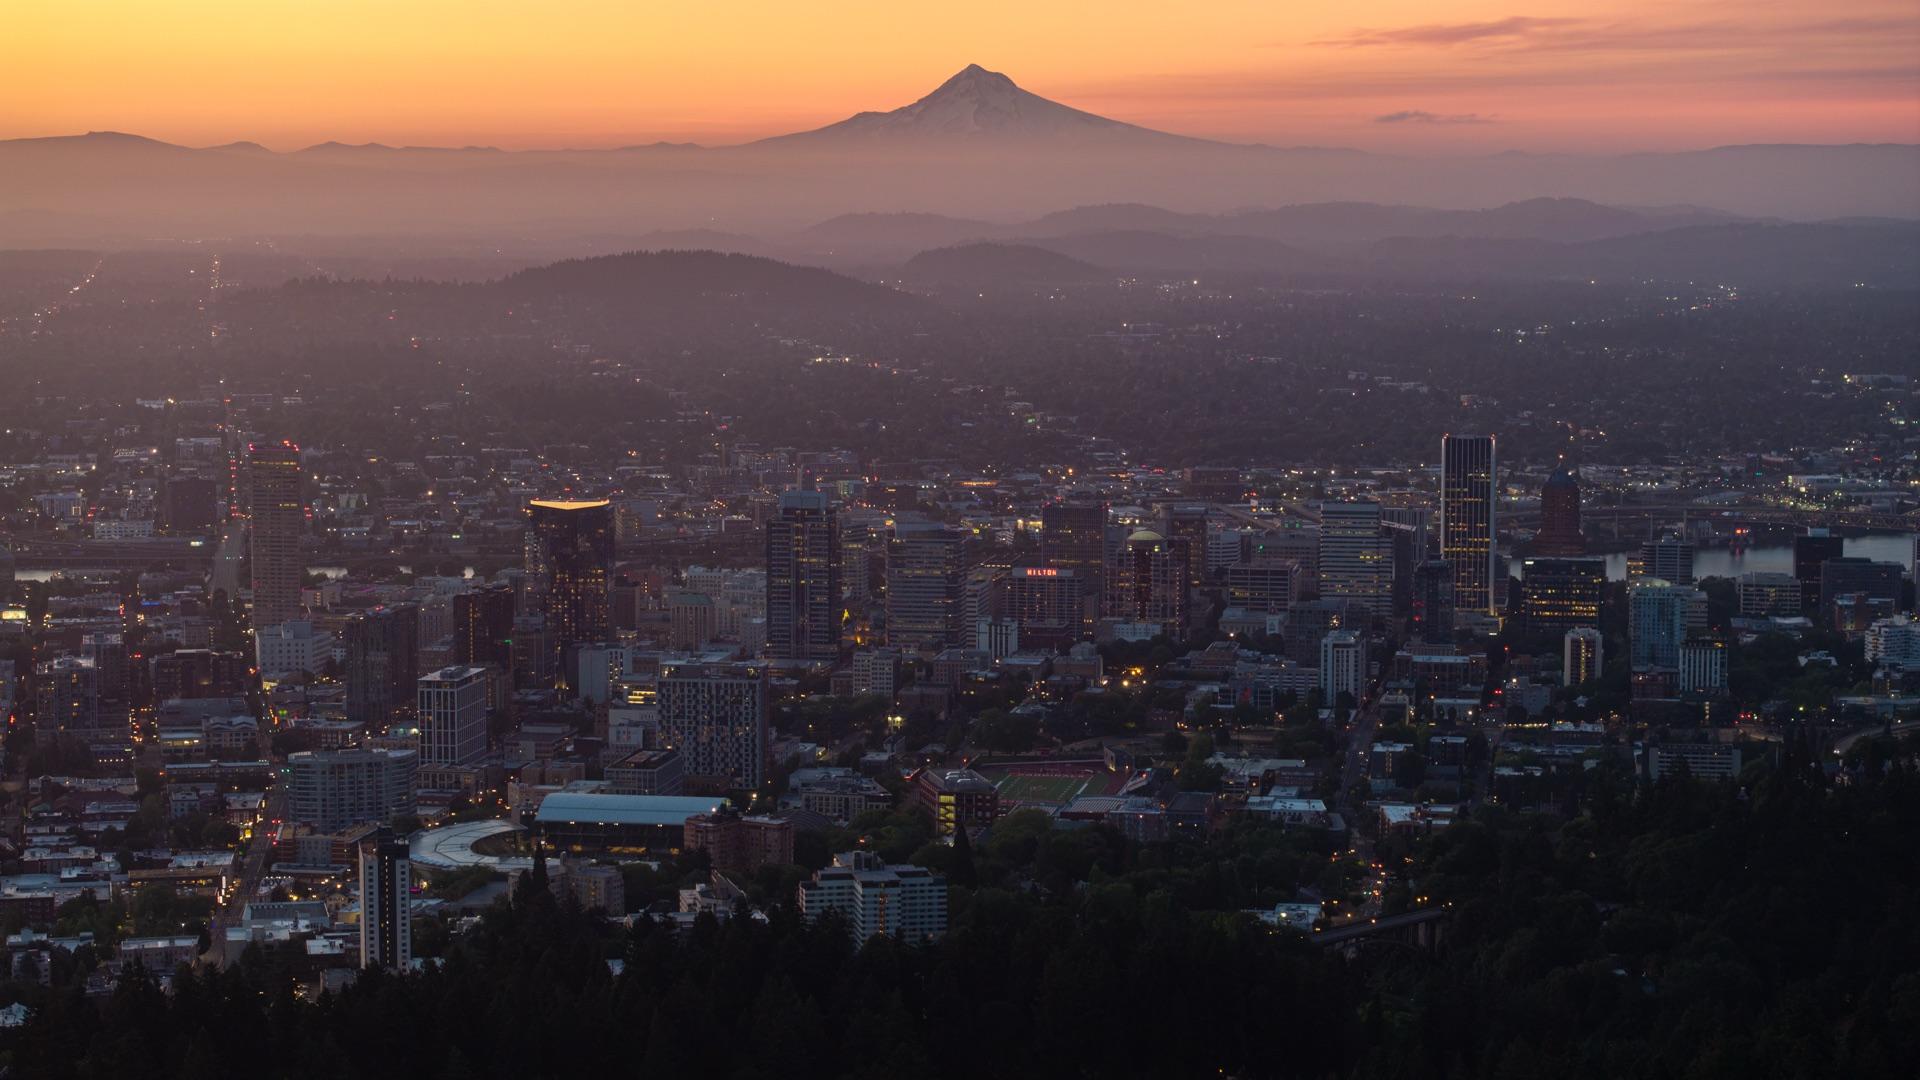
Do you know what happened in one of these buildings?
On the fifteen blocks we searched, we found no public record naming the employer or the destination for 72% of the jobs lost. If you have a lease, a filing, a staff count or a record that fills in one of the fifteen blocks, or that shows this page is wrong, we want to see it.
Work on this with usPhotographs: Downtown Portland and the Willamette from the south, August 2023, Oregon Department of Transportation, CC BY 2.0; The Vista Bridge, downtown Portland and Mount Hood, June 2024, Spicypepper999, CC0; Park Avenue West Tower under construction, November 2014, MojaveNC, CC BY-SA 3.0; New construction beside a bungalow on North Mississippi Avenue, May 2015, Tony Webster, CC BY-SA 2.0; The Ardea and a neighboring tower in the South Waterfront, May 2014, M.O. Stevens, CC BY-SA 3.0; Tilikum Crossing with a MAX train and a bus, September 2015, Steve Morgan, CC BY-SA 4.0; Tents in the Buckman neighborhood, March 2017, Kingofthedead, CC BY-SA 4.0; A MAX train at Pioneer Courthouse Square, July 2018, TriMet, CC BY 4.0; Food carts in downtown Portland, November 2017, Daderot, CC0; An empty SW Broadway, March 27, 2020, Mattsjc, CC BY-SA 4.0; Boarded storefronts at Pioneer Place, June 3, 2020, Another Believer, CC BY-SA 4.0; Protesters at the federal courthouse fence, July 22, 2020, Tedder, CC BY-SA 4.0; The fence around the federal courthouse by day, July 25, 2020, Another Believer, CC BY-SA 4.0; Federal officers outside the federal courthouse, July 26, 2020, U.S. Customs and Border Protection (released under FOIA request 2021-004046), Public domain; Portland Police vehicles outside the Justice Center, December 2025, PortlandAppraisalBlog, CC BY-SA 4.0; The Multnomah County Justice Center, August 2017, Steve Morgan, CC BY-SA 4.0; The U.S. Bancorp Tower from the air, August 2016, Pdx.rollingthunder, CC BY-SA 4.0; SW 2nd Avenue and Pine Street with the U.S. Bancorp Tower behind, January 2025, Steve Morgan, CC BY-SA 4.0; Tents on a sidewalk at NE Halsey Street and 6th Avenue, March 2020, Graywalls, CC BY-SA 4.0; Tents along a street in Old Town, December 27, 2020, Loren Kerns, CC BY 2.0; A tower under construction at SW 10th Avenue, January 2021, Another Believer, CC BY-SA 4.0; SE Spruce Avenue in Ladd's Addition, April 2026, Feedmepaperr, CC BY-SA 4.0; Production buildings at Intel's Ronler Acres campus, March 2018, Steve Morgan, CC BY-SA 4.0; Nike World Headquarters, September 2017, Coolcaesar, CC BY-SA 4.0; The Interstate Bridge from its north approach, July 2021, SounderBruce, CC BY-SA 4.0; Vancouver, Washington, across the Columbia River, June 2024, Spicypepper999, CC0; Vancouver Waterfront Park, April 2026, Another Believer, CC BY-SA 4.0; Portland, Truflip99, CC BY-SA 4.0; Seattle, Joe Mabel, CC BY-SA 4.0; Denver, Spicypepper999, CC0; Minneapolis, Guywelch2000, CC BY 4.0; Columbus, Sixflashphoto, CC BY-SA 4.0; San Diego, Andrewthebobo, CC BY-SA 4.0; Phoenix, Robert693, CC BY-SA 4.0; Salt Lake City, Invictus323, CC BY 4.0; Austin, Ryan Friesen, CC BY-SA 4.0; Raleigh, Abhiram Juvvadi, CC BY-SA 4.0; Portland City Hall from SW 4th Avenue, September 2026, Steve Morgan, CC BY-SA 4.0; Multnomah County Central Courthouse, October 2023, Steve Morgan, CC BY-SA 4.0; Portland and Mount Hood at sunrise, June 2025, Spicypepper999, CC0; Downtown Portland across the Willamette at dusk, July 2017, M.O. Stevens, CC BY-SA 4.0; Standard Plaza, August 2012, M.O. Stevens, CC BY-SA 3.0; The Standard Insurance Center, October 2016, Steve Morgan, CC BY-SA 4.0; Liberty Centre in the Lloyd District, April 2011, M.O. Stevens, CC BY-SA 3.0; The KOIN Center, August 2012, Another Believer, CC BY-SA 3.0; The Congress Center, May 2010, M.O. Stevens, CC BY-SA 3.0; Pioneer Place, July 2017, Michael Barera, CC BY-SA 4.0; The old Multnomah County Courthouse from SW 5th Avenue, October 2018, Steve Morgan, CC BY-SA 4.0; The Portland Building after its renovation, June 2021, Steve Morgan, CC BY-SA 4.0; One Main Place, February 2013, M.O. Stevens, CC BY-SA 3.0; The Commonwealth Building, August 2017, Steve Morgan, CC BY-SA 4.0; The Wells Fargo Center from SW 6th Avenue and Columbia Street, July 2014, Steve Morgan, CC BY-SA 3.0; Portland State University's Market Center Building, January 2014, Visitor7, CC BY-SA 3.0; One Pacific Square, February 2011, M.O. Stevens, CC BY-SA 3.0; The Lloyd District skyline from Pittock Mansion, May 2021, Truflip99, CC BY-SA 4.0; The Portland Transit Mall at SW 5th Avenue and Alder Street, April 2025, Truflip99, CC BY 4.0; Kruse Woods I office building, Lake Oswego, February 2015, M.O. Stevens, CC BY-SA 4.0; The 1100 Compton office building, Hillsboro, March 2016, M.O. Stevens, CC BY-SA 4.0.