
A fire ends. Its effects keep unfolding.
An outline on a map shows the extent of an event. Inside it, some ground may remain unburned, some trees may survive, and other patches may change greatly. Severity assessments help describe that pattern.
Read three layers together: where the fire was, what changed, and what happened later.
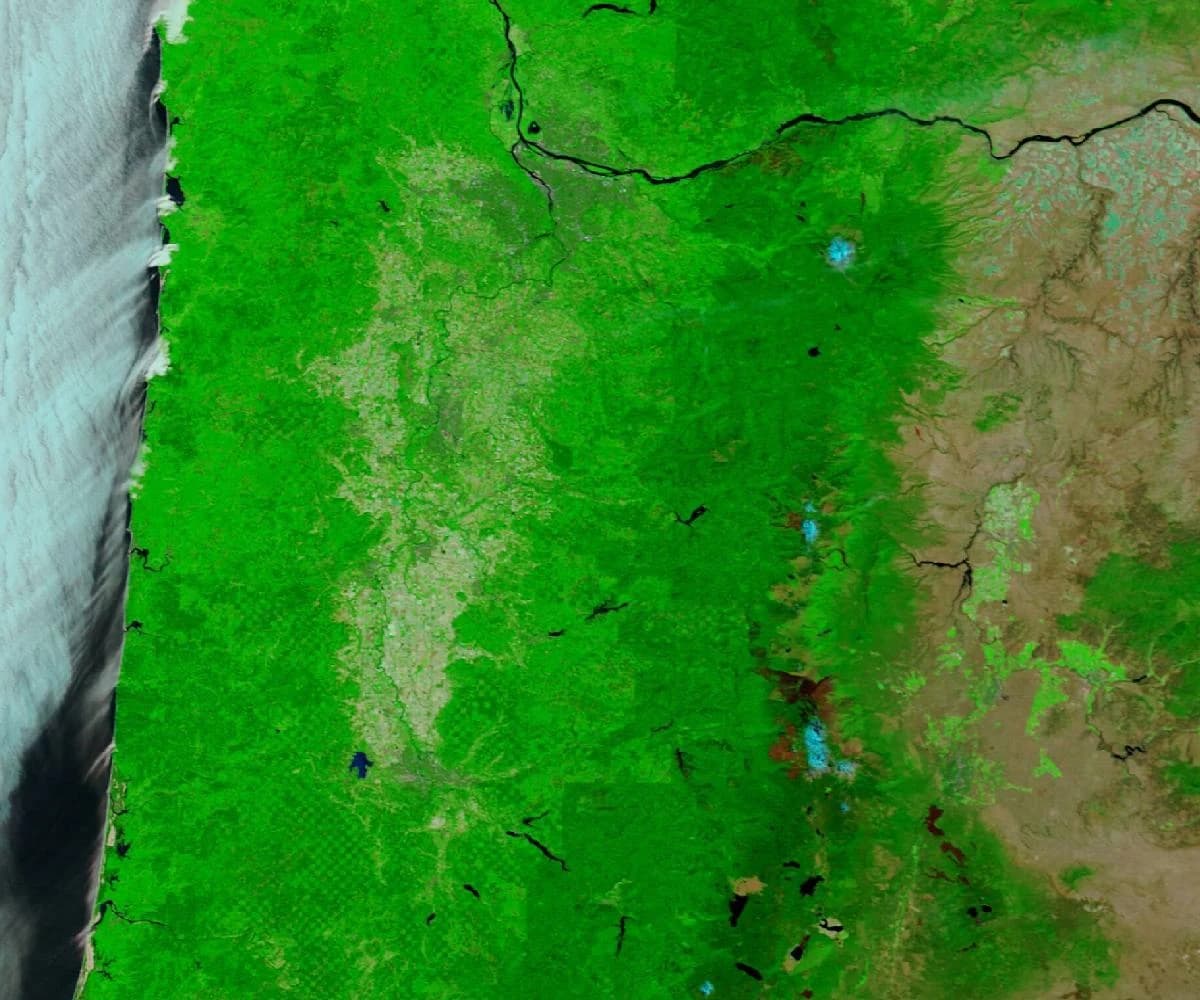 July 19, 2020 / before
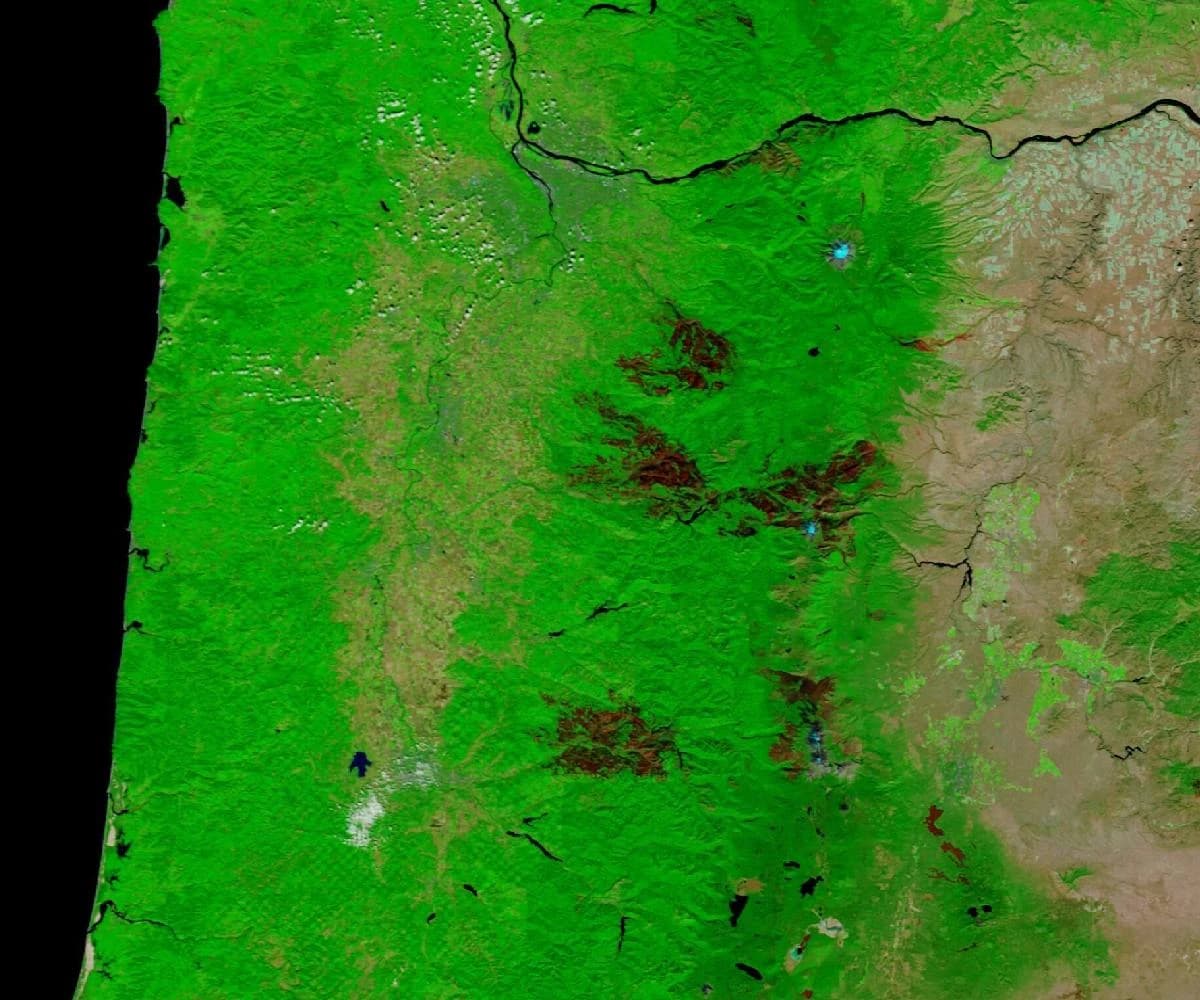 September 27, 2020 / after
Where was the event?
A perimeter may include ground that did not burn.
What changed?
Assessments describe effects using a particular method and date.
What came next?
Field visits show which trees, plants and habitat remain.
A perimeter is a boundary
An incident perimeter outlines an event; it is not a measurement that every acre inside burned. A treatment-unit boundary describes planned or recorded work, which is another kind of geography.
For border-crossing fires, the whole incident’s reported acreage differs from its mapped area within Oregon. Label these separately. Repeated or overlapping events also require care before adding area totals.
Severity describes particular effects
MTBS uses defined satellite assessment methods and maps a subset of larger fires. Coverage thresholds mean many small fires and treatments are absent. Unassessed and unavailable pixels are different from unburned or low-severity pixels.
A severity color alone cannot decide whether an outcome was ecologically desirable. Read its definition, timing and landscape context alongside project objectives and field observations.
Use a common place and dated observations
The main page compares the same western Oregon extent in Terra MODIS imagery before and after the September 2020 fires. False color helps reveal landscape changes; clouds, season and other dark surfaces affect interpretation.
For quantitative summaries, use reviewed source products and appropriate masks and methods. The displayed images are observations, not a calculation of burned acreage or habitat recovery.
Follow more than greenness
Egley’s one- and nine-year field visits examined vegetation and fuels as well as satellite signals. Useful outcome measures can include surviving trees, regeneration, invasive plants and habitat condition, chosen for the site’s objective.
Community outcomes require their own evidence: smoke observations, water-system impacts, damage records or other documented effects. They do not follow automatically from a forest severity map.
Read the evidence
- MTBS · Assessment methods and coverage ↗Severity, mapping thresholds and limitations
- NASA · Oregon’s 2020 fire scars ↗Terra MODIS false-color observation and original explanation
- Dodge and colleagues · Egley Fire Complex study ↗2019; abstract, methods and one-/nine-year field observations. Reported percentage/hectare denominators require clarification