
Why burn this place?
A planned burn can remove small plants and help the trees we want to keep. But where, when, and how it burns make all the difference.
Where the flames go matters.
Dry needles, shrubs, and small trees are fuel: material that can burn. They can connect the forest floor to branches overhead. Breaking some of those connections is one reason to use a planned burn.
Flames have a path upward.
Shrubs and small trees can carry fire into higher branches. These are called ladder fuels.
More space below the crowns.
Removing some small trees and burning surface fuel can reduce that path. Keeping flames low still depends on the conditions.
Less fuel can change the way a fire burns. A treated forest can still burn. The question is how that fire affects trees, habitat, and nearby people.
Does every Oregon forest need this?
No. Dry pine forests, wet coastal forests, oak woodlands, and sagebrush country have different histories and needs. A burn that helps one place may be wrong for another.
Read OSU’s guide to Oregon’s different fire regimes ↗At Woodpecker, the goal was to help particular trees.
In October 2025, OSU students and staff burned two small areas in the McDonald-Dunn Research Forest near Corvallis. They chose the areas for their potential to restore these tree communities:
Give oak and madrone more room.
Reduce competing plants around Oregon white oak and Pacific madrone.
Support valley ponderosa pine.
Use fire in a stand of Willamette Valley ponderosa pine, a tree adapted to fire.
The intended burn would reduce shrubs and small trees while keeping the larger trees. These drawings show the goals; photographs of the actual units still need reuse permission.
Source: OSU’s account of the Woodpecker burns ↗Lighting the fire is one part of the job.
Crews decide what to remove first, which conditions to burn in, and how to protect nearby people and property.
Change the fuel.
Sometimes small trees or shrubs need to be cut before burning. That work has its own costs and effects.
Choose the conditions.
Wind and moisture affect the flames and where smoke travels. A suitable window can be short.
Use a written plan.
Plan the ignition, crews, boundaries, and response if conditions change.
What does prevention buy us?
Spending before a fire may reduce damage later. To judge the value, we need the full cost of the work and a realistic estimate of what changes. A lower price per acre alone cannot tell us the savings.
When could spending now pay off later?
Imagine a project that makes a later wildfire less damaging. Its financial benefit depends on whether that fire reaches the project while the work is still effective.
20% × $10M = $2M
With these assumptions, expected avoided damage is $1M above the cost of the work.
We multiply the chance of a fire by the damage avoided if it happens. This averages possible futures. The actual outcome could be no wildfire, or a fire with a much larger benefit.
What a real comparison would need
Verified costs, local wildfire probabilities, evidence of treatment effects, maintenance schedules, and a common time period. This simple example leaves out the timing of money, treatment risks, smoke, firefighting costs, and ecological benefits. It cannot establish actual savings or whether a specific project is worthwhile.
Research on treatment encounters and possible savings ↗Here is what was reported.
- Before the burn
Students planned; staff contacted neighbors.
Students developed burn plans. Forest staff explained the work to nearby residents.
Two areas were burned.
OSU describes low flames and patchy burning where fuels were damp.
- Follow-up records needed
Check what grew and survived.
We still need repeated measurements to describe lasting changes.
We have OSU’s published account. Exact ignition dates, burned acreage, and verified unit boundaries are still needed.
See the project record →Did the trees and habitat benefit?
To answer that, we need to look beyond the day of the burn.
The burn happened.
OSU describes the work and its initial effects.
How did the trees respond?
We need later measurements of tree survival, competing plants, and habitat.
What did the whole job cost?
We need itemized spending, funding, and future maintenance costs.
What changed in fifty years?
These photographs show Horse Canyon in Canyonlands National Park, Utah—not Woodpecker. They show how the same view can contain different changes.
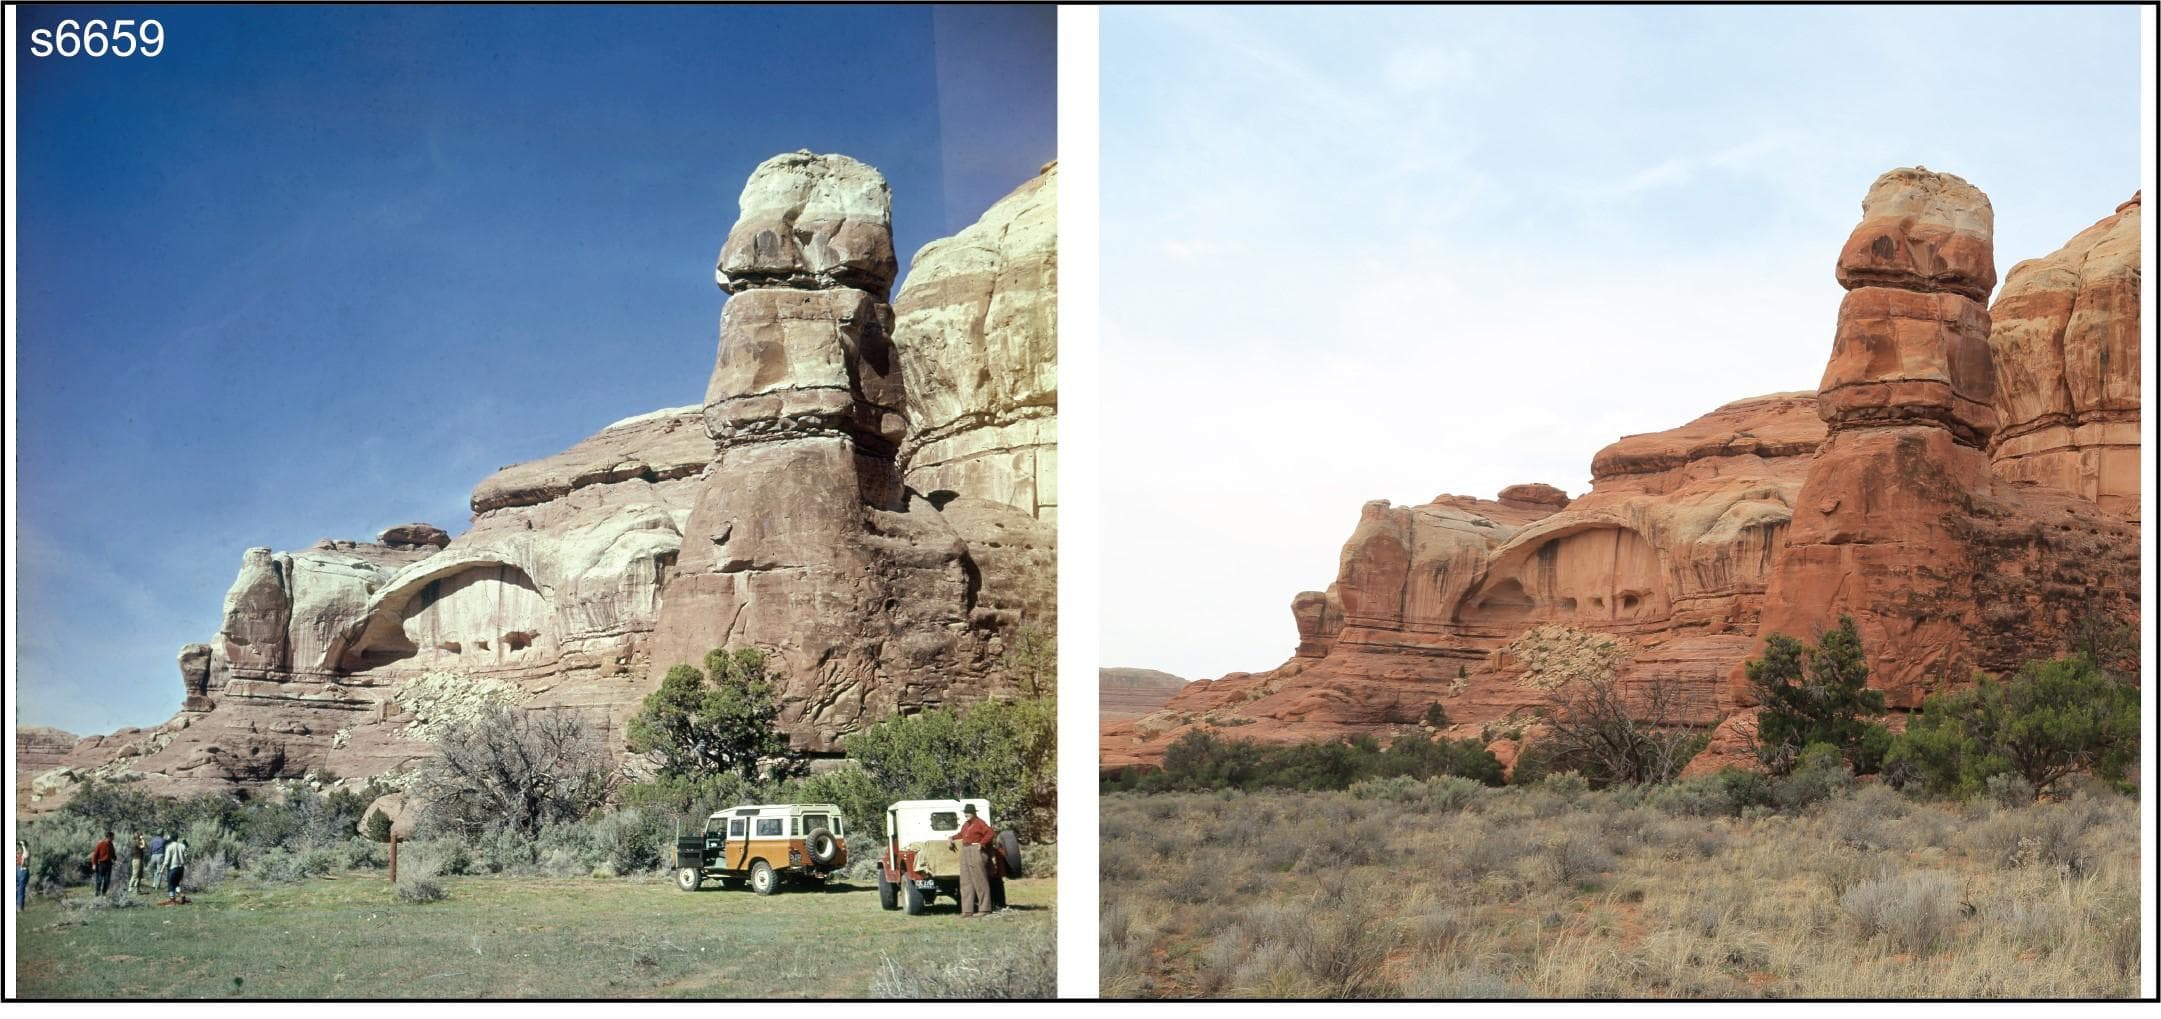
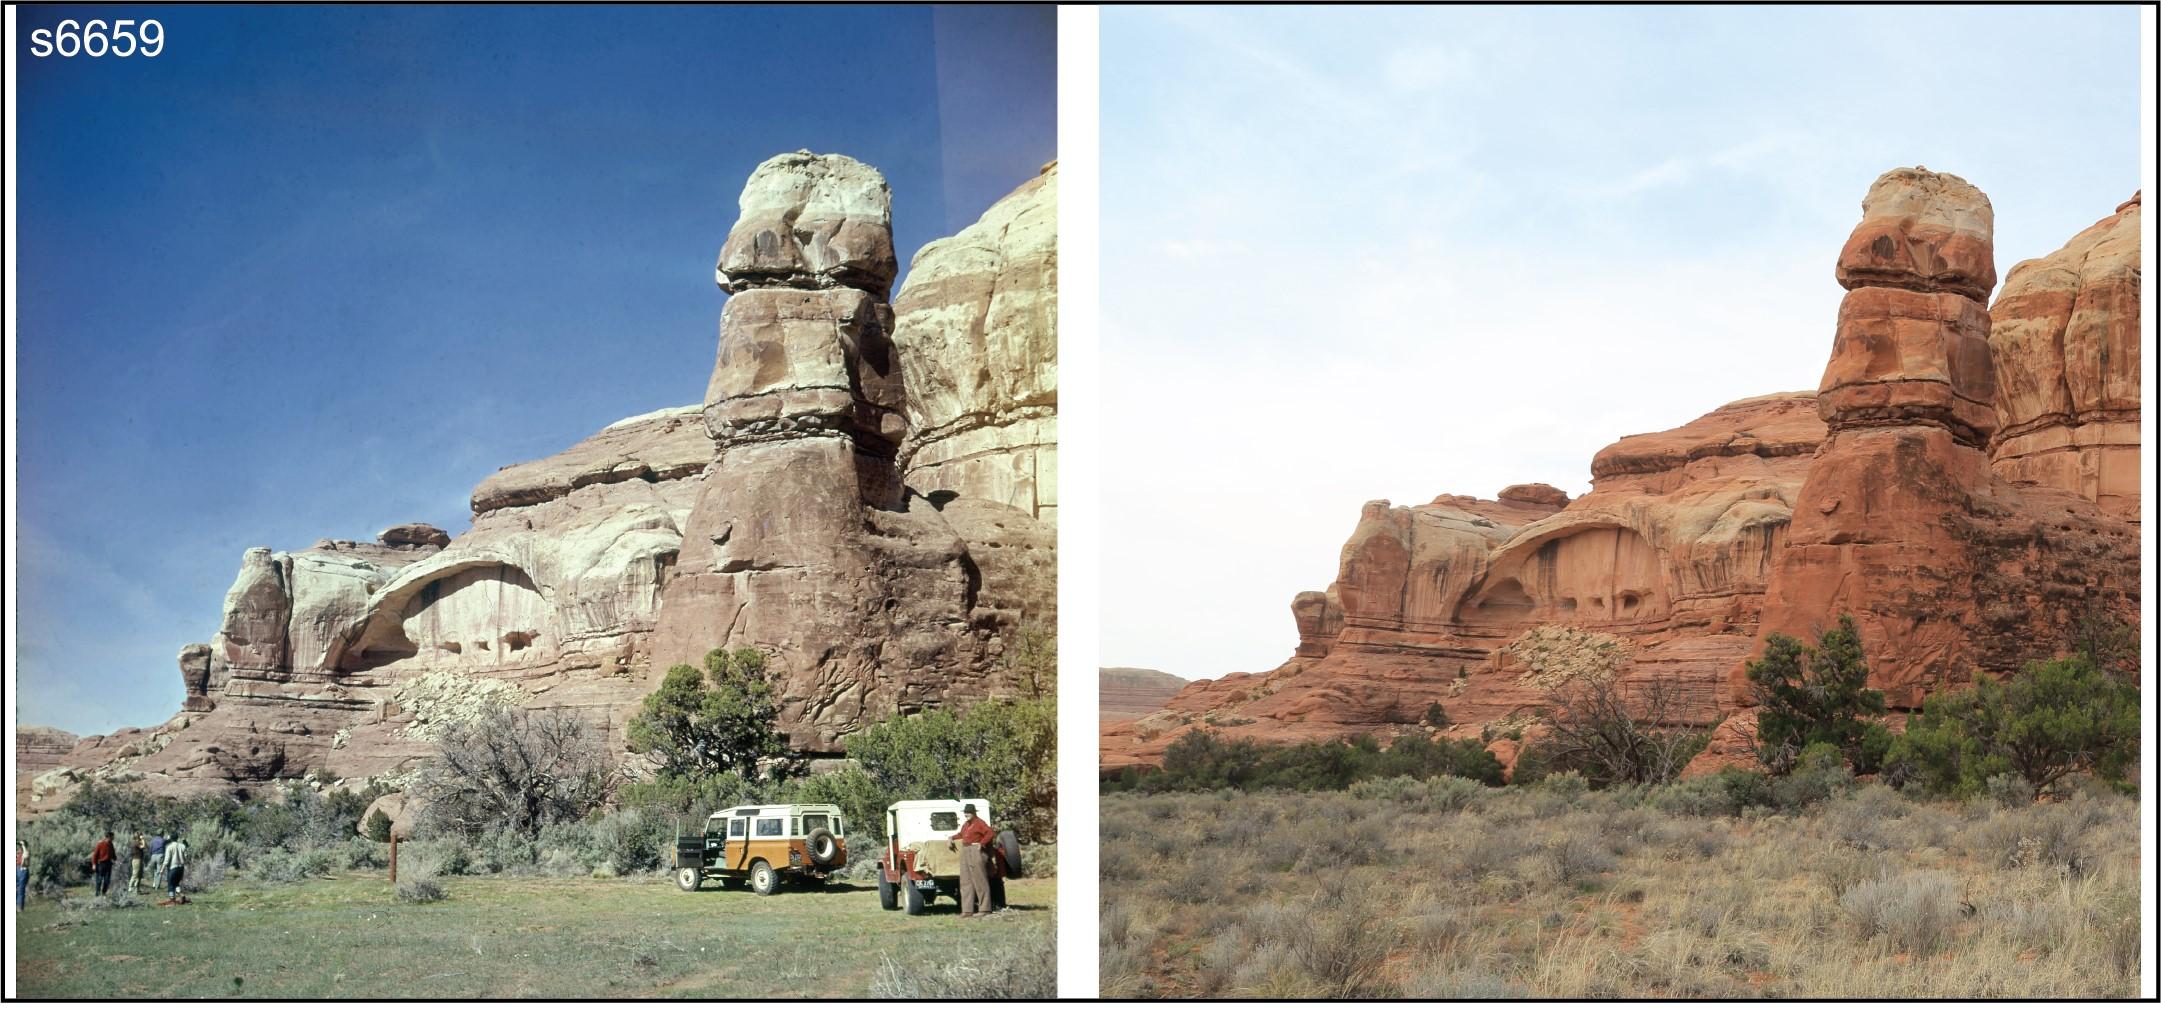
More cover. A larger patch.
Researchers saw a larger grassland patch, with more plants and denser cover.
Woodland cover looked similar.
Researchers recorded no change in woodland cover, plant count, plant size, or patch size. Its position shifted. The grassland patch shifted too.
These descriptions come from comparing the photographs, rather than measuring exact percentages. Sources: USGS data, rows for s6659 and associated study, Figure 4 (page 7).
What the photographs show
The grassland and woodland changed differently. Looking at each part of the view tells us more than calling the whole landscape “greener.”
What they do not establish
A photograph alone cannot tell us the cause. Grazing, climate, soils, and terrain can matter. This pair is not a test of prescribed fire.
Five things to look for in a repeat photograph
- Patch position
- Did the vegetation’s location shift?
- Patch size
- Did its extent expand or contract?
- Plant count
- Are more or fewer individuals visible?
- Plant size
- Do visible individuals look larger or smaller?
- Live plant cover
- Does vegetation look denser or more open?
Camera position, image quality, season, and the years being compared can affect what is visible. Photo interpretation needs supporting measurements and local history.
For Oregon, we need matching photos and measurements.
We need photos of the same place before and after the work, with dates and permission to use them. Then we can compare the visible changes with measurements of trees and habitat.
Contribute a dated Oregon photo pair or supporting record →The USGS release allows reuse of this image under CC0. This example is in Utah.
Public sources checked September 26, 2026. Independent ecological review is still needed.