
Portland Public Assets
The city we rely on.
The evidence behind it.
Streets and pipes. Parks and pools. Fire stations and the systems that keep them running. What does Portland own, what shape is it in, and what will it take to care for it?
See what information is still missingThe big picture
Two large numbers. Two different questions.
The City’s estimates describe the scale of its assets and its projected capital needs. Neither figure, by itself, tells us which repair should happen next.
What would it cost to replace the assets?
Approximately $82 billion in 2025 dollars. This is an estimated replacement value, not the City’s sale value, book value or annual spending.
2025–26 Citywide Assets Report · PDF p. 5How far do projected needs exceed funding?
Approximately $14 billion over ten years, in 2025 dollars. Bureau assumptions differ. This is not an annual deficit or a directly equivalent maintenance backlog.
2025–26 Citywide Assets Report · PDF p. 5Reported means the City published it. Document-verified means the cited record supports the statement. Reproduced would mean the inputs and calculation have been independently checked. The headline estimates and condition chart are not yet independently reproduced here.
What exists?
Identify the asset, its owner and the service it supports.
What do we know?
Check condition, assessment dates, valuation and uncertainty.
What should happen next?
Weigh service needs, failure risk, equity and full lifecycle costs.
Portfolio explorer
One city. Ten different asset stories.
These are the ten programs in the report’s condition chart. Each combines different assets and methods. Open any portfolio to see what is covered, what the report says and what is still needed.
10 of 10 portfolios · Open a portfolio for evidence and gaps.
PBOTTransportationStreets, sidewalks, bridges, signals and streetlights.
The report estimates $22.7 billion in replacement value. Pavement is a major source of poor condition, but condition differs across asset classes.
The appendix excludes the full property inventory, including traffic circles, medians and green spaces, and some bureau equipment.
Asset-class submissions, pavement assessment dates, valuation methods and a reconciliation of included and excluded property.
BESEnvironmental ServicesSewer pipes, pump stations, treatment plants and stormwater facilities.
The narrative places approximately $18.6 billion of BES assets (67%) in fair or better condition. It describes roughly 23% without condition information; the summary chart labels 24% TBD.
The unknown share and the chart/narrative difference need reconciliation before comparisons are treated as precise.
Condition and value tables, unknown-condition treatment, assessment dates and the chart workbook.
WaterWaterWater supply, treatment, storage and distribution assets.
The report estimates $24.2 billion in replacement value and about $1.6 billion in poor or very poor condition.
Condition combines field measurements, failure information and age estimates. Land and rights reported at about $23 million in book value are excluded from the valuation.
Condition methods by class, modeled versus inspected values, valuation assumptions and an exclusions ledger.
ParksParks & RecreationParks, natural areas, pools, community centers, trees and recreation facilities.
The summary chart labels 17% of replacement value in good or very good condition. That is a value-weighted share, not a count of parks.
The appendix says roughly 30% of natural areas have been assessed, with valuation methods still under development.
Facility and natural-area inventories, assessment coverage, replacement-cost methods and updated funding plans for projects examined in the 2025 Parks audit.
ArtsArts & CulturePublic art, the White Stag sign and Portland’5 venues.
The portfolio covers more than its condition chart: the chart represents Portland’5 facilities only.
Public art and the White Stag sign are outside the reported condition breakdown. Keller Auditorium is described as poor.
Separate condition and valuation records for venues, art and the sign, plus clear ownership and maintenance responsibilities.
ProsperProsper PortlandOperating real estate, development property, parking and Union Station.
The condition assessment covers properties held for ongoing operations. The report identifies Union Station as a major rehabilitation need.
Operating properties are not the entire real-estate portfolio. Development and disposition holdings need separate treatment.
An ownership and holding-purpose register, facility assessments and the basis for projected rehabilitation costs.
VenuesSpectator VenuesMajor sports and event venues and associated parking facilities.
The report estimates about $1.2 billion in replacement value. Responsibility for maintenance varies by facility and agreement.
Forecast horizons differ. Garages lack a facility condition assessment or long-term plan; the appendix assigns very low confidence to Moda Center estimates.
Facility assessments, owner/operator obligations and a consistent ten-year capital forecast with agreement assumptions.
FleetFleet & FacilitiesShared City buildings, vehicles and equipment, excluding fire apparatus.
Buildings and vehicles have different maintenance and replacement cycles. The report describes a healthier vehicle fleet alongside aging facilities.
The combined program chart obscures differences between its facility portfolio and fleet. Buildings used by another bureau can sit in this portfolio.
Separate fleet and facility tables, building IDs, tenant/owner responsibilities, maintenance backlogs and funded replacement schedules.
FireFire & RescueFire stations, other operational buildings, apparatus and equipment.
The report describes apparatus as fair or better, while 25% of fire stations and 71% of other operational facilities are poor.
A single program percentage blends equipment and facilities with different service risks and assessment methods.
Separate facility and apparatus records, inspection dates, criticality and replacement schedules.
BTSTechnology ServicesTechnology equipment, infrastructure and intangible assets.
The narrative reports approximately 85% in good or very good condition; the summary chart labels 13% very good and 60% good. These do not reconcile from the published pages alone.
Short useful lives and age-based estimates affect interpretation. The population behind the narrative and chart needs to be identified.
Workbook inputs, category definitions, asset populations and methods for software, hardware and infrastructure.
New evidence · Parks fiscal management audit
A new park also creates a future bill.
The October 2025 audit provides a concrete project-level example of the funding problem. Construction commitments came with future major-maintenance and lifecycle costs for which the sample had no identified funding plans.
A dated, limited sample. Auditors selected eight projects using judgment, rather than a random sample. The findings concern projects active as of January 2025 and cannot be generalized to all Parks projects or the City. Current funding is not established here.
| Project | Estimated annual cost | Funding plan identified |
|---|---|---|
| Creston Skatepark | Not estimated | No |
| North Park Block Extension | Not estimated | No |
| Old Town Skatepark | $825,000 | No |
| University Park | Not estimated | No |
| Conway Slabtown | $400,000 | No |
| Mill Park | $1,057,600 | No |
| Laurelhurst Activation | $40,000 | No |
| Parklane Park | $2,376,000 | No |
| Total of the five available estimates | $4,698,600 | Three costs remain unestimated |
The five amounts add to the audit’s published total. This checks the arithmetic, not the underlying estimates. These are annual cost estimates, not actual spending or construction costs. Do not add them to the citywide ten-year gap; overlap has not been reconciled.
Carry the future costs into the budget.
FIN 2.03 requires cost estimates when a new asset enters capital planning or the requested budget, and a funding plan in the adopted budget. FIN 2.03.02 also requires updated operations and maintenance estimates in construction or acquisition ordinances.
FIN 2.03 · Capital Improvement Plans FIN 2.03.02 · Contract OrdinanceA response is not completion evidence.
Parks agreed with the recommendations. For recommendation 5, its October 10, 2025 response set a December 31, 2025 target to communicate funding needs and alternatives for Council. The response emphasized Council’s funding authority.
Communicating options, adopting a funding plan and appropriating money are distinct steps. The response alone does not establish which occurred.
Recommendation 5 response · PDF p. 5The published response contains specific dates to check
Public webpage describing cost-saving actions
Management response · PDF p. 4Transparent communication of new-project funding needs and funding alternatives for Council
Management response · PDF p. 5Long-range financial and service-level planning, with aligned investment proposals
Management response · PDF p. 3These are management’s stated targets, not verified completion dates. Evidence of implementation and any revised schedule remains needed; a past target alone does not prove that the action was missed.
Audit work papers reviewed · November 1, 2026
More detail about the estimates and the missing plans.
The funding review and September 2024 interview preserve the auditor’s evidence, questions and working notes. They add context to the final audit; they are not a current financial ledger. Audit Services does not endorse this analysis.
Five projects appeared in an operating-cost forecast.
The review’s final O&M section identifies five projects in the “Future O&M Requests for Forecast” tab of the financial plan used in the budget. Mill, Laurelhurst and Parklane were not identified in that tab.
The auditor could not establish inclusion at each project’s initial approval. A forecast entry does not establish an appropriation or a funded major-maintenance and replacement plan. The later section matters: the work paper’s earlier tables alone would omit this evidence.
Three percent, plus a replacement allowance.
The notes use 3% of project budget each year for major maintenance, plus budget divided by 20 years for replacement. Old Town uses 40 years. Recalculating those formulas reproduces the final audit’s five annual totals.
The auditor questioned whether the amounts were sufficient and why the useful lives differed. These checks establish arithmetic, not the accuracy of costs or the suitability of the assumptions.
What the work paper suggests about the 86% condition figure
The model screenshots show 14% good or very good, 51% fair and 35% bad or very bad. Adding fair to bad or very bad gives 86%. The chart legend calls the orange category Fair, while the interview notes describe it as poor.
A plausible explanation, awaiting confirmation: the audit’s 86% headline may include the model’s fair category. The underlying workbook, category mapping, population and weighting are still needed. This does not establish comparability with the later citywide figure of 37%, or a change in physical condition.
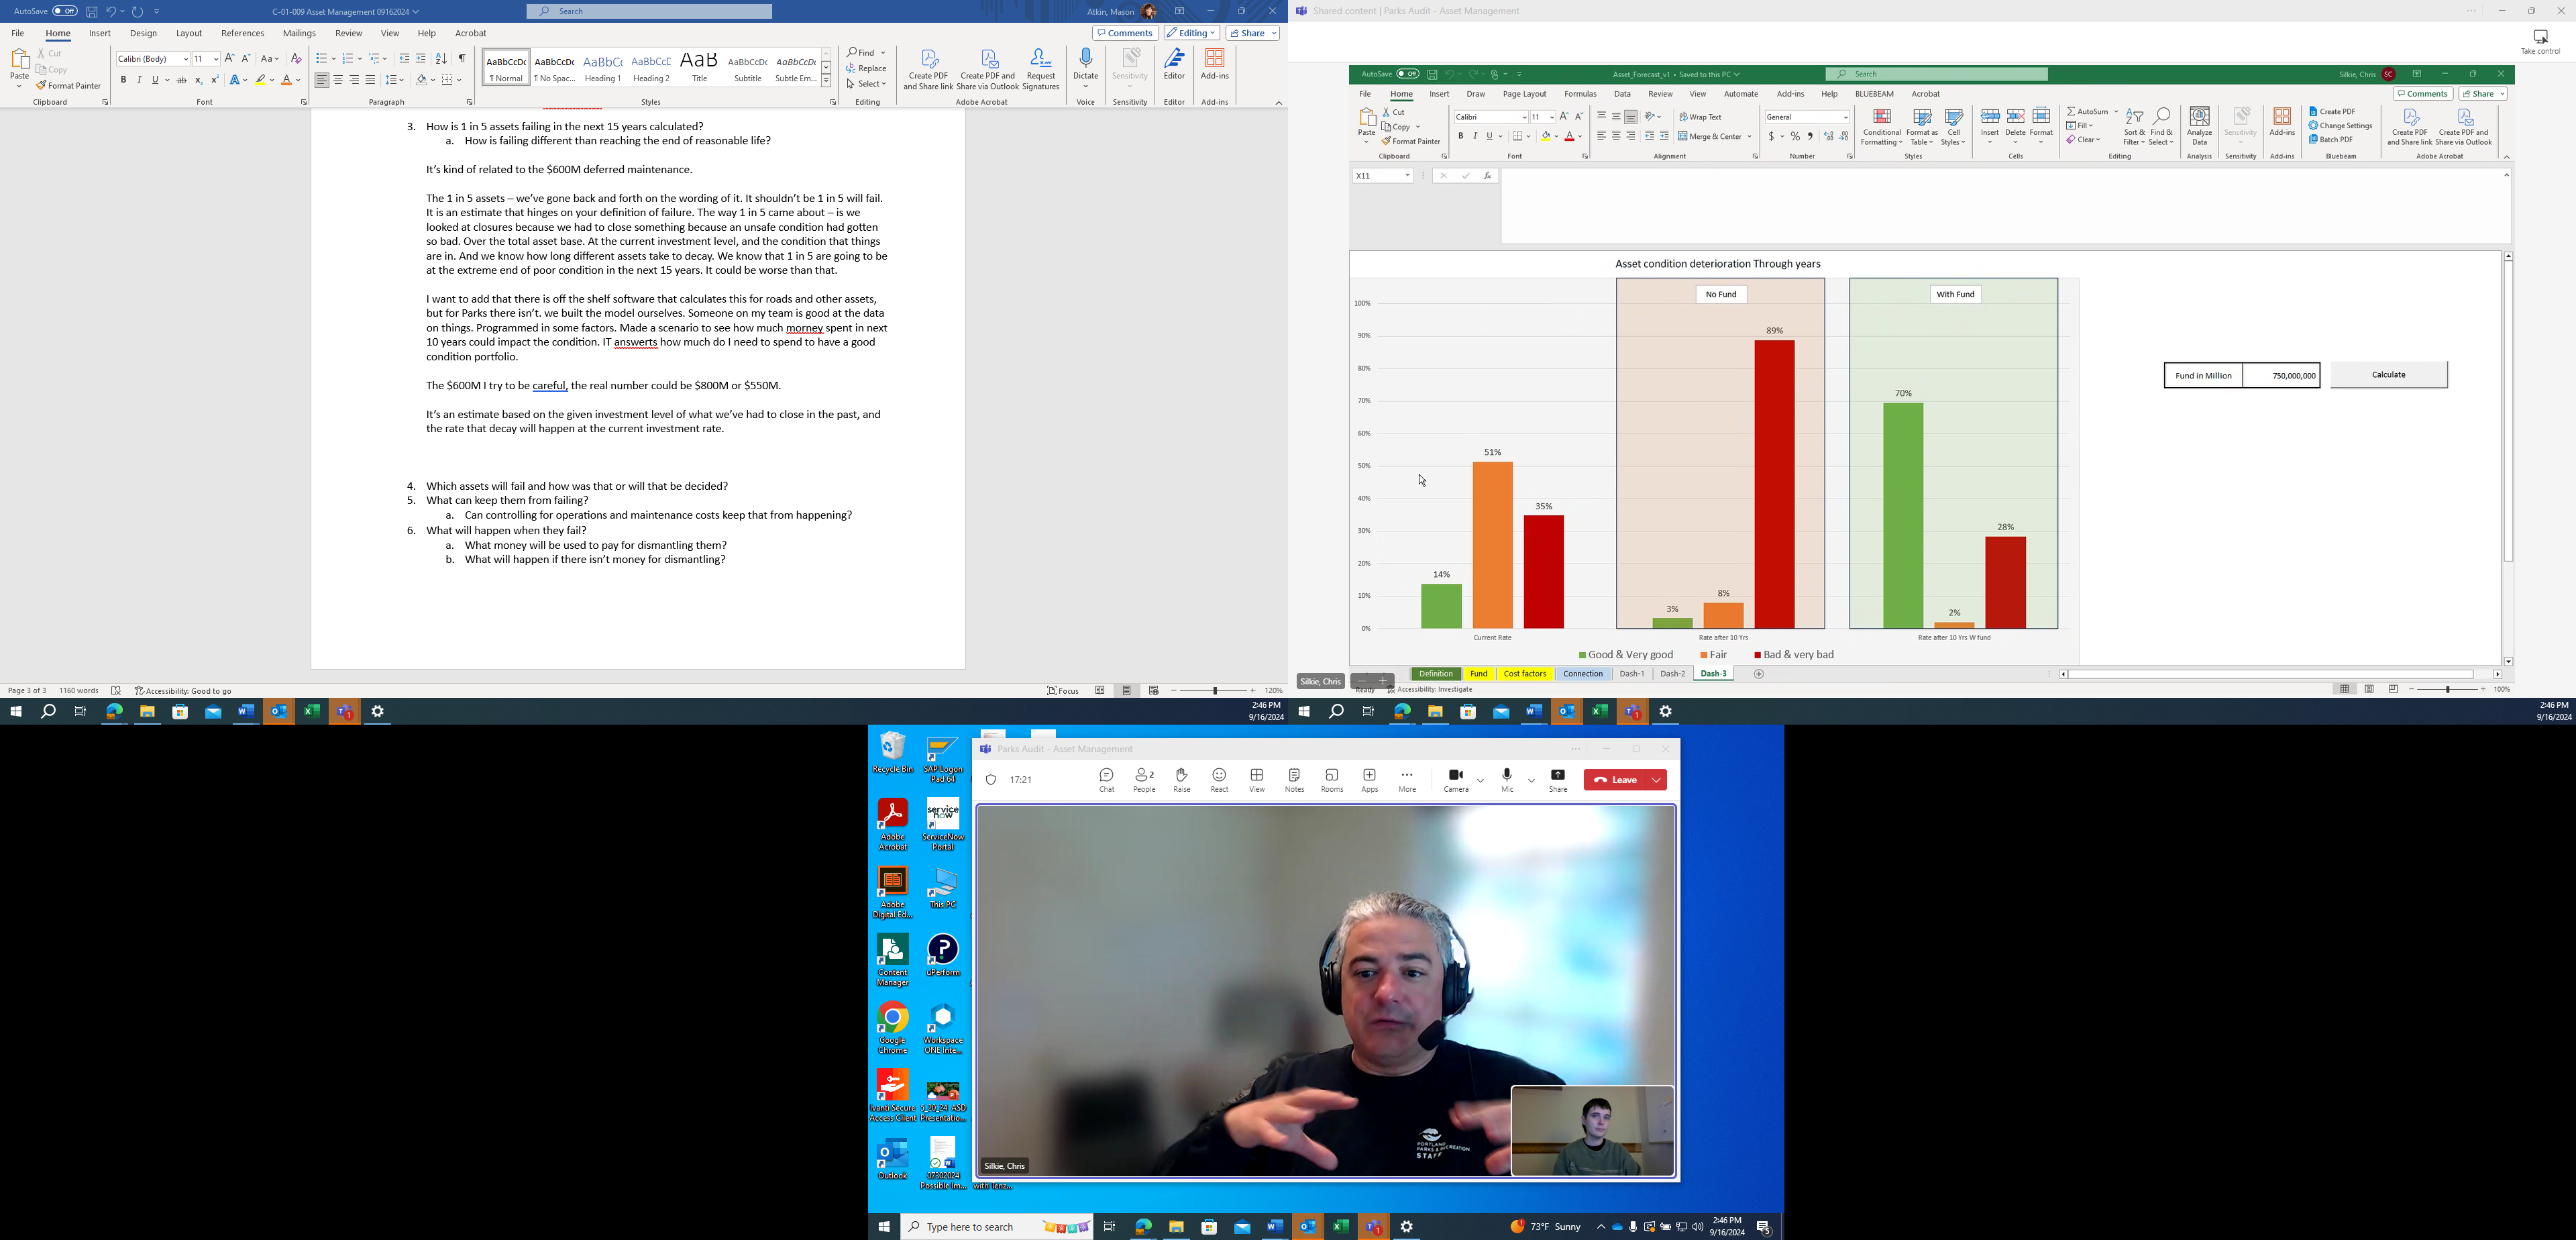
The interview describes an internally built Excel model, Asset_Forecast_v1. Screenshot 3 shows asset condition, replacement cost, failure consequence, risk and useful-life fields. Those inputs offer a specific route to checking the calculation.
Two work-paper differences now checked against the finance workbook
Mill Park: the finance response confirms $396,600 for annual major maintenance and $661,000 for replacement, totaling $1,057,600 as in the final audit. The work paper’s $396,000 remains preserved as the originally reported value.
Parklane: the finance response confirms $1,485,000 for annual replacement. This agrees with the work-paper table and $29.7 million divided by 20 years. A later work-paper note says $661,000; that conflicting text is preserved without treating it as the confirmed estimate.
These are source-confirmed historical estimates. Their sufficiency and current funding remain unverified.
Finance response · MasonsRequest H25:I25 and H27:I27Underlying funding files received · November 3, 2026
From cost estimates to funded budgets.
The released finance workbooks, approval records and historical budgets let us trace the estimates further. They show different amounts in project worksheets and the future-request list. The connection to current funded operating and lifecycle costs is still missing.
The five future-request entries below use 3% of capital costs as rough annual O&M placeholders. The separate finance response contains three detailed estimates and two placeholders. Differences are not a funding gap: price years, scope and service assumptions must first be reconciled. Possible overlap with the separate major-maintenance and replacement estimates must also be checked before adding them together.
| Project | O&M requested for | Future-request list | Finance response | Estimate status and source cells |
|---|---|---|---|---|
| Creston Skatepark | FY2026–27 | $150,0003% placeholder | $96,400 | Detailed estimate; FY27 pricesMasonsRequest A23:J23; O&M Creston Skatepark J74Future O&M Requests for Forecas A3:K3 |
| North Park Block Extension | FY2027–28 | $240,0003% placeholder | $292,997 | Detailed estimate; FY28 pricesMasonsRequest A28:J28; O&M North Park Blocks J74Future O&M Requests for Forecas A12:K12 |
| Old Town Skatepark | FY2029–30 | $450,0003% placeholder | $869,702 | March 2025 discussion draft; FY30 pricesMasonsRequest A26:J26; O&M Old Town Skatepark J74Future O&M Requests for Forecas A36:K36 |
| University Park | FY2029–30 | $54,0003% placeholder | $96,000 | Placeholder; no detailed worksheetMasonsRequest A21:J21Future O&M Requests for Forecas A38:K38 |
| Conway Slabtown | FY2028–29 | $150,0003% placeholder | $150,000 | Placeholder; no detailed worksheetMasonsRequest A22:J22Future O&M Requests for Forecas A15:K15 |
Mill, Parklane and Laurelhurst are absent from this future-additions tab. That does not establish whether earlier operating costs were included in the base budget. See the eight-project comparison and its historical versions.
What the worksheets explain, and what still needs an answer
Old Town: ranger staffing is the largest component.
The March 2025 discussion draft includes four ranger positions costing $541,494, about 62% of the $869,702 FY30 estimate. The sheet says manager and elected-official review is pending. An earlier November 2023 approval record lists $300,000; the future-request list uses $450,000.
O&M Old Town Skatepark · A40:J74Earlier approval · preliminary O&M columnCreston: the reduction is visible; its reason is not.
The $96,400 total includes a $25,000 downward adjustment to the plaza component. The worksheet reproduces the amount, but does not explain the adjustment.
O&M Creston Skatepark · H57:J74North Park Blocks: rate years explain two versions.
The older $241,057 template uses FY2021–22 unit rates despite displaying inflation columns. The $292,997 version uses identical amenity counts, higher base rates and two 4.1% inflation steps to FY28. The separate $260,479 January 2020 estimate still needs its assumptions.
Older O&M Worksheet · B46:H74O&M North Park Blocks · B46:J74January 2020 approval · row 5University: three placeholders, no detailed worksheet.
The records give $54,000, $96,000 and $150,000. A March 18, 2025 email says the project scope was not yet known and no O&M allocations had been discussed. The different amounts remain unresolved.
Audit-file email · labelled reading excerptWork-paper University section · $150,000Parklane: a later garden calculation sits outside the total.
The main $706,365 estimate includes $21,808 for the community garden. An October 2023 note instead calculates $36,740 using square footage, below the main total. The file does not establish which version reached the budget.
O&M Parklane · H55, H74 and A77:H87Laurelhurst: a project-ID conflict needs correction.
The finance response identifies Laurelhurst Oak Street as P00922. The FY2023–24 requested budget identifies it as P00920 and assigns P00922 to O’Bryant Square. No budget amount is assigned to Laurelhurst here using that conflicting ID.
MasonsRequest · D24Budget project list · PDF p. 95 / printed p. 92The six detailed O&M totals were reproduced from saved unit costs, counts, inflation assumptions and adjustments. External rate workbooks were not refreshed. This checks arithmetic, not the accuracy of the inputs or adequacy of the services.
Trace Mill Park and Parklane’s capital approvals
Each step below adds a capital allocation. These are historical approvals, not annual operating appropriations, current project costs or actual spending.
Mill Park · $13.22m documented allocation
- January 2020$6.5m
$6.5m cumulative
Approval · PDF p. 1 - January 2021+$3.9m
$10.4m cumulative
Approval · PDF p. 1 - May 26, 2023+$2.82m
$13.22m cumulative
Approval · PDF p. 2
Development allocations only; the separate acquisition request is excluded.
Parklane Park · $29.7m documented allocation
- February 2016$6m
$6m cumulative
Approval · PDF p. 1 - July 30, 2018+$10m
$16m cumulative
Approval · PDF p. 2 - January 2022+$8.4m
$24.4m cumulative
Approval · PDF p. 1 - November 30, 2022+$5.3m
$29.7m cumulative
Approval · PDF p. 2
Related copies of the same approval are counted once. These are capital allocations, not operating appropriations or actual spending.
The January 2022 Parklane list included a preliminary $465,000 O&M estimate. That estimate should remain attached to its approval date rather than silently replaced by a later worksheet.
Which amounts entered the budget?
The FY2025–26 list allocates $588,917 for seven other projects to fund centers and specifies Fund 100, commitment item 549000, for O&M budget entry. The finance response describes entering future major maintenance and replacement under commitment item 563ONG.
These entries provide a route to reconciliation. The files do not establish an adopted appropriation or money placed in a reserve for the eight audited projects.
Pivot Rounded for Budget Entry · A1:D23MasonsRequest · B13:B17Connect each estimate to a funding decision.
For each project, identify the estimate used, price year, in-service date, adopted or base-budget amount, funding source and accounting entry. Show operating, major-maintenance and replacement funding separately, including any unfunded remainder.
The $4,698,600 annual maintenance/replacement estimate is still a historical cost estimate. These files do not establish its current funded or unfunded balance.
Why the broader $9.54 million forecast is not a funding-gap headline
The future-request sheet sums $9,544,823.57 of annual estimates across 34 project rows with different intended start years. It is not five years of spending or all Parks operating costs. Columbia Park P10585 appears twice, at $54,000 in FY2028 and FY2030. Distinct phases or a duplicated placeholder still need to be confirmed.
Future O&M Requests for Forecas · A1:K42, especially rows 13 and 37Now in the collection
- D-02-01-00: PP&R finance response, including six detailed O&M worksheets
- D-02-01-00a: FY2025–26 O&M list and future requests
- Supplied D-02-01 approval files, historical budgets, briefing and scenarios
Still needed
- D-01-01: Summer 2024 A&D work plan underlying reported allocations and spending
- D-02-03-02: complete financial forecast referenced by the O&M list
- Asset_Forecast_v1 with inputs, category definitions and weighting
- Current project spending, adopted/base-budget O&M and major-maintenance/replacement funding reconciliation
Browse the 29 supplied files and their evidence notes
Twenty-eight originals are preserved unchanged; the University email is a labelled text excerpt with message headers and signatures omitted. Related copies with different audit annotations are retained and identified. They are not separate approval events. Audit Services does not endorse this analysis.
- D-02-01-00 2025_PP&R_FinanceResponse
10-sheet finance response: eight-project summary, six detailed O&M worksheets and historical policy excerpts. Documents amounts, assumptions, methodology and project IDs.
- D-02-01-00a List_O&M_FY2025-26
8-sheet O&M list: future placeholders, FY26 allocation data and pivots, reference fund centers. Provides forecast/budget-entry trail, not adoption proof.
- D-02-01-01 2022-12-15 FY23-24 CAPITAL GROWTH LIST OF PROJECTS RECOMMENDED FINAL COMMISSIONER APPROVAL DAL CCR
December 2022 capital-priority list. $5m southeast skatepark allocation; director date 12/16/2022; commissioner date has a printed-year typo.
- D-02-01-02a 2023 North Park Blocks Extension O&M Template - Copy
Standalone North Park Blocks O&M template. $241,056.84 uses FY2021–22 unit costs despite displayed inflation columns.
- D-02-01-02b Commissioner-Director_Funding_Approvals_1.16.2020
January 2020 approval record, highlighted for North Park Blocks: $8m and $260,479 preliminary O&M. Also contains Mill Park. Related copy at 06c.
- D-02-01-02c Broadway-Corridor_Dir_Briefing Memo 2019022
11-page February 2019 Broadway Corridor director briefing, memo and concept maps. Distinguishes adjacent planning projects; not an operating funding plan.
- D-02-01-03 1B. 2023-11-17 CO APPROVED FY 24-25 Central City Growth Projects 11_17_23
November 2023 Central City list: Old Town $15m capital and $300,000 preliminary O&M; property/CIP conditions. Prepared date and filename approval date differ.
- D-02-01-03a Vibrant-Communities-Budget FY25-26
38-page FY2025–26 requested budget excerpt. CIP p.17 identifies Old Town and historical project amounts, including Laurelhurst Prior Years $386,838. Not FY2026–27 adopted funding.
- D-02-01-03b ppr_requested_budget_fy_2023-24-april-update-with-ploc-letter_pms-002
218-page FY2023–24 requested budget, annotated for Old Town search. Project-detail pages and p.95 provide IDs. Related copy at 08 with different annotations.
- D-02-01-04a 1. FY 21-22 Growth Capital Projects Proposed for Director Review 2021-01-14 FINAL CCR 2021.01.29
2021 growth list. $4m citywide basic-amenities allocation does not by itself identify University’s project-specific initial approval. Related Mill-focused copy at 06a.
- D-02-01-04b FW_ O&M University — email excerpt
March 18, 2025 email states University had no O&M estimate because the project scope was not known. This reading excerpt preserves the relevant statements; it is not the original mail chain.
- D-02-01-04c Parks SDC Program - Funding Scenarios_11.13.23 (Presented to CO)
One-page November 2023 SDC funding scenarios. Footnote says $4m basic-amenities allocation could cover University/Columbia projects. Scenario figures are not current appropriations.
- D-02-01-05 SDC Funding Priorities 2.4.16 Commissioner Direction
2016 priority decisions include Conway/Slabtown $2m gap and Parklane $6m; North Park Blocks $3.5m proposal not approved then. Related copy at 07f.
- D-02-01-05a parks-fy-2021-22-requested-budget
206-page FY2021–22 requested budget. Conway $5m, Mill $6.5m and Parklane $16m project descriptions; distinguish total project cost from five-year cash-flow rows.
- D-02-01-06a 1. FY 21-22 Growth Capital Projects Proposed for Director Review 2021-01-14 FINAL CCR 2021.01.29 (002)
2021 growth list highlighted for Mill: $3.9m addition to $6.5m, plus preliminary full-build O&M. Related list at 04a; do not count twice.
- D-02-01-06b 23-02_Mill Park_SDC Funding Request Approval Form_cjc_TL-DAL-CDR
May 2023 Mill request: $2.82m addition to $10.4m, bringing capital allocation to $13.22m. Approvals May 23 and May 26.
- D-02-01-06c Commissioner-Director_Funding_Approvals_1.16.2020
January 2020 list highlighted for Mill: $6.5m allocation. Related copy at 02b; same approval event.
- D-02-01-06d budget-document-2020-21-_-final_w-updates_low-rez
204-page FY2020–21 requested budget. Parklane $16m description; Mill not identified in the capital table. Similar park names elsewhere are not matching projects.
- D-02-01-07a 1. FINAL CO SIGNED Growth Capital Projects FY22_23 Annual Process
January 2022 list: Parklane +$8.4m to prior $16m, preliminary O&M $465,000. Same extracted text as 07e growth list; annotations differ.
- D-02-01-07b Request 22-07_SDC_Funding_Approval_Form_Parklane_cjc tl AL CCR
November 2022 Parklane request/approval: +$5.3m. Commissioner approved November 30. Source phrase “$5,300,000 million” is a unit typo, not a literal trillion-dollar request.
- D-02-01-07c SDC_Funding_Approvals_7.25.2018
2018 scanned funding list: Parklane +$10m to prior $6m; signed approval July 30, 2018. Four PDF pages, last blank.
- D-02-01-07d Funding_Decisions_7.30.18
Related July 2018 decision-list scan. Same Parklane funding event, differently annotated; it does not represent another $10 million allocation. Last page blank.
- D-02-01-07d parks-and-recreation 17-18 requested
184-page FY2017–18 requested budget. Parklane P10446 total $6m; p.50 capital table and p.75 project detail. Playground/loo entries are separate projects.
- D-02-01-07e Growth Capital Projects FY22_23 Annual Process_Cmr Rubio sig
January 2022 list corresponding to 07a, with auditor sticky note. Extracted text is identical; bytes/annotations are not.
- D-02-01-07e fy-2015-16-bureau-requested-budget-parks-and-recreation
150-page FY2015–16 requested budget. Supports historical search context before Parklane’s later allocation; absence of a matching capital row is not evidence of no other park services.
- D-02-01-07f SDC Funding Priorities 2.4.16 Commissioner Direction
2016 priority-decision list corresponding to 05, annotated for Parklane. One approval event; do not double-count.
- D-02-01-08 ppr_requested_budget_fy_2023-24-april-update-with-ploc-letter_pms-002
218-page FY2023–24 requested budget, related to 03b with different audit annotations. Laurelhurst $500k; project ID conflict is material.
- D-02-01-08a PK_Requested Budget FY 2022-23_complete submission
212-page FY2022–23 requested budget. Includes Mill, Conway and Parklane details. The auditor did not identify Laurelhurst Oak St in the searched project table; this does not establish an absence of all park funding.
- D-02-03c fy-2024-25-vibrant-communities-requested-budget-updated
103-page FY2024–25 requested Vibrant Communities budget. Narrative mentions Old Town; capital table does not name it separately. Does not prove its costs were absent from aggregated programs.
Parks source reconciliation · November 3, 2026
Projects, asset condition and budgets describe different things.
Existing public-source extracts held by Portland Parks Atlas help explain the audit. Each has its own date, coverage and unit of measurement. This review uses those preserved files; it is not a new collection from the City.
2,587 project records
The extract contains 1,814 records labelled Open and 773 labelled Close, with project and property identifiers. It contains no cost field.
Close alone does not establish completion. Open alone does not verify a continuing need. Some records concern growth or service changes.
Official backlog workbook1,195 historical cost rows
The estimates published by KGW total $615.7 million. A text-based crosswalk suggests possible links to 941 distinct Open project IDs in the newer extract.
Those links do not establish today’s scope, price or funding. The historical total is not a current backlog estimate and cannot be added to the audit’s annual costs.
KGW’s published project listAsset counts have a different denominator.
Across eight selected asset families, 14,138 of 25,446 records have a usable rating. Of the rated records, 2,113 are poor or very bad (14.9%).
This counts records equally, excludes trees from the calculation and mixes assessment dates. It cannot reproduce the City’s replacement-value-weighted chart. Active and removed records also need a consistent rule.
Official condition layersCompare capital, spending and annual costs for all eight projects
The work paper reports historical allocations, spending by summer 2024 and annual cost estimates. The newly received finance response supplies project IDs matching seven FY 2026–27 adopted capital-project entries. Their historical identities are supported; scope and timing still need care. Laurelhurst has conflicting IDs across sources. Annual budget authority is not spending, total construction costs or proof of funding for future maintenance.
Different dates and measures: do not add these columns or subtract them to calculate a funding gap. Reported spending comes through the work paper; its underlying ledger is not available here. Open a project’s notes below for placeholders, conflicting versions and source qualifications.
| Audited project | Capital allocation reported in work paper | Reported spending by summer 2024 | FY 2026–27 capital budget authority | Annual O&M in finance response | Annual major maintenance + replacement in final audit |
|---|---|---|---|---|---|
| Creston Skatepark | $5,000,000System development charges (SDC) | $298,163 | $3,000,000P10566 · shared historical ID | $96,400Detailed estimate; FY27 prices | Not estimated |
| North Park Block Extension | $8,000,000System development charges (SDC) | $658,491 | $2,000,000P10537 · shared historical ID | $292,997Detailed estimate; FY28 prices | Not estimated |
| Old Town Skatepark | $15,000,000System development charges (SDC)Project label in source note needs confirmation. | $26,781 | $10,000,000P10582 · shared historical ID | $869,702March 2025 discussion draft; FY30 prices | $825,000 |
| University Park | $1,800,000System development charges (SDC)Project label in source note needs confirmation. | $0 | $1,000,000P10586 · shared historical ID | $96,000Placeholder; no detailed worksheetWork paper: $150,000; difference unresolved. | Not estimated |
| Conway Slabtown | $5,000,000System development charges (SDC) | $21,594 | $2,249,999P10457 · shared historical ID | $150,000Placeholder; no detailed worksheet | $400,000 |
| Mill Park | $13,220,000System development charges (SDC) | $7,419,650 | $322,408P10536 · shared historical ID | $531,632Detailed estimate; FY2023–24 prices | $1,057,600 |
| Laurelhurst Activation | $500,000PEMO General Fund | $0Reported zero questioned by auditor. | Unresolved | $43,256Detailed estimate; FY25 prices | $40,000 |
| Parklane Park | $29,700,000System development charges (SDC) | $19,656,640 | $1,532,467P10446 · shared historical ID | $706,365Detailed estimate; FY2023–24 prices | $2,376,000 |
Current position for every project: actual spending to date and funded annual amounts for operations, major maintenance and replacement remain unknown in this collection. The downloaded table preserves those fields as blank, never zero.
Creston Skatepark · estimates, funding evidence and source notes
Finance-response annual components: major maintenance not established; replacement not established. MasonsRequest A23:J23.
Original work-paper components: major maintenance not estimated; replacement not estimated.
Operating forecast: Identified in the later review of the Future O&M Requests for Forecast tab. The received O&M list confirms the five entries and their placeholder amounts. Absence from a future-additions tab is not proof of zero base-budget funding. Read the O&M list.
Budget association: Creston Skatepark. Finance response MasonsRequest A23:J23 identifies P10566, matching the adopted-budget project code. This does not confirm every scope or backlog/property association.. The shared code does not confirm all scope or property links.
- Creston’s $25,000 plaza reduction remains unexplained.
Historical work-paper notes:
- The auditor questioned the date and a $25,000 downward adjustment in the O&M estimate.
Source: D-02-00-01, Creston Skatepark — Verification of cost controls and Notes; spending/allocation notes cite D-01-01, which is not held here. O&M forecast evidence is in the closing “Review of files for O&M project costs” section.
North Park Block Extension · estimates, funding evidence and source notes
Finance-response annual components: major maintenance not established; replacement not established. MasonsRequest A28:J28.
Original work-paper components: major maintenance not estimated; replacement not estimated.
Operating forecast: Identified in the later review of the Future O&M Requests for Forecast tab. The received O&M list confirms the five entries and their placeholder amounts. Absence from a future-additions tab is not proof of zero base-budget funding. Read the O&M list.
Budget association: Northernmost N Park Block Development. Finance response MasonsRequest A28:J28 identifies P10537, matching the adopted-budget project code. This does not confirm every scope or backlog/property association.. The shared code does not confirm all scope or property links.
- The older $241,057 template uses FY2021–22 unit costs. The later template has identical amenity counts, higher base rates and two 4.1% inflation steps.
Historical work-paper notes:
- Other O&M versions are $241,057 (undated) and $260,479 (January 15, 2020). The work paper does not reconcile them.
Source: D-02-00-01, North Park Block Extension — Verification of cost controls and Notes; spending/allocation notes cite D-01-01, which is not held here. O&M forecast evidence is in the closing “Review of files for O&M project costs” section.
Old Town Skatepark · estimates, funding evidence and source notes
Finance-response annual components: major maintenance $450,000; replacement $375,000. MasonsRequest A26:J26.
Original work-paper components: major maintenance $450,000; replacement $375,000, using 40 years.
Operating forecast: Identified in the later review of the Future O&M Requests for Forecast tab. The received O&M list confirms the five entries and their placeholder amounts. Absence from a future-additions tab is not proof of zero base-budget funding. Read the O&M list.
Budget association: Old Town Skatepark. Finance response MasonsRequest A26:J26 identifies P10582, matching the adopted-budget project code. This does not confirm every scope or backlog/property association.. The shared code does not confirm all scope or property links.
- The draft includes four ranger positions costing $541,494, about 62% of its total. Management/elected-official review was still pending in the sheet.
Historical work-paper notes:
- An earlier O&M estimate was $300,000 in November 2023. The work paper asks why 40 years was used for replacement.
- The allocation/spending sentence under this project says NPBE; its attribution needs confirmation from the underlying D-01-01 record.
Source: D-02-00-01, Old Town Skatepark — Verification of cost controls and Notes; spending/allocation notes cite D-01-01, which is not held here. O&M forecast evidence is in the closing “Review of files for O&M project costs” section.
University Park · estimates, funding evidence and source notes
Finance-response annual components: major maintenance not established; replacement not established. MasonsRequest A21:J21.
Original work-paper components: major maintenance not estimated; replacement not estimated.
Operating forecast: Identified in the later review of the Future O&M Requests for Forecast tab. The received O&M list confirms the five entries and their placeholder amounts. Absence from a future-additions tab is not proof of zero base-budget funding. Read the O&M list.
Budget association: University Park Amenities. Finance response MasonsRequest A21:J21 identifies P10586, matching the adopted-budget project code. This does not confirm every scope or backlog/property association.. The shared code does not confirm all scope or property links.
- The finance response says $96,000, the future-request list $54,000, and the audit work paper $150,000. The March 18, 2025 email says scope was not defined and no O&M allocations had been discussed.
Historical work-paper notes:
- A separate note calculates $54,000 as 3% of $1.8 million; it does not match the $150,000 placeholder.
- The allocation/spending sentence under this project says NPBE; its attribution needs confirmation from the underlying D-01-01 record.
Source: D-02-00-01, University Park — Verification of cost controls and Notes; spending/allocation notes cite D-01-01, which is not held here. O&M forecast evidence is in the closing “Review of files for O&M project costs” section.
Conway Slabtown · estimates, funding evidence and source notes
Finance-response annual components: major maintenance $150,000; replacement $250,000. MasonsRequest A22:J22.
Original work-paper components: major maintenance $150,000; replacement $250,000, using 20 years.
Operating forecast: Identified in the later review of the Future O&M Requests for Forecast tab. The received O&M list confirms the five entries and their placeholder amounts. Absence from a future-additions tab is not proof of zero base-budget funding. Read the O&M list.
Budget association: Conway Property Development. Finance response MasonsRequest A22:J22 identifies P10457, matching the adopted-budget project code. This does not confirm every scope or backlog/property association.. The shared code does not confirm all scope or property links.
- The finance summary names environmental cleanup phase 1; exact operating scope still needs confirmation.
Historical work-paper notes:
- The work paper describes O&M as a placeholder even though its summary marks the estimates criterion as met.
Source: D-02-00-01, Conway Slabtown — Verification of cost controls and Notes; spending/allocation notes cite D-01-01, which is not held here. O&M forecast evidence is in the closing “Review of files for O&M project costs” section.
Mill Park · estimates, funding evidence and source notes
Finance-response annual components: major maintenance $396,600; replacement $661,000. MasonsRequest A25:J25.
Original work-paper components: major maintenance $396,000; replacement $661,000, using 20 years.
Operating forecast: Not identified in that tab by the auditor. The received O&M list confirms the five entries and their placeholder amounts. Absence from a future-additions tab is not proof of zero base-budget funding. Read the O&M list.
Budget association: Mill Park Development. Finance response MasonsRequest A25:J25 identifies P10536, matching the adopted-budget project code. This does not confirm every scope or backlog/property association.. The shared code does not confirm all scope or property links.
- Finance confirms $396,600 for annual major maintenance and $661,000 for replacement. The $396,000 work-paper value is retained as a transcription.
Historical work-paper notes:
- The work paper gives $396,000 for major maintenance. Three percent of $13.22 million is $396,600. Its component sum is $1,057,000, while the published audit reports $1,057,600.
Source: D-02-00-01, Mill Park — Verification of cost controls and Notes; spending/allocation notes cite D-01-01, which is not held here. O&M forecast evidence is in the closing “Review of files for O&M project costs” section.
Laurelhurst Activation · estimates, funding evidence and source notes
Finance-response annual components: major maintenance $15,000; replacement $25,000. MasonsRequest A24:J24.
Original work-paper components: major maintenance $15,000; replacement $25,000, using 20 years.
Operating forecast: Not identified in that tab by the auditor. The received O&M list confirms the five entries and their placeholder amounts. Absence from a future-additions tab is not proof of zero base-budget funding. Read the O&M list.
Budget association: No matching title identified. Finance response D24 says P00922; FY2023–24 requested budget PDF p.95 says Laurelhurst Oak St is P00920 and O’Bryant Square is P00922. No FY2027 amount assigned.. This does not establish a zero budget.
- Finance uses P00922, while the FY2023–24 requested budget uses P00920 for Laurelhurst and P00922 for O’Bryant Square. Project ID unresolved.
Historical work-paper notes:
- The auditor questioned the reported zero spending because the site already existed. Zero is preserved as a reported value, not independently confirmed spending.
Source: D-02-00-01, Laurelhurst Park Activation — Verification of cost controls and Notes; spending/allocation notes cite D-01-01, which is not held here. O&M forecast evidence is in the closing “Review of files for O&M project costs” section.
Parklane Park · estimates, funding evidence and source notes
Finance-response annual components: major maintenance $891,000; replacement $1,485,000. MasonsRequest A27:J27.
Original work-paper components: major maintenance $891,000; replacement $1,485,000, using 20 years.
Operating forecast: Not identified in that tab by the auditor. The received O&M list confirms the five entries and their placeholder amounts. Absence from a future-additions tab is not proof of zero base-budget funding. Read the O&M list.
Budget association: Parklane Park Improvements. Finance response MasonsRequest A27:J27 identifies P10446, matching the adopted-budget project code. This does not confirm every scope or backlog/property association.. The shared code does not confirm all scope or property links.
- Finance confirms $1,485,000 annual replacement. An October 2023 garden-cost update appears below the main total; which version reached the budget remains unresolved.
Historical work-paper notes:
- The project table gives $1,485,000 for annual replacement, consistent with $29.7 million divided by 20. A later note says $661,000; that note conflicts with the table and arithmetic.
- An earlier recommendation included an O&M estimate of $465,000.
Source: D-02-00-01, Parklane — Verification of cost controls and Notes; spending/allocation notes cite D-01-01, which is not held here. O&M forecast evidence is in the closing “Review of files for O&M project costs” section.
Even one asset can have several condition ratings
The courts snapshot has separate amenity, surface and paint ratings. The Atlas calculation uses amenity condition: 59 of 240 rated records are poor or very bad. Surface condition gives 90 of 265, and paint gives 37 of 226. These are different components and denominators within the same snapshot, not evidence of a change over time.
Court fields and definitionsCheck the numbers
A condition chart is the start of the question.
The City weights its program chart by replacement value. A large, expensive asset can count much more than many small ones. That makes the definitions and denominator essential.
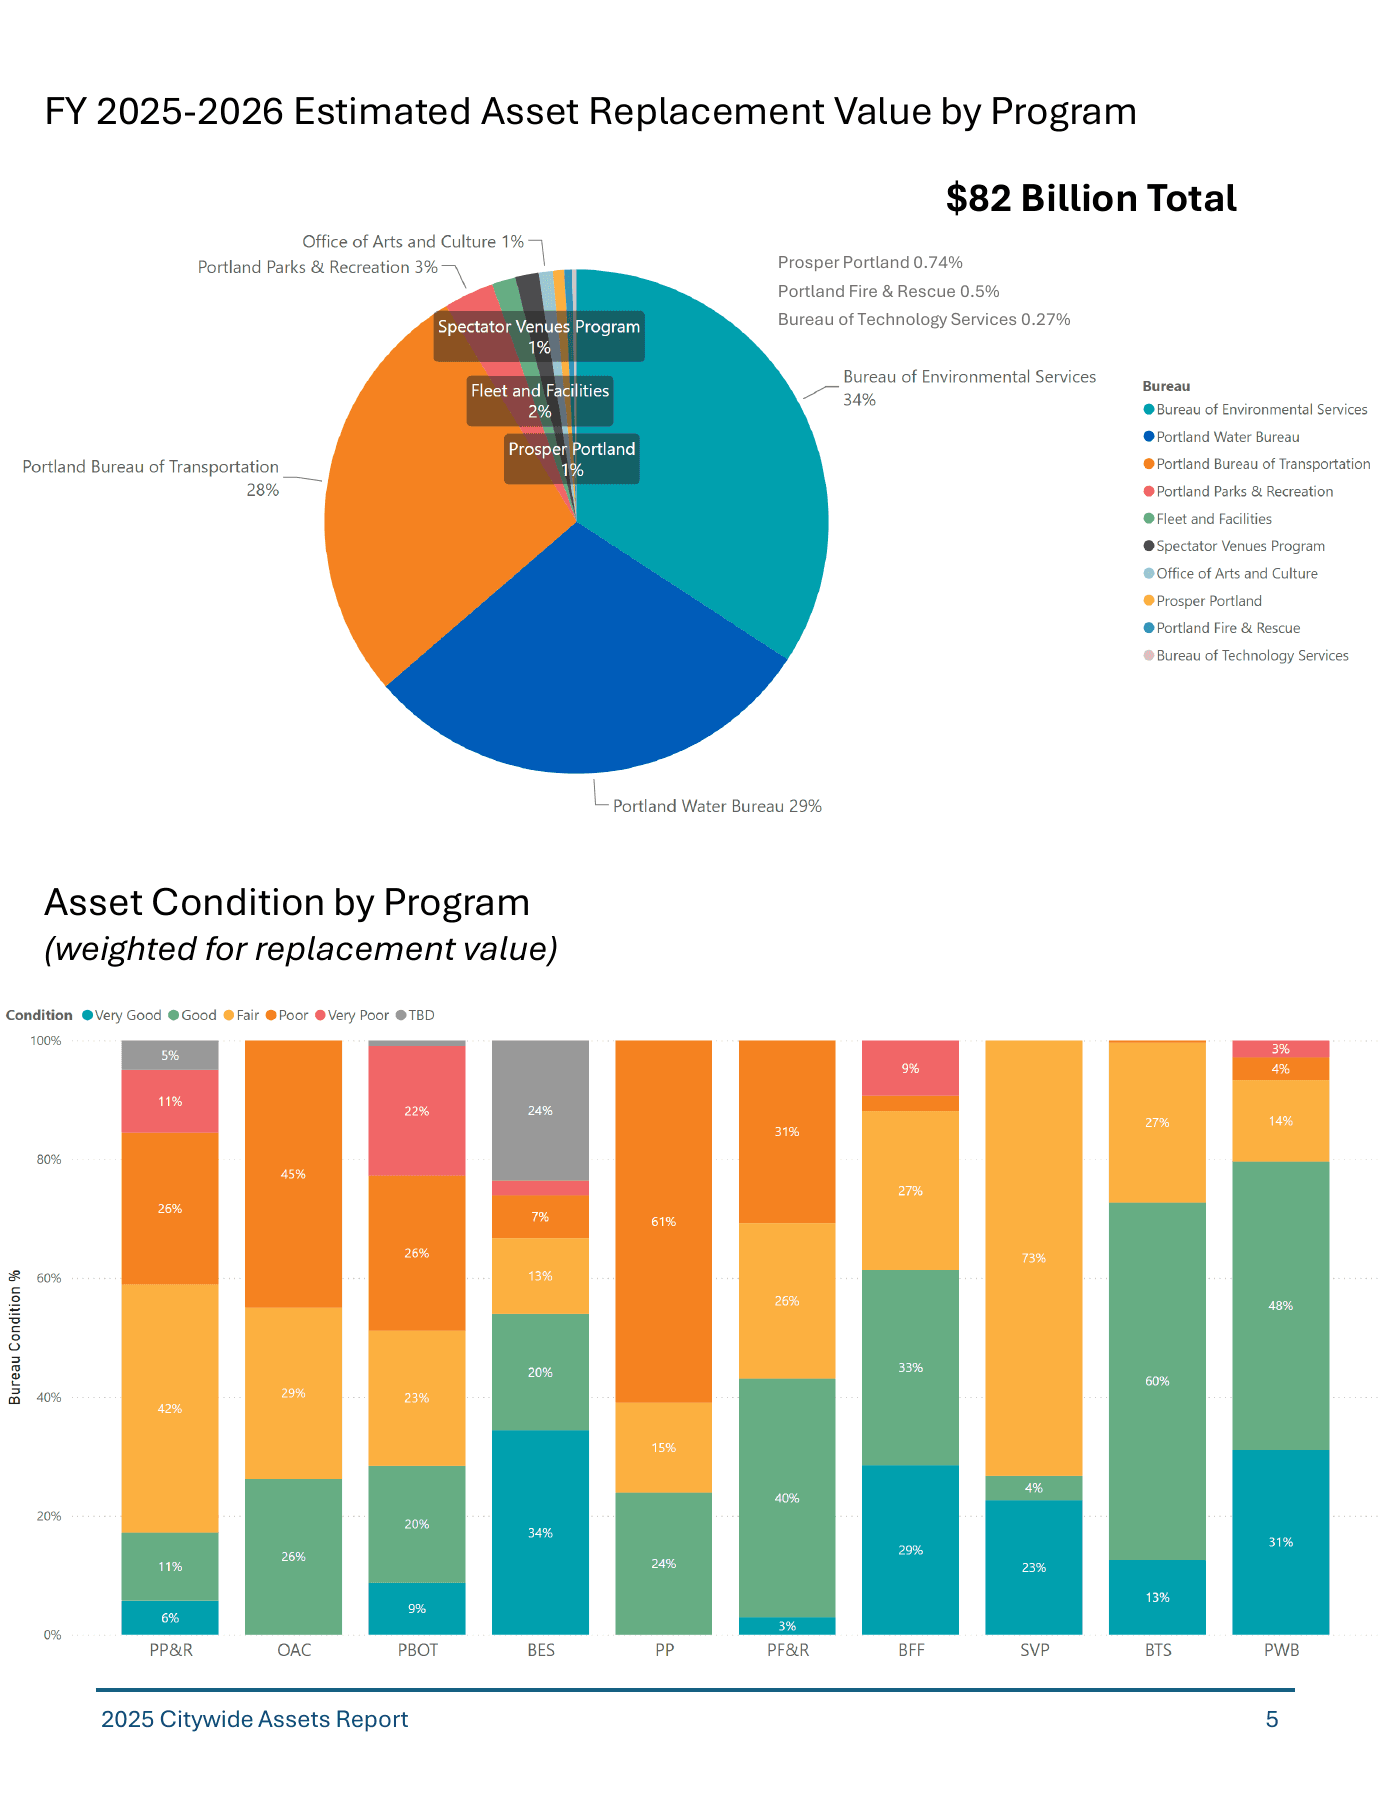
Printed page 5 / PDF page 6. Categories: very good, good, fair, poor, very poor and TBD. Small segments can lack a printed percentage; an absent label is not evidence of zero.
Open the original report · PDF p. 6Replacement value in a condition category
Total replacement value in the defined population
× 100 = share of replacement valueChange the denominator. Change the story.
Imagine a $50 million portfolio: $10 million in good condition, $30 million poor, and $10 million unassessed. These are hypothetical values.
- Good: 20%
- Poor: 60%
- Unknown: 20%
Denominator: $50 million. Unknown condition stays visible as 20% of the portfolio.
Physical condition is not the whole decision.
Failure consequences, service levels, seismic and climate risks, accessibility, equity and operating costs also matter. A low-condition asset may have a different investment priority from a critical asset with a different risk profile.
FIN 2.19 · Asset management principles · PDF p. 2Read the chart’s printed percentages as a table
This is a transcription, not an independent recalculation. “Unlabelled” means no percentage is printed for that category; it does not mean zero. Rounded labels may not total 100% (Parks totals 101%). Values have not been normalized.
| Portfolio | Very good | Good | Fair | Poor | Very poor | TBD |
|---|---|---|---|---|---|---|
| Parks & Recreation | 6% | 11% | 42% | 26% | 11% | 5% |
| Arts & Culture | Unlabelled | 26% | 29% | 45% | Unlabelled | Unlabelled |
| Transportation | 9% | 20% | 23% | 26% | 22% | Unlabelled |
| Environmental Services | 34% | 20% | 13% | 7% | Unlabelled | 24% |
| Prosper Portland | Unlabelled | 24% | 15% | 61% | Unlabelled | Unlabelled |
| Fire & Rescue | 3% | 40% | 26% | 31% | Unlabelled | Unlabelled |
| Fleet & Facilities | 29% | 33% | 27% | Unlabelled | 9% | Unlabelled |
| Spectator Venues | 23% | 4% | 73% | Unlabelled | Unlabelled | Unlabelled |
| Technology Services | 13% | 60% | 27% | Unlabelled | Unlabelled | Unlabelled |
| Water | 31% | 48% | 14% | 4% | 3% | Unlabelled |
Two differences worth checking.
These are reasons to obtain the source tables, not enough evidence to decide which figure is correct.
Environmental Services
The narrative describes roughly 23% unknown; the summary chart labels 24% TBD.
BES narrative · PDF p. 11Technology Services
The narrative says about 85% good or very good; the chart labels sum to 73% (13% + 60%).
BTS narrative · PDF p. 25The missing-information register
What we still need to know.
Eight gaps stand between the published summaries and a fully checkable account of Portland’s assets. Each entry names the missing evidence, why it matters and what it would make possible.
8 of 8 evidence gaps · These describe this evidence set, not whether records exist inside the City.
The workbook behind the condition chart
- Available
- The published chart and bureau narratives in the 2025–26 report.
- Missing here
- The versioned workbook, bureau submissions, formulas and intermediate aggregation tables used for the chart.
- Why it matters
- Without them, the percentages can be transcribed but not independently reproduced or reconciled.
Recompute every program’s replacement-value denominator and retain the unknown-condition share.
Asset registers with stable identifiers
- Available
- Portfolio summaries and selected public GIS service and field definitions for PBOT, Parks and BES.
- Missing here
- Dated register exports, data dictionaries, ownership and maintenance roles, asset IDs and explicit coverage statements for each portfolio.
- Why it matters
- A map or asset count would otherwise imply completeness the available records do not establish.
Connect line items to locations and service responsibilities without double counting.
Condition dates, methods and confidence
- Available
- The report describes a mix of inspections, age estimates and other condition methods.
- Missing here
- Assessment dates, category thresholds, measured versus modeled flags, unknowns and uncertainty by asset class.
- Why it matters
- The same label can represent different evidence, and an old inspection is not a current observation.
Compare like with like and separate physical condition from service risk.
Line items behind the $14 billion gap
- Available
- The City’s ten-year estimate and bureau assumptions. The Parks audit, work papers and released funding files supply historical approvals, detailed O&M calculations and forecast placeholders. They do not establish current operating/lifecycle funding or reconcile to the citywide gap.
- Missing here
- Project and asset-level needs, current funded amounts, timing, inflation basis, scope, operating costs and confidence ranges, including updated funding plans for the Parks audit sample.
- Why it matters
- The headline cannot tell residents which services are at risk, what is deferred, or what an additional dollar would accomplish.
Trace the total to projects and distinguish maintenance, renewal, expansion and resilience spending.
A reconciled list of omitted assets
- Available
- Appendix disclosures about land, natural areas, selected equipment and small portfolios.
- Missing here
- An exclusions ledger with responsible bureau, reason, value basis and treatment in each citywide total.
- Why it matters
- A missing value is not a zero. Shared ownership and maintenance roles can also lead to double counting.
State exactly what the citywide estimate covers, and what sits outside it.
The final disposition of Concept 26684
- Available
- The February data-platform proposal and the separate May Data and Privacy Office amendment.
- Missing here
- A decision trail through approved and adopted budgets, position schedules, supplemental changes and allocations for Concept 26684.
- Why it matters
- The office amendment does not prove that the platform proposal was funded, replaced or rejected.
Identify the actual authorized platform resources and distinguish appropriations from spending.
An accountable implementation schedule
- Available
- The chief asset officer’s September 2026 appointment, the public strategy, and the Parks audit’s dated management commitments. These establish actions and intended work, not completion of every recommendation.
- Missing here
- A public implementation schedule with named responsible offices, funded capacity, milestones, deliverables and dated completion evidence.
- Why it matters
- A strategy’s publication does not demonstrate that its proposed governance or shared data systems are operating.
Track completed work against documented commitments without inventing deadlines.
Comparable figures across reporting years
- Available
- The annual report collection from 2007 onward, including the special 2022 maturity and funding assessment.
- Missing here
- Crosswalks for changing portfolio boundaries, valuation methods, price bases and condition definitions.
- Why it matters
- A rising replacement value may reflect inflation or expanded coverage rather than an increase in assets or deterioration.
Build a historical series only where the same measure can be compared over time.
Rules & responsibility
There are already tools for getting specific.
Existing policy sets expectations for inventories and reporting. The Charter gives councilors a way to inspect official records, and the full Council can require reports. A new strategy does not erase those existing mechanisms.
What can a resident do?
Residents can use the City’s public records process to seek identifiable existing records. The City’s ARA 8.03 rule and request guidance explain that process, including fees and applicable limits. The official links below should be consulted for current requirements.
What progress can we document?
Leadership is in place. Delivery still needs evidence.
A chief asset management officer
The City announced that Emily Tritsch began the role on September 30, 2026, reporting directly to the City Administrator. Her remit includes standards, risk, lifecycle planning, data governance and performance reporting.
Official appointment announcementA published direction for the work
The City published its strategy online on October 7. The public-download PDF matches the Council copy archived here. Publication documents a strategy; it does not by itself establish that a register, risk framework or funding plan is operating.
Public strategy page“Pending” is a monitoring status.
The asset-management recommendation displayed Pending, with no follow-up date or link. The dashboard defines that label as a new recommendation for which an update has not yet been requested. It is not the same as Not Implemented, and the display may lag later work.
Official recommendation dashboard Download dated observationThe 2024 Audit Impact Report, published October 2025, explains the annual evidence-review process. Its overall implementation rate describes an earlier audit cohort, not completion of this work. Impact report · methods and limitations
Policy history
From commitments to evidence of delivery.
The records show successive efforts to improve the system. A policy, an audit recommendation, an appropriation and a finished implementation are different kinds of evidence.
- 2009Resolution
Open-data direction
Resolution 36735 establishes an early City commitment to open data. It is part of the policy history, not proof that an asset register is available.
Read the record - 2017Ordinance
Open-data policy and governance
Ordinance 188356 and its exhibits set out open-data policy and governance. Publication still requires attention to data quality and applicable protections.
Read the record - 2021Binding policy
Asset management becomes a City policy
FIN 2.19 establishes bureau duties for inventories, condition and costs, long-term planning and annual reporting.
Read the record - Apr 2025Audit finding
Audit identifies a governance gap
The Auditor calls for authority, citywide prioritization and a long-term funding strategy. The City Administrator’s response agrees with the recommendations.
Read the record - Aug 2025Council direction
Council requires a citywide strategy
Resolution 37715 directs development of a citywide asset management strategy.
Read the record - Oct 2025Audit finding
Parks audit examines eight growth projects
The audit finds missing major-maintenance and lifecycle funding plans in its eight-project sample. Management agrees with the recommendations and provides dated targets.
Read the record - 2026Code / ordinance
Data and Privacy Office established
Chapter 3.39 defines the office’s responsibilities, including data governance and advice on disclosure, privacy and security with the City Attorney.
Read the record - Sep 2026Appointment
Chief asset management officer starts
The City announces Emily Tritsch’s September 30 start, reporting to the City Administrator and leading citywide asset management work.
Read the record - Oct 2026Placed on file
Strategy presented to Council committee
The October 13 Council record lists the strategy presentation as placed on file. That status alone does not establish adoption of every proposed action or completion of implementation.
Read the record
Governance. A citywide register. Common risk methods.
The strategy identifies these three actions as foundational and says the Chief Asset Management Officer should prioritize them in the first year. The document is evidence of intended sequencing; a public schedule and completion records are still needed to assess delivery.
Conclusion and implementation · printed p. 25 · PDF p. 26Follow the funding
Two budget records that should not be conflated.
BTS data-platform services
$892,407 ongoing / 3.0 FTEConcept 26684 appears in the budget scenario options. Its final disposition has not been established in this evidence set.
Budget scenario options · PDF p. 105Data and Privacy Office realignment
$807,059 total change / DP 27233The Novick–Morillo 1 amendment passed 12–0. This is a separate office realignment, not a documented answer to the platform proposal’s fate or evidence of actual spending.
Amendment detail · PDF p. 51 Recorded vote · PDF p. 89The source library
Read the records. Check the claims.
Annual reports, the audit, policies, budget records and selected public-data definitions. Documents link to official publications, identified public mirrors or copies released by Audit Services. The funding-file collection includes original spreadsheets and a labelled email excerpt. Identical files are grouped together.
102 of 102 documents · 105 source records; identical files grouped
October 13 2026 Citywide Asset Management Strategy council record
Archived 2026-10-20 · Reading copy omits website formatting
Citywide Asset Management Strategy October 2026
Archived 2026-10-20 · Original PDF preserved
Also published at 1 identical source
Citywide Asset Management Strategy (public report download)2025–2026 Citywide Asset Management Report
Archived 2026-10-20 · Original PDF preserved
Also published at 1 identical source
2025-26 Citywide Assets ReportCitywide Asset Reports official index
Archived 2026-10-20 · Reading copy omits website formatting
Asset Management audit published April 23 2025
Archived 2026-10-20 · Reading copy omits website formatting
Asset Management audit April 2025
Archived 2026-10-20 · Original PDF preserved
City Administrator response to asset management audit
Archived 2026-10-20 · Original PDF preserved
FIN 2.19 Asset Management Policy
Archived 2026-10-20 · Original PDF preserved
Ordinance 188356 exhibits A and B
Archived 2026-10-20 · Original PDF preserved
Chapter 3.39 City Data and Privacy Office
Archived 2026-10-20 · Reading copy omits website formatting
Ordinance 192143 establishing City Data and Privacy Office
Archived 2026-10-20 · Reading copy omits website formatting
Resolution 37736 directing City Data and Privacy Office
Archived 2026-10-20 · Reading copy omits website formatting
The annual collection follows the City’s published index: 2007–2019, 2021, the special 2022 assessment, 2023, 2024 and 2025–26. No separate 2020 report is listed in that index. The library is a curated collection, not a claim to contain every asset-related City record. Official annual report index
Methods & corrections
Make the limits as visible as the numbers.
Evidence boundaries
The principal source is the 2025–26 Citywide Assets Report. The initial sources were preserved October 20, 2026, with Council authority references added October 22 and Parks audit, management response, policy and leadership records added October 23. The Parks project-table sum has been checked against the published total. On October 27, dated Parks Atlas extracts were reconciled across project, condition, historical-cost and adopted-budget records. Their supporting rows and limitations are downloadable above. On November 1, two released audit work papers added historical project allocations, reported spending, operating-cost estimates, calculation notes and a model screenshot. Working notes and unresolved inconsistencies are identified separately from the final audit. On November 3, 29 funding-file records supplied the finance response, future O&M requests and approval history. Seven budget associations now have matching historical project IDs; Laurelhurst has conflicting IDs. We reproduced six detailed O&M totals using saved unit costs, counts, inflation and adjustments, without refreshing external workbook links. This verifies arithmetic, not the inputs, service assumptions or current funding. The citywide valuation, funding gap and condition chart remain unreproduced.
PDF page numbers count from the first file page. Printed page numbers can differ. An archived web page is provided as extracted text, which can lose layout and links.
Comparisons and updates
Reported totals use their stated price year and portfolio scope. We do not turn historical headline totals into a trend until changes in methods, prices and coverage can be reconciled.
Future evidence should identify the source version, calculation, changed conclusion and remaining uncertainty. There is no implied completion date for missing City records.
Help make the evidence better
A missing source, a correction, a better question?
Share a public record or a specific correction with its source and page reference.